¶ A claustrum in reptiles and its role in slow-wave sleep
Hiroaki Norimoto1†, Lorenz A. Fenk1†, Hsing-Hsi Li1♢, Maria Antonietta Tosches1,2♢, Tatiana Gallego Flores1, David Hain1,3, Sam Reiter1,4, Riho Kobayashi1,5, Angeles Macias1, Anja Arends1, Michaela Klinkmann1 and Gilles Laurent1*
† equal first-authors
♢ equal second-authors
1 Max Planck Institute for Brain Research, Frankfurt am Main, Germany
2 Present address: Department of Biological Sciences, Columbia University, NYC, NY, USA
3 Departement of Life Sciences, Goethe University, Frankfurt am Main, Germany
4 Present address: Okinawa Institute of Science and Technology Graduate University, Okinawa, Japan
5 Permanent address: Department of Neuropharmacology, Graduate School of Pharmaceutical Sciences, Nagoya City University, Nagoya, Japan
* Corresponding author (GL): gilles.laurent@brain.mpg.de
https://www.nature.com/articles/s41586-020-1993-6
The mammalian claustrum, owing to its widespread connectivity with other forebrain structures, has been hypothesized to mediate functions ranging from decision making to consciousness1. We report here that a homolog of the claustrum, identified by single-cell transcriptomics and viral tracing of connectivity, exists also in a reptile, the Australian dragon Pogona vitticeps. In Pogona, the claustrum underlies the generation of sharpwaves during slow-wave sleep. The sharp-waves, together with superimposed highfrequency ripples2, propagate to the entire neighboring pallial dorsal ventricular ridge (DVR). Uni- or bilateral lesions of the claustrum suppress sharp-wave ripple production during slow-wave sleep uni- or bilaterally, respectively, but do not affect the regular and rapidly alternating sleep rhythm characteristic of Pogona sleep3. The claustrum is thus not involved in sleep-rhythm generation itself. Tract-tracing revealed that the claustrum projects widely to a variety of forebrain areas, including the cortex, and that it receives converging input, among others, from mid- and hind-brain areas known to be involved in wake/sleep control in mammals4-6. An imposed periodic modulation of serotonin concentration in claustrum, for example, caused a matching modulation of sharp-wave production there and in neighboring DVR. Using transcriptomic approaches, a claustrum was identified also in turtles, a distant reptilian relative of lizards. The claustrum is therefore an ancient structure, likely present already in the brain of the common vertebrate ancestor of reptiles and mammals. It may play an important role in the control of brain states due to ascending input from the mid- and hindbrain, to its widespread projections to the forebrain and to its role in sharp-wave generation during slow-wave sleep.
Slow-wave sleep (SWS) and rapid-eye-movement sleep (REMS) are the two main macroscopic components of electrophysiological sleep in mammals and birds4-6, though some mammals may lack REM7. The recent finding of alternating SWS and REMS in a reptile, the Australian dragon Pogona vitticeps3, suggests that these two sleep modes may predate the diversification of amniotes 320M years ago. Sleep in Pogona is particularly interesting because its cycle is very short (≤3 minutes at room temperature) and divided equally into SWS and REMS3.
The dominant electrophysiological feature of Pogona SWS is energy in the δ band (~0-4 Hz) caused by the reliable occurrence of sharp-waves. Sharp-waves typically contain a highfrequency ripple, forming a sharp-wave ripple complex (SWR2). SWRs were recorded from the dorsal ventricular ridge (DVR)8, the dominant non-cortical pallial domain of sauropsid brains8-10. REMS, by contrast, is characterized by broad-band energy, measured in the β band (10-40 Hz) in cortex and DVR3.
¶ Origin of sharp-waves during SWS
SWRs occur reliably in DVR during SWS and SWS alternates regularly with REMS (Fig. 1ac; Ext. Data Fig. 1), as reported3. High-frequency ripples (~70-150 Hz) rode on each sharpwave and contained action potentials. Local field potentials (LFPs) were highly correlated across DVR recording sites (peak corr.=.74 over 18h of SWS, mean over 2 animals), but sharpwaves recorded in the anterior medial pole of DVR (amDVR) preceded their counterparts in more posterior or lateral regions by up to 200ms, depending on recording-sites spacing (Fig. 1d-e and Ext. Data Fig. 1g-h), suggesting SWR propagation.
We next recorded from thick anterior transverse, horizontal and para-sagittal slices of DVR in ACSF (Methods, Ext. Data Fig. 2a-f). All configurations produced spontaneous SWRs, matching those produced in sleep: biphasic waveform (119±40 ms) with ripple (~70-150 Hz) on the trough. SWRs in slices were less frequent than during SWS, (12.4±1.8min-1, 12 slices, 10 animals; vs. 16.45±0.98min-1 during SWS; 5 SWS epochs from 2 sleeping animals) though not significantly so (p=0.18, Student’s t-test). SWR production in slices was not rhythmically interrupted by REMS-like activity, as it is during sleep. We patched 12 DVR neurons (Ext. Data Fig. 2g-j); consistent with sleep data, they typically fired 0-3 action potentials during SWRs and were silent in between. Under voltage-clamp (n=2), neurons displayed coincident excitatory and inhibitory input during sharp-waves (excitation dominating in current-clamp).
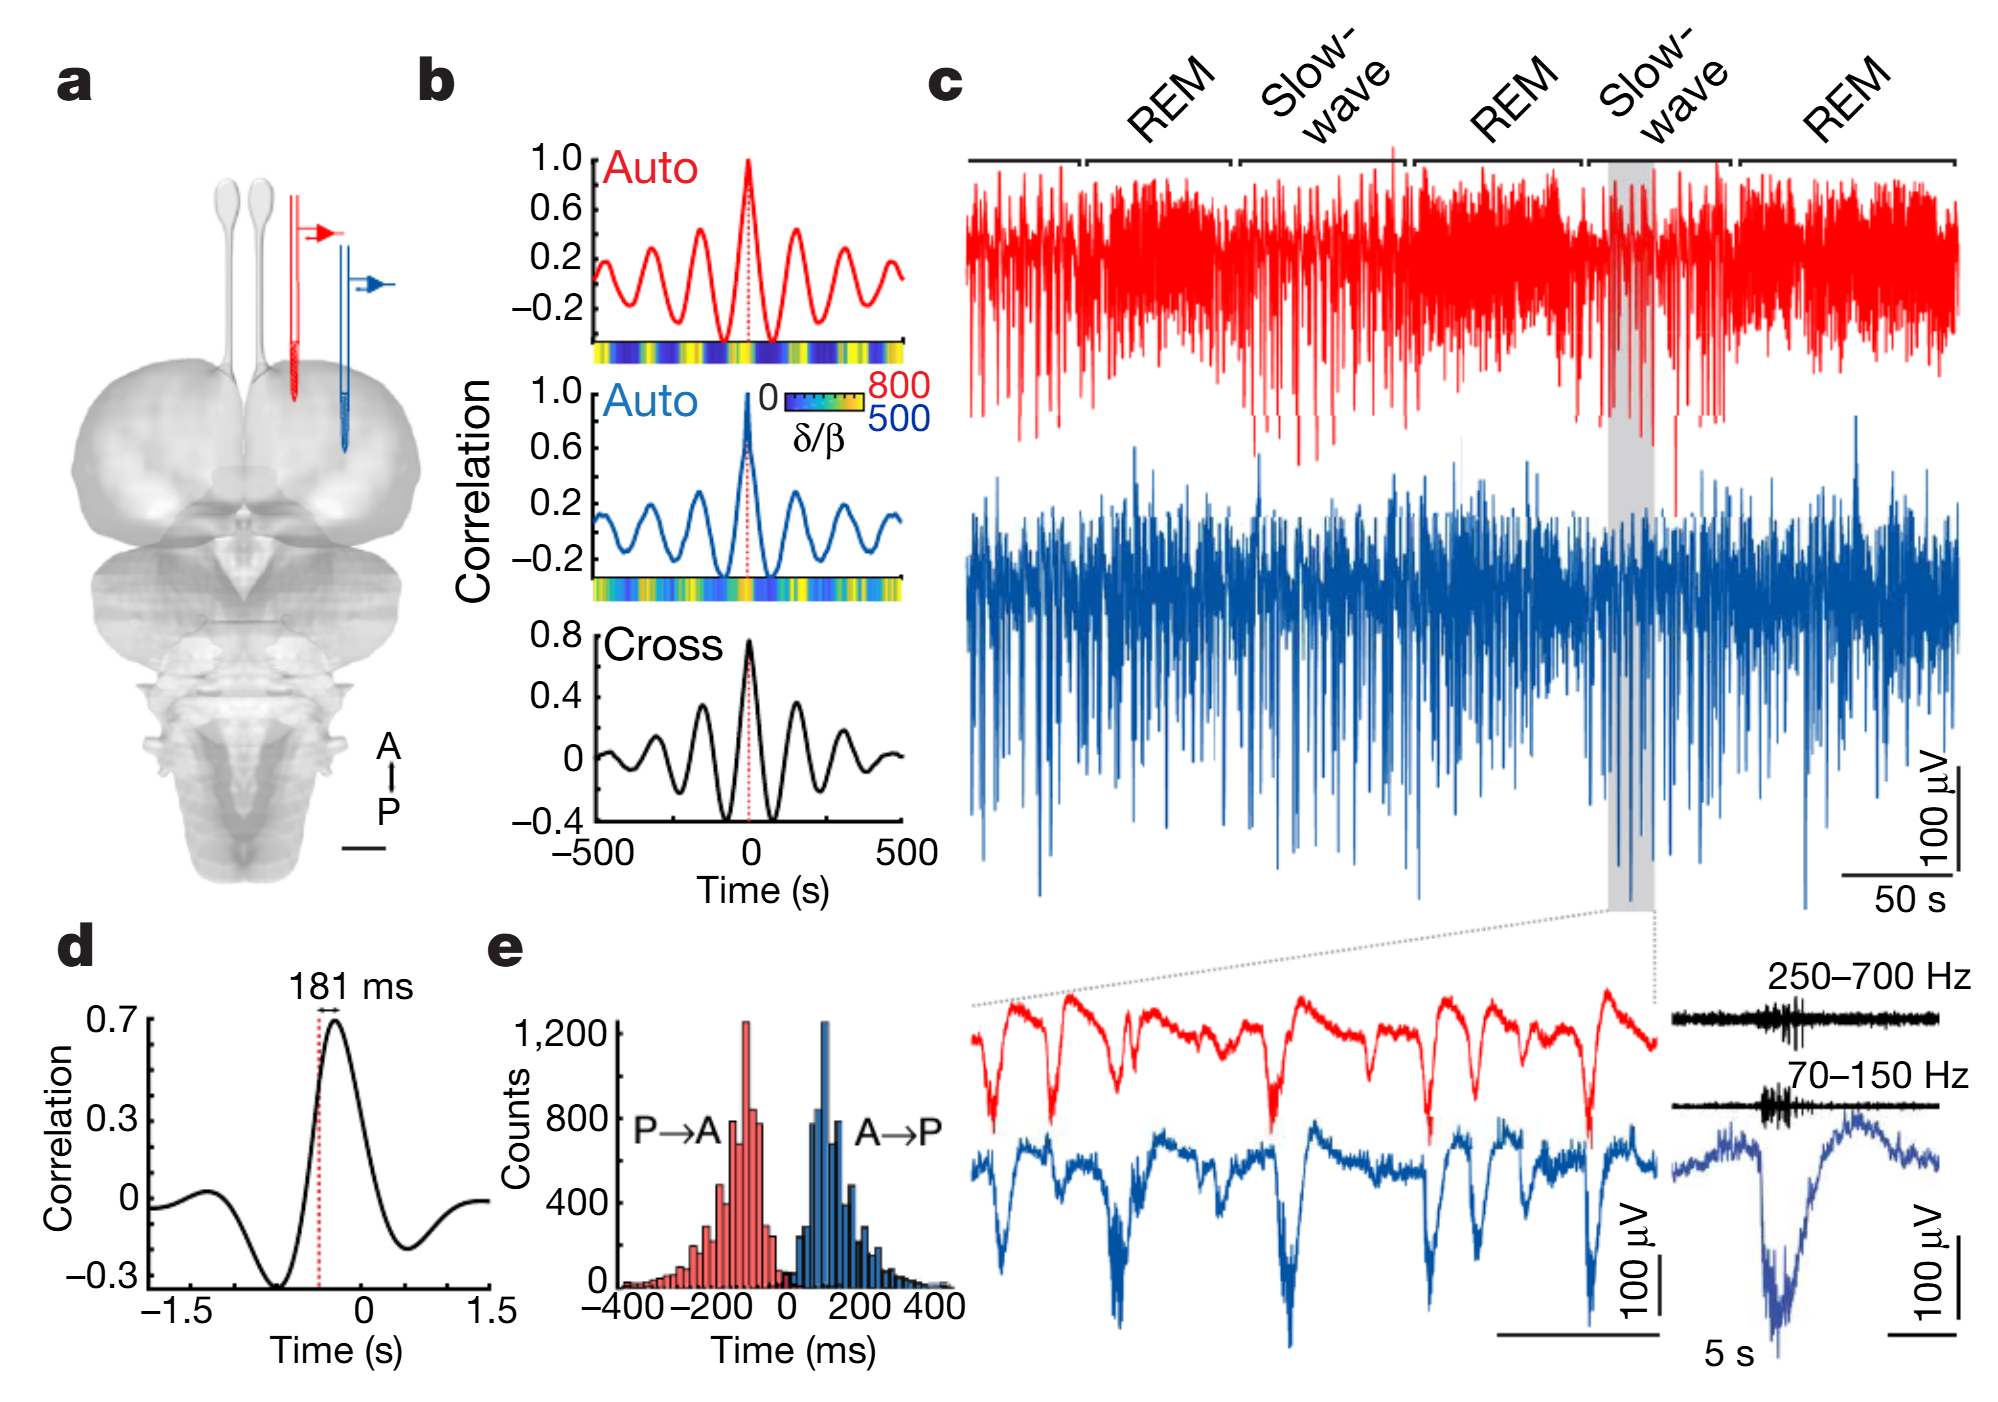
Fig. 1 | SWRs originate in the amDVR in sleeping Pogona. a, Simultaneous recordings from two sites in the DVR (subcortical). A, anterior; P, posterior. Scale bar, 1mm. b, Auto- and cross-correlations of the δ/β power ratio as function of time from sites in a, calculated over 8h of sleep. Coloured strips show the δ/β ratio over one single 1,000-s stretch of sleep. c, Short segment of the data that were analysed in b (same trace colours). Bottom left, magnification of a short segment of slow-wave sleep, illustrating SWR coordination and anterior–posterior delay. Bottom right, detail of a SWR and high-pass components (middle and top, black). d, Cross-correlation between broadband LFP waveforms © during 3.42h of SWS. Reference trace is the anterior recording site: the anterior site leads. e, Delay distribution of sharp waves in the anterior (or posterior) DVR triggered on simultaneously recorded posterior (or anterior) DVR. See Methods and Extended Data Fig.1.
We also used multielectrode arrays on DVR slices (n=3 brains; Methods). As observed in vivo, SWRs propagated from anteromedial to lateroposterior poles (Fig. 2a-c). The apparent linear velocity of the wave in the slice plane was 39mm.s-1, although propagation contained local angular components. We further divided DVR slices into “mini-slices” (n=13, Fig. 2d). Only those from the anteromedial pole produced SWRs, at rates of 11.9±1.7min-1 (Fig. 2e-f), not different from control.
¶ scRNA-seq indicates a claustrum homolog
Using a single-cell transcriptomic strategy, we recently mapped the main neuron types of the reptilian pallium11 and described heterogeneity among glutamatergic cell types in the Pogona DVR. To characterize amDVR, we generated a deeper and more extensive sampling of Pogona single cells (Methods). Using unsupervised graph-based Louvain clustering on transcripts from 20,257 cells, we identified 4,054 pallial glutamatergic neurons forming 29 glutamatergic clusters (Fig. 3a and Ext. Data Fig. 3).
We located these clusters in the Pogona telencephalon using the expression of cluster-specific markers detected by in situ hybridization (ISH) and/or immunohistochemistry (IHC)11. Two clusters (19 and 20, Fig. 3a) mapped to amDVR, as shown by the expression of the calciumbinding protein hippocalcin (HPCA) and the RNA-editing enzyme ADARB2 among others (Fig. 3b-d). Clusters 19 and 20 corresponded to lateral and medial amDVR subdivisions, respectively labeled by expression of the copine 4 (CPNE4) and nuclear hormone receptor RORB genes (Fig. 3e-f). We repeated mini-slice SWR recordings and labeled those slices post hoc with a hippocalcin antibody: only hippocalcin-positive mini-slices from the amDVR pole generated SWRs (Ext. Data Fig. 4).
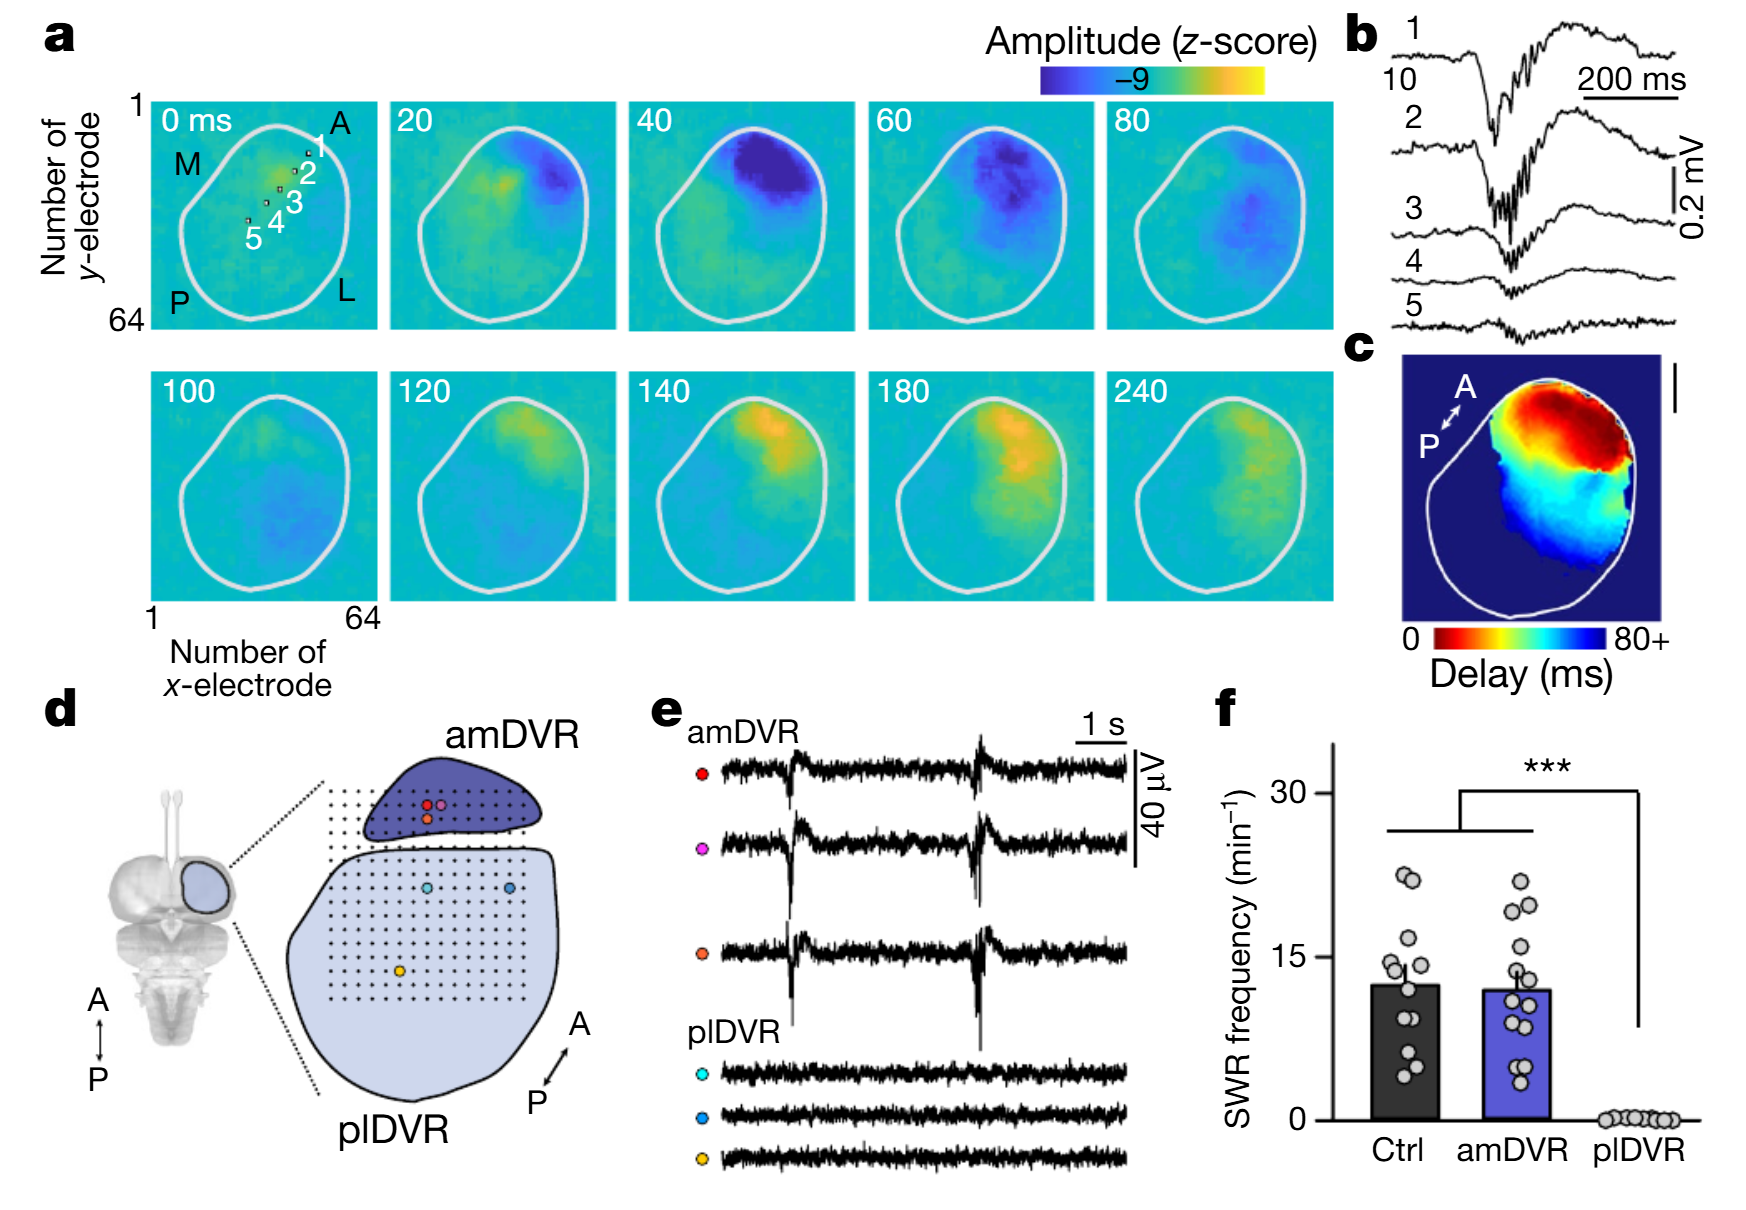
Fig. 2 | SWRs occur spontaneously in DVR slices and originate at the anterior medial pole. a–c, CMOS–MEA (complementary metal oxide semiconductor–microelectrode array) recordings of SWRs (see also Extended Data Fig.2) propagating across a horizontal slice of the DVR (outlined). a, Instantaneous voltage samples at an interval of 20–60ms. Squares 1–5 indicate the recording sites shown in b. Note the initiation at the anterior pole. L, lateral; M, medial. b, SWRs from sites 1–5 in a. Note the differences in amplitude and onset time between sites. c, Signal latency (relative to the earliest channel) over slice plane (mean of 12 SWRs; same slice as in a). Scale bar, 1mm. d–f, SWRs in mini-slices. A252-site microelectrode array, 200-μm pitch. d, Thick horizontal slices of DVR were subdivided. e, Simultaneous LFPs recorded from coloured sites in d. plDVR, posterior lateral DVR. f, Mean frequency of SWRs in intact slices (control (ctrl); n=12 slices); amDVR (n=13 mini-slices); and plDVR (n=9 mini-slices). ***P<0.001. P values: control versus amDVR, P=1, t23=0.04; control versus plDVR, P=7.2×10⁻⁶; t19=6.3; amDVR versus plDVR, P=4.6×10⁻⁶, t19=6.3 (two-sided Bonferroni test). Data are mean±s.e.m.
Some amDVR markers (e.g., GNG2, SYNPR and RGS12, Fig. 3b) are known markers of the mammalian claustrum12. To explore these molecular similarities further, we used Seurat v3 to project Pogona single-cell transcriptomes on mouse cell-type transcriptomes13 on the basis of a joint dimensionality reduction analysis (14, Methods). About 63 and 75 percent of amDVR cells (clusters 19 and 20, respectively) projected onto the mouse claustrum transcriptomic cluster (Fig. 3g), suggesting that Pogona amDVR and mammalian claustrum are homologous, consistent also with developmental observations10,15.
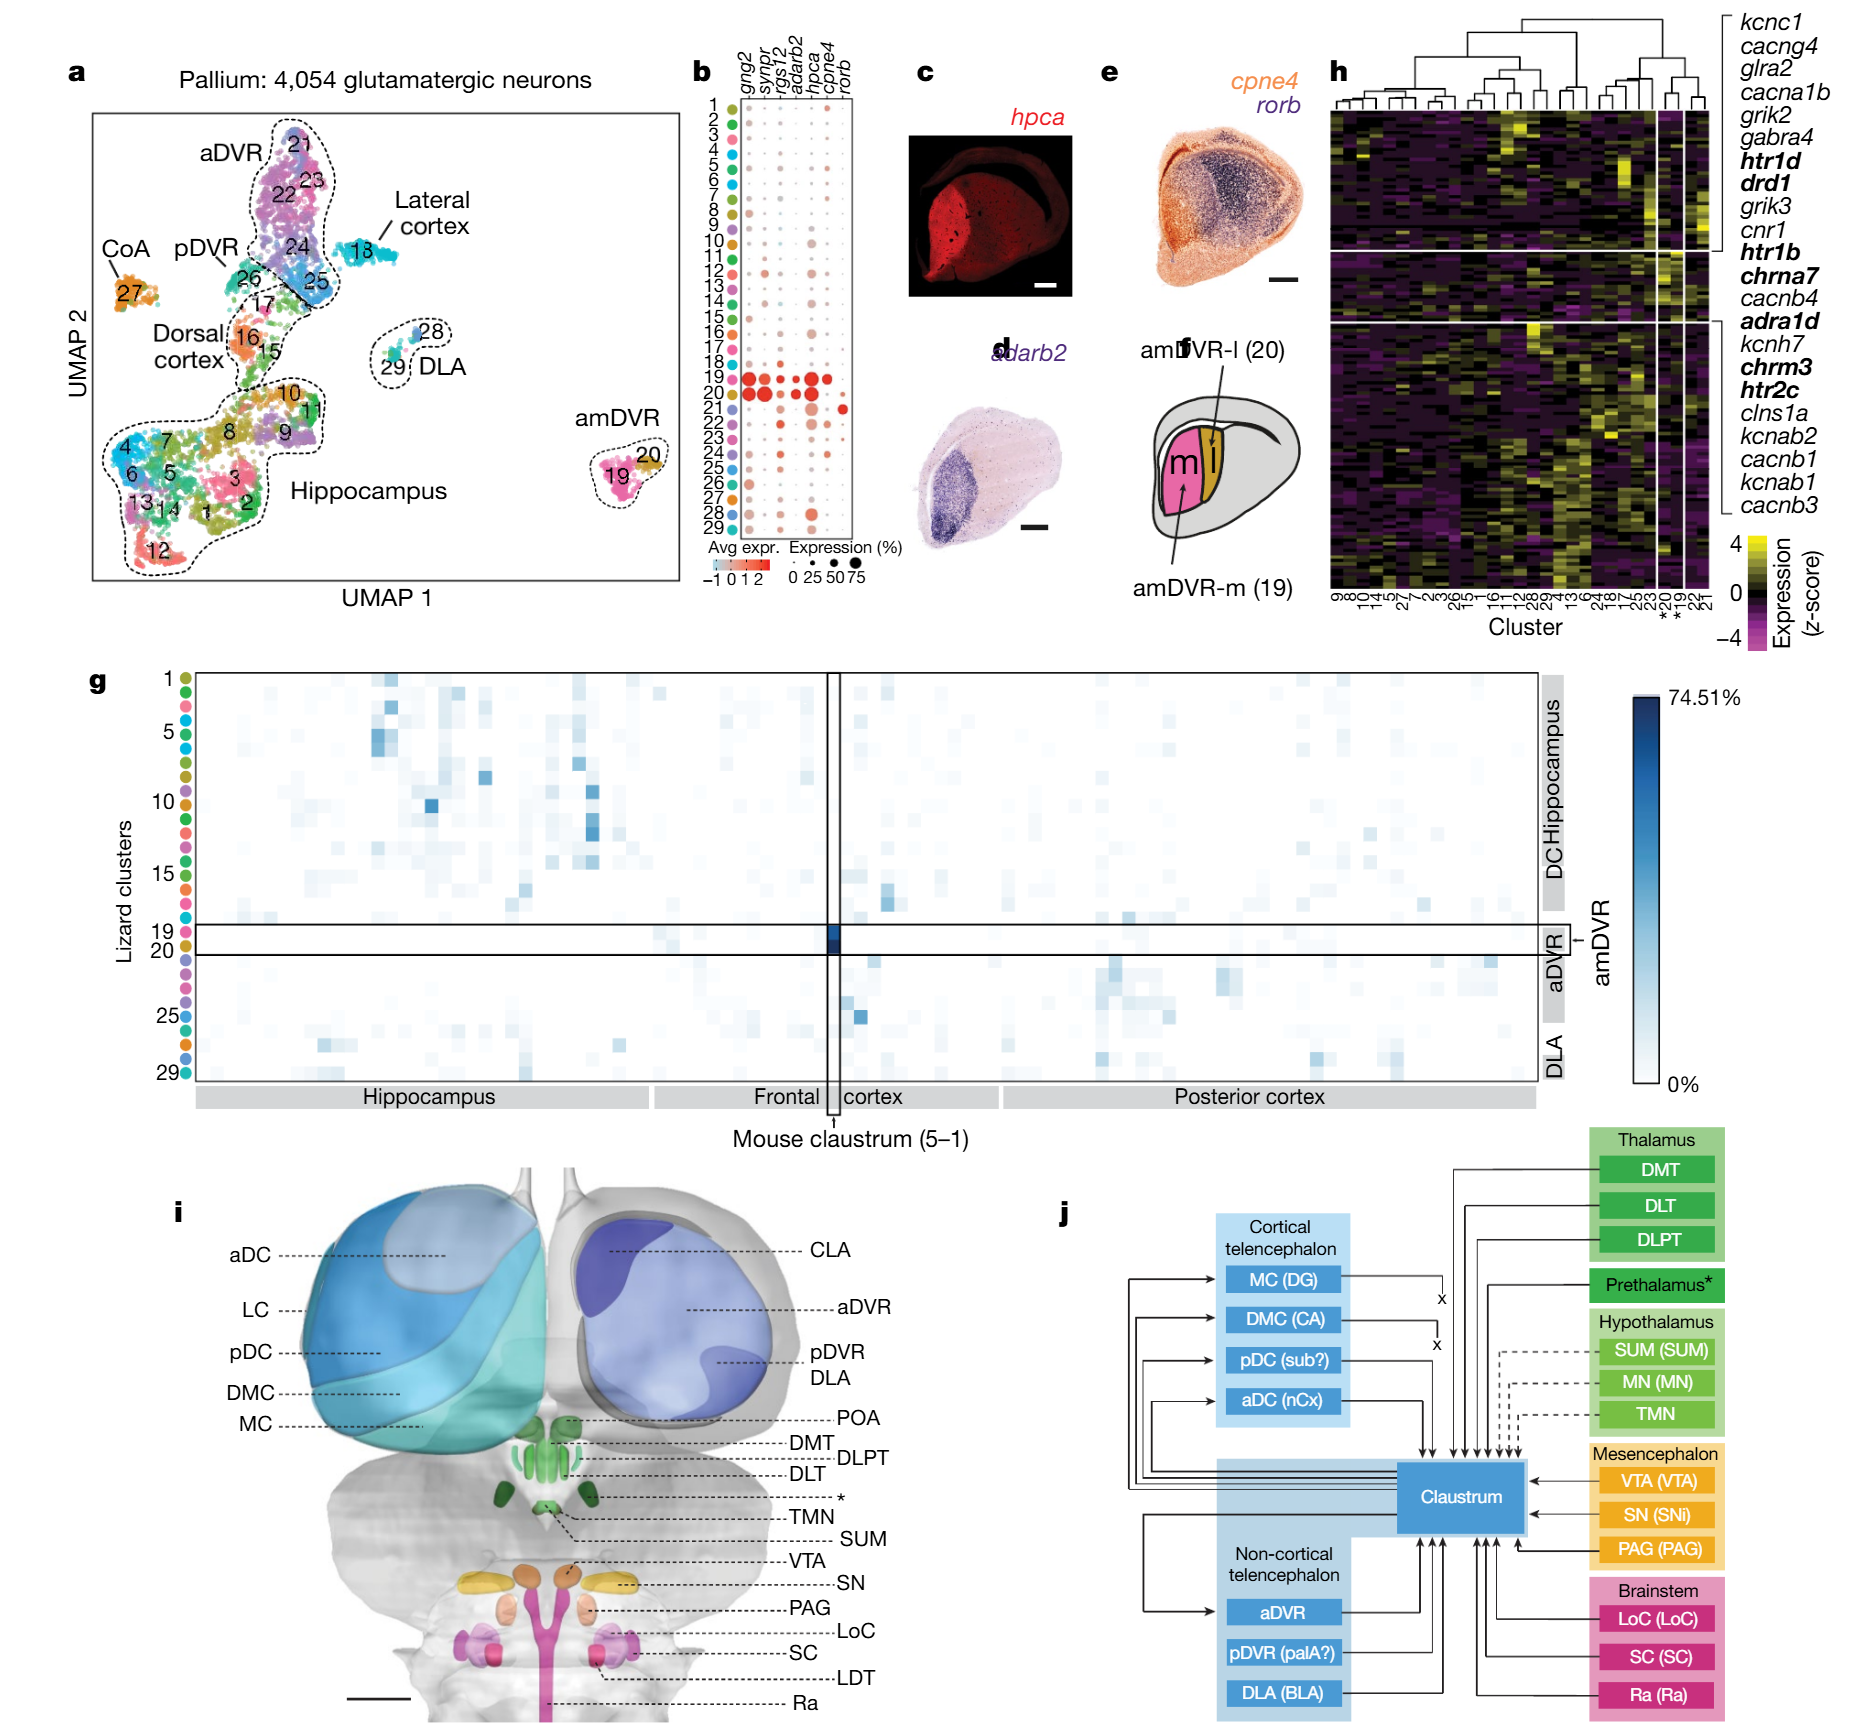
Fig. 3 | scRNA-seq and viral tract tracing show that the amDVR is a reptilian claustrum. a, Uniform manifold approximation and projection (UMAP)42 representation of single-cell transcriptomes of 4,054 Pogona glutamatergic pallial neurons. Cells are colour-coded by cluster (1–29). CoA, cortical amygdala; DLA, dorsal lateral amygdala. See Extended Data Figs.3, 5. b, Expression across clusters of marker genes with high, specific expression in the amDVR (clusters 19, 20). These include markers of the mammalian claustrum. The size of the dot corresponds to the fraction of cells in which the gene is detected and the colour represents the expression level. c–e, Anterior transverse sections of Pogona telencephalon with immunostaining for hippocalcin (hpca) ©, in situ hybridization for adarb2 (d) and double in situ hybridization with cpne4 and rorb probes (e). Scale bars, 500μm. f, Diagram showing the medial (m) and lateral (l) subdivisions of the amDVR. g, Transcriptomic similarity between lizard and mouse clusters, measured as the fraction of single-cell transcriptomes that map from Pogona to mouse clusters (Methods; mouse data are from a previous study13). h, Average expression in the Pogona clusters of 143 ion-channel and neurotransmitter-receptor genes (Extended Data Fig.5). Clusters 19 and 20 (marked with an asterisk) correspond, respectively, to the medial and lateral subdivisions of the amDVR shown in f. Genes with enriched expression in the amDVR are listed on the right, with relevant neurotransmitter receptor genes in bold. i, Schematic of the Pogona brain. Forebrain areas (blue) were identified by scRNA-seq and in situ hybridization11. Diencephalic (green), mesencephalic (orange) and rhombencephalic (pink) areas were identified by immunohistochemistry and FISH (see Extended Data Fig.6). aDC, anterior dorsal cortex; CLA, claustrum; DLT, dorso-lateral thalamus; DLPT, dorso-lateral posterior thalamus; DMC, dorso-medial cortex; DMT, dorso-medial thalamus; LC, lateral cortex; LDT, lateral dorsal tegmental nucleus; LoC, locus coeruleus; MC, medial cortex; PAG, periaqueductal grey; pDC, posterior dorsal cortex; POA, preoptic area; Ra, raphe nuclei; SC, subcoeruleus; SN, substantia nigra (SNi for mammals); SUM, supramammillary nucleus; TMN, tuberomammillary nucleus; VTA, ventral tegmental area. The prethalamus is marked with an asterisk. Scale bar, 1mm. j, Summary of claustrum (amDVR) connectivity with areas in i, as determined by viral tracing. Arrows with solid lines indicate connections; ‘x’ indicates an absence of connection (absence of anterograde and retrograde labelling); and arrows with dotted lines indicate tentative connections (due to inconsistent labelling). Claustral projections to the pDVR or DLA were not conclusively tested, as we were not able to inject rAAV2-retro specifically into those small areas. Abbreviations for mammalian homologues are shown in parentheses: BLA, basolateral amygdala; CA, cornu ammonis; DG, dentate gyrus; nCx, neocortex; palA, pallial amygdala; sub, subiculum. The prethalamus is marked with an asterisk, as in i.
To link our transcriptomic and physiological observations, we analyzed ion-channel and neurotransmitter-receptor gene expression in pallial glutamatergic clusters (143 genes detected in ≥20% of cells of at least one cluster, Methods). These genes were sufficient to distinguish amDVR from other glutamatergic clusters (Ext. Data Figs. 3,5) and contained clusters of correlated genes (modules). One module with enriched expression in amDVR (Fig. 3h) included receptors for noradrenaline (NA), acetylcholine (ACh), dopamine (DA) and serotonin (5HT). In mammals, these neuromodulators influence sleep rhythms and are released by brain nuclei from the hypothalamus to the medulla4,5,16-18. Glutamatergic neurons in amDVR were among the few co-expressing receptors for all four modulators (Ext. Data Fig. 5). Hence, the amDVR expresses receptor types that are consistent with a sensitivity to input from circuits that control brain state.
¶ The amDVR is extensively connected
We next mapped the connectivity of amDVR with putative wake/sleep-control areas—as suggested by the above data—and asked whether amDVR connects widely with the rest of the pallium, as claustrum does in mammals1,12,19-21. We identified, where possible, the Pogona homologs of mammalian nuclei implicated in sleep4-6. Relying on anatomical studies in related species (Methods) we used IHC and fluorescent ISH (FISH) to identify and map these nuclei in the Pogona diencephalon, midbrain and brainstem (Fig. 3i, Ext. Data Fig. 6), together with telencephalic areas mapped by scRNA-seq (blue)11.
We mapped amDVR connectivity by local tracer injections22 using rAAV2-retro23 carrying a fluorescent protein under the CAG or hSyn promoter for (mostly) retrograde labeling (Methods). rAAV2-retro was sometimes co-injected with (mostly) anterograde AAV2/9-CB7- mcherry-WPRE for injection-site identification. Because they do not cross synapses23-25 these tracers revealed direct targets (AAV2/9-CB7) and sources (rAAV2-retro) of the injection site. The results are summarized in Fig. 3j. On the left are all telencephalic structures whose input and output connectivity with amDVR (“claustrum”) could be tested. On the right are deeper structures in which local injection could not be done, for anatomical reasons. For these structures, connectivity to claustrum was established only by retrograde labeling from amDVR. Whether claustrum projects to those areas awaits direct demonstration.
The cortical sources of input to amDVR were anterior and posterior dorsal cortices (Fig. 3j, Ext. Data Fig 6c). Retrograde and anterograde tracers revealed no direct projections from hippocampus (x, Fig. 3j; DMC = CA fields; MC = Dentate Gyrus) to amDVR, even though amDVR projects to both. In subcortical pallium, aDVR and pDVR showed strong projections to amDVR. amDVR also received input from dorsal thalamic nuclei (DMT, DLT, DLPT), from prethalamus, hypothalamus, VTA, substantia nigra and the periaqueductal grey in the midbrain, and from locus coeruleus, subcoeruleus and the raphe nucleus in the brainstem (Ext. Data Fig. 6).
The amDVR projected to hippocampus (MC and DMC), posterior DC (potential subiculum homolog) and to aDC, the neocortex homolog11. In subcortical pallium, projections to anterior DVR (aDVR) were dense and extensive, consistent with sharp-wave propagation (Figs 1,2). Projections between amDVR and some of its targets appeared ordered: the more lateral amDVR projected to rostral aDVR; central amDVR projected to caudal aDVR. Conversely, input to amDVR from cortex (aDC and pDC) was strongest laterally, weakest medially (absent from DMC and MC—hippocampus).
Hence, amDVR is connected with the pallial forebrain and receives input from areas implicated in wake/sleep control, consistent with the widespread expression of many receptor genes specific to these areas. Based on these transcriptomic and anatomical data, we conclude that amDVR is the reptilian homolog of the mammalian claustrum.
¶ The claustrum homolog in turtles
Having applied similar transcriptomic approaches in Pogona and in the turtle Trachemys scripta11, two species on distinct branches of the reptilian tree, we looked for a claustrum in Trachemys. Comparison of transcriptomic data (Methods) yielded four potential turtle clusters (Ext. Data Fig. 7). Cells in these clusters lay in a region known as the pallial thickening (PT)11,26,27. Turtle PT and lizard amDVR are both in the anterior pallium, consistent with their similar developmental origin in anterio-lateral pallium10; but turtle PT is lateral to aDVR and close to olfactory cortex, rather than fused to the rest of DVR, as is claustrum in Pogona. Architectonics also differed: Pogona claustrum is nuclear and composed of isotropically distributed multipolar neurons; turtle PT forms a curved sheet extending anterior-dorsal cortex, traversed from below by LGN axons en route to visual cortex27. Indeed, principal neurons in turtle PT (rAAV2-retro injection in DMC) are pyramid-like, with apical and basal dendrites (Ext. Data Fig. 7d). Despite these differences, slices of turtle PT produced SWRs, leading those in DVR, like in Pogona. Thus, PT appears to be the turtle claustrum and a claustrum homolog likely existed already in the common ancestor of amniotes.
¶ Manipulating claustrum activity
We developed a reduced ex vivo Pogona forebrain preparation, enabling direct access to the non-cortical pallium after cortex removal (Methods). This preparation generated spontaneous SWRs in claustrum and DVR, similar to those recorded in vivo during sleep and in DVR/claustrum slices (Ext. Data Fig. 8). SWRs occurred continuously but more frequently (21.6±5.4 min-1, 4 brains) than in slices (12.4±1.8 min-1, n=13). Claustrum led DVR (Ext. Data Fig. 8f) with delays similar to those observed during sleep or in slices of claustrum+DVR (11- 141ms, peak mean corr.=.57; 4 brains). To test the causal role of claustrum in SWR generation, we injected TTX selectively in claustrum ex vivo (n=4, 3 animals), causing a prolonged silencing of claustrum and the concomitant cessation of SWRs in ipsilateral DVR (Ext. Data Fig. 8b-d).
We next lesioned one or both claustra in vivo using ibotenic acid (Methods; 3 animals). Bilateral recordings from DVR in sleeping lesioned animals revealed that the rhythmic modulation of activity (REM) was unaffected, but that SWRs, characteristic of slow-wave sleep, were eliminated on the claustrum-lesioned side(s) (Fig 4a-d, Ext. Data Fig. 9). Hence the claustrum is required for DVR SWR production during slow-wave sleep; its action is unilateral; and it is not involved in the alternating SW/REM sleep rhythm.
Because claustrum receives direct input from areas implicated in sleep-wake production in mammals and expresses receptors for their transmitters (Fig. 3), we tested the sensitivity of SWR production to those transmitters4-6,16. DA significantly increased SWR production rate; ACh and 5HT decreased it (Fig 4e). We selected 5HT for further experiments. Consistent with tracing data indicating serotonergic input from the Raphe, claustrum contained 5HT-positive fibers (Ext. Data Fig. 10a). 5HT at concentrations ≥1µM suppressed SWRs (n=9 claustrum+DVR slices, 9 animals, Ext. Data Fig. 10b). This effect was best mimicked by the HTR1D agonist L703,664 (Fig. 4f), consistent with scRNA-seq results (Ext. Data Fig. 5). We then superfused slices with caged-5HT (Methods): SWRs were suppressed within seconds of illumination onset and resumed when illumination ceased (Fig. 4g,h).
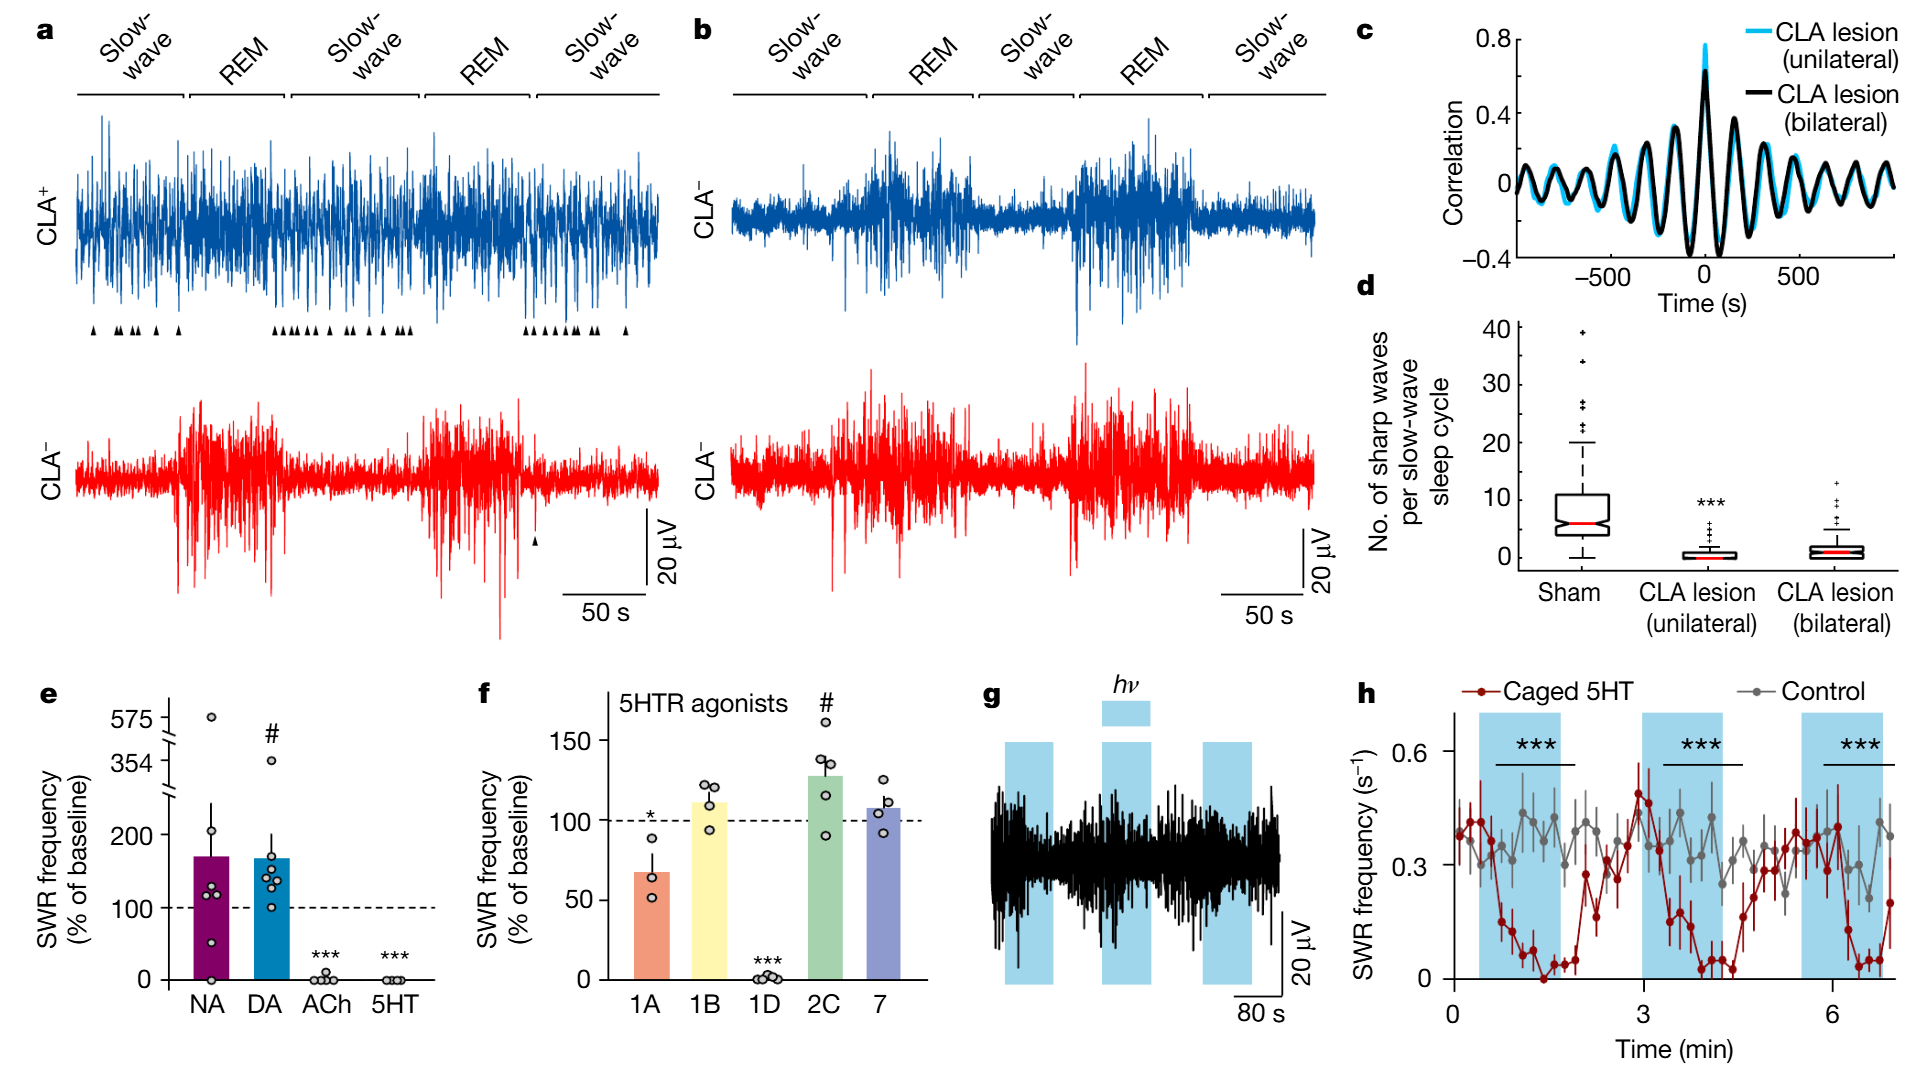
Fig. 4 | SWR production in the DVR depends on claustrum integrity and modulation. a–d, Ibotenic-acid-induced lesions of the claustrum and SWRs in sleeping lizards (see also Extended Data Fig.9). a, Short sleep segment showing LFP (<150 Hz) from left and right DVRs after unilateral claustrum lesion. Sham-lesioned hemisphere (CLA+) is shown in blue; lesioned hemisphere (CLA−) is shown in red. The arrowheads indicate sharp waves in the DVR. Sleep rhythm is intact but sharp waves are nearly absent in slow-wave sleep on the lesioned side. b, Same as a, in a lizard with bilateral lesions of the claustrum. Note the absence of sharp waves. c, Cross-correlation of β-band (REM sleep) power across hemispheres in lesioned animals. d, Number of sharp waves per slow-wave sleep cycle in sham and claustrum-lesioned hemispheres. ***, significantly different from sham; P<1.73×10−60, W=64,252 (Wilcoxon signed-rank test; data from 2 animals, 4 nights, 375 cycles). For details of box plots, see Methods. e–h, Experiments in slices of DVR + claustrum or isolated claustrum. e, Effects of superfused noradrenaline (NA; 25μM; n=7;), dopamine (DA) agonist SKF38393 (10μM; n=7); acetylcholine (ACh) agonist carbachol (50μM; n=5) and serotonin (5HT; 10μM; n=4) on the frequency of spontaneous SWRs. f, Action of serotonin receptor (5HTR) agonists on the rate of spontaneous SWRs in isolated slices of the claustrum. n=3 experiments (5HTR-1A); n=4 (5HTR-1B); n=5 (5HTR-1D); n=5 (5HTR-2C); n=4 (5HTR-7). ***, * and #, significantly different from baseline; ***P=8.0×10⁻³, T=15 (two-sided Wilcoxon rank-sum test); *P=0.04, t4=−2.9; #P=0.049, t8=−2.3 (paired t-test). Data are mean±s.e.m. (e, f). g, Light-triggered uncaging of serotonin suppresses spontaneous SWRs in CLA+DVR slices. Blue shading, light on (hν). h, Summary of eight experiments performed as in g, with bins of 10s. Data are mean±s.e.m. For the control experiments, light pulses were applied to ACSF-superfused slices. ***, experimental bins significantly different from control; P=1.5×10⁻⁴, T=36 (two-sided Mann–Whitney rank-sum test).
The mammalian claustrum is hypothesized to play a role in higher cognition1,28,29 because of its hub-like connectivity12,30-32. Direct experimental tests, however, are difficult due to claustrum anatomy12,33. Using single-cell RNAseq and tract-tracing techniques, we identified a claustrum in two distant reptiles, suggesting an origin predating the common ancestor of amniotes. The claustrum probably derives from the lateral pallium and may correspond to parts of the mesopallium in birds34,35. Thus, if the claustrum plays a role in higher cognition in mammals, this role may be derived from other functions in a common amniote ancestor. Claustrum assumes different architectonics, reflected in neuronal morphology, in two distant reptiles. (Differences exist also between marsupial and eutherian mammals36.) Because claustrum produces SWRs in both reptiles, architectonics likely play little role in SWR generation.
Claustrum participates in the generation and relaying of SWRs, characteristic of slow-wave sleep in Pogona. Given the claustrum’s widespread connectivity and its input from sleep/wake controlling areas, it may be implicated in coordinating forebrain states during sleep. Early experiments in cats37 describe sleep-like behavior after (though not during) low-frequency claustrum stimulation. These results remain uncertain because selective stimulation of the mammalian claustrum is difficult. Recent results in rodents using markers of synaptic activity38 suggest claustrum activity during REM sleep. Other39,40 suggest that claustrum acts to shut down cortex via dominant projections onto cortical interneurons. This action would cause a general cortical downstate, as possibly seen during certain phases of SWS40. These results collectively suggest tentative links between claustrum and sleep in mammals.
During sleep in Pogona, SWRs originate in claustrum and propagate to the rest of the noncortical pallium, the mammalian amygdaloid complex homolog11. By virtue of ascending input from areas controlling wake/sleep, the claustrum is ideally positioned to act as a relay for wake/sleep-related states in the forebrain. During sleep the claustrum alternates between SWR production and REM, presumably driven by alternating ascending inputs, themselves independent of claustrum integrity. Claustrum projections suggest a distributed action on cortex, hippocampus, amygdala and other forebrain areas. SWRs in sleeping Pogona in vivo are each correlated with a short phasic inhibition of cortex [consistent with stimulation experiments (Ext. Data Fig. 8) and with results in rodents 39,40], followed by cortical excitation3 (consistent with CA1-mPFC coordination in rodents41). The mechanisms underlying this coordination must now be characterized, as does the nature of sleep-related inputs to claustrum.
¶ Acknowledgments
We thank K. Steele and A. Schwartzlose for help with 5HT immunocytochemistry and neural tract tracing, Drs. E. Northrup and G. Wexel for veterinary care, T. Klappich for reptile care, S. Junek, F. Vollrath and C. Polisseni for help with imaging and microscopy, G. Tushev for help with genome reannotation, E. Desfilis (University of Lleida, Spain) for help with lizard neuroanatomy and the Laurent lab for help and comments. Funded by the Max Planck Society, the European Research Council under the European Union’s Seventh Framework Programme (FP7/2007-2013) (ERC grant agreement n° 322705), the European Research Council under the European Union’s Horizon 2020 research and innovation programme (ERC grant agreement no 834446) and the DFG (CRC1080) (G.L.), postdoctoral fellowships from the JSPS (SPD and for Research Abroad) and from the Kanae Foundation for the promotion of medical science (H.N.), and an EMBO Long-Term Fellowship (ALTF 421- 2017) (L.A.F.).
¶ Authors contributions
H.N. and L.A.F. contributed equally and have equal right to list themselves first in bibliographic documents; project conception: H.N, L.A.F and G.L.; animal surgery: M.K., H.N. and L.A.F.; electrophysiology: H.N., L.A.F. and S.R.; pharmacology: H.N., R.K., and L.A.F.; single-cell RNAseq: M.T.G.F., D.H., A.M. and M.A.T.; bioinformatics: M.A.T. and D.H.; tracing, anatomy and histology: L.A.F., H-H.L., R.K., M.T.G.F., A.A. and M.K.; experimental design, data interpretation and analysis: H.N., L.A.F., H-H.L., M.A.T., M.T.G.F., D.H., S.R., and G.L.; project management and supervision: G.L.; manuscript writing: G.L., with input from all.
¶ Competing interests
The authors declare no competing interest.
¶ Materials & Correspondence
Sequences, code and links can be found at https://brain.mpg.de/research/laurentdepartment/software-techniques.html. Data are available upon request. Correspondence: gilles.laurent@brain.mpg.de.
¶ References
- Saper, C. B. & Fuller, P. M. Wake-sleep circuitry: an overview. Curr Opin Neurobiol 44, 186-192, doi:10.1016/j.conb.2017.03.021 (2017).
- Weber, F. & Dan, Y. Circuit-based interrogation of sleep control. Nature 538, 51-59, doi:10.1038/nature19773 (2016).
- Lyamin, O. I., Manger, P. R., Ridgway, S. H., Mukhametov, L. M. & Siegel, J. M. Cetacean sleep: an unusual form of mammalian sleep. Neurosci Biobehav Rev 32, 1451-1484, doi:10.1016/j.neubiorev.2008.05.023 (2008).
- Shein-Idelson, M., Ondracek, J. M., Liaw, H. P., Reiter, S. & Laurent, G. Slow waves, sharp waves, ripples, and REM in sleeping dragons. Science 352, 590-595, doi:10.1126/science.aaf3621 (2016).
- Buzsaki, G. Hippocampal sharp wave-ripple: A cognitive biomarker for episodic memory and planning. Hippocampus 25, 1073-1188, doi:10.1002/hipo.22488 (2015).
- Naumann, R. K. & Laurent, G. in Evolution of Nervous Systems Vol. 1 (ed J.H. Kaas) Ch. 1.25, 491-518 (Elsevier, 2017).
- Moreno, N. & Gonzalez, A. Evolution of the amygdaloid complex in vertebrates, with special reference to the anamnio-amniotic transition. J Anat 211, 151-163, doi:10.1111/j.1469-7580.2007.00780.x (2007).
- Puelles, L. et al. in Evolution of Nervous Systems Vol. 1 (ed Jon H Kaas) 519-555 (Elsevier, 2017).
- Tosches, M. A. et al. Evolution of pallium, hippocampus, and cortical cell types revealed by single-cell transcriptomics in reptiles. Science 360, 881-888, doi:10.1126/science.aar4237 (2018).
- Wang, Q. X. et al. Organization of the Connections Between Claustrum and Cortex in the Mouse. Journal of Comparative Neurology 525, 1317-1346, doi:10.1002/cne.24047 (2017).
- Saunders, A. et al. Molecular Diversity and Specializations among the Cells of the Adult Mouse Brain. Cell 174, 1015-1030.e1016, doi:10.1016/j.cell.2018.07.028 (2018).
- Stuart, T. et al. Comprehensive Integration of Single-Cell Data. Cell 177, 1888-1902.e1821, doi:10.1016/j.cell.2019.05.031 (2019).
- Striedter, G. F. The Telencephalon of Tetrapods in Evolution. Brain, behavior and evolution 49, 179-194 (1997).
- Scammell, T. E., Arrigoni, E. & Lipton, J. O. Neural Circuitry of Wakefulness and Sleep. Neuron 93, 747-765, doi:10.1016/j.neuron.2017.01.014 (2017).
- Monti, J. M. Serotonin control of sleep-wake behavior. Sleep medicine reviews 15, 269-281, doi:10.1016/j.smrv.2010.11.003 (2011).
- Clement, O., Sapin, E., Berod, A., Fort, P. & Luppi, P. H. Evidence that neurons of the sublaterodorsal tegmental nucleus triggering paradoxical (REM) sleep are glutamatergic. Sleep 34, 419-423, doi:10.1093/sleep/34.4.419 (2011).
- Crick, F. C. & Koch, C. What is the function of the claustrum? Philos Trans R Soc Lond B Biol Sci 360, 1271-1279, doi:10.1098/rstb.2005.1661 (2005).
- da Costa, N. M., Fursinger, D. & Martin, K. A. The synaptic organization of the claustral projection to the cat’s visual cortex. J Neurosci 30, 13166-13170, doi:10.1523/jneurosci.3122-10.2010 (2010).
- Druga, R. in The claustrum: structural, functional, and clinical neuroscience (eds J.R. Smythies, L.R. Edelstein, & V.S. Ramachandran) Ch. 2, 29-84 (Academic Press, 2014).
- Olson, C. R. & Graybiel, A. M. Sensory maps in the claustrum of the cat. Nature 288, 479-481 (1980).
- Hobson, J. A., McCarley, R. W. & Wyzinski, P. W. Sleep cycle oscillation: reciprocal discharge by two brainstem neuronal groups. Science 189, 55-58 (1975).
- Pammer, L. Explorations of turtle cortex function through molecular, optogenetic and electrophysiological techniques PhD thesis, Goethe University Frankfurt, (2017).
- Tervo, D. G. et al. A Designer AAV Variant Permits Efficient Retrograde Access to Projection Neurons. Neuron 92, 372-382, doi:10.1016/j.neuron.2016.09.021 (2016).
- Oh, S. W. et al. A mesoscale connectome of the mouse brain. Nature 508, 207-214, doi:10.1038/nature13186 (2014).
- Harris, J. A., Oh, S. W. & Zeng, H. Adeno-associated viral vectors for anterograde axonal tracing with fluorescent proteins in nontransgenic and cre driver mice. Current protocols in neuroscience Chapter 1, Unit 1.20.21-18, doi:10.1002/0471142301.ns0120s59 (2012).
- Desan, P. H. in The Forebrain of Reptiles (eds WK Schwerdtfeger & WJ Smeets) Ch. 1, 1-11 (Karger, 1987).
- Heller, S. B. & Ulinski, P. S. Morphology of geniculocortical axons in turtles of the genera Pseudemys and Chrysemys. Anatomy and embryology 175, 505-515 (1987).
- Atlan, G. et al. The Claustrum Supports Resilience to Distraction. Curr Biol 28, 2752-2762.e2757, doi:10.1016/j.cub.2018.06.068 (2018).
- Smythies, J., Edelstein, L. & Ramachandran, V. Hypotheses relating to the function of the claustrum. Front Integr Neurosci 6, 53, doi:10.3389/fnint.2012.00053 (2012).
- Dillingham, C. M., Janowski, M. M., Chandra, R., Frost, B. E. & O’Mara, S. M. The claustrum: Considerations regarding its anatomy, functions and a programme for research. Brain and Neuroscience Advances 1, 1-9 (2017).
- Edelstein, L. R. & Denaro, F. J. The claustrum: a historical review of its anatomy, physiology, cytochemistry and functional significance. Cellular and molecular biology (Noisy-le-Grand, France) 50, 675-702 (2004).
- Goll, Y., Atlan, G. & Citri, A. Attention: the claustrum. Trends Neurosci 38, 486-495, doi:10.1016/j.tins.2015.05.006 (2015).
- Mathur, B. N., Caprioli, R. M. & Deutch, A. Y. Proteomic analysis illuminates a novel structural definition of the claustrum and insula. Cereb Cortex 19, 2372-2379, doi:10.1093/cercor/bhn253 (2009).
- Puelles, L. in The Claustrum (eds J. Smythies, L. Edelstein, & V. Ramachandran) Ch. 4, 119-176 (Elsevier Inc., 2014).
- Briscoe, S. D., Albertin, C. B., Rowell, J. J. & Ragsdale, C. W. Neocortical Association Cell Types in the Forebrain of Birds and Alligators. Curr Biol 28, 686-696.e686, doi:10.1016/j.cub.2018.01.036 (2018).
- Buchanan, K. J. & Johnson, J. I. Diversity of spatial relationships of the claustrum and insula in branches of the mammalian radiation. Ann N Y Acad Sci 1225 Suppl 1, E30-63, doi:10.1111/j.1749-6632.2011.06022.x (2011).
- Gabor, A. J. & Peele, T. L. Alterations of behavior following stimulation of the claustrum of the cat. Electroencephalogr Clin Neurophysiol 17, 513-519 (1964).
- Renouard, L. et al. The supramammillary nucleus and the claustrum activate the cortex during REM sleep. Science advances 1, e1400177, doi:10.1126/sciadv.1400177 (2015).
- Jackson, J., Karnani, M. M., Zemelman, B. V., Burdakov, D. & Lee, A. K. Inhibitory Control of Prefrontal Cortex by the Claustrum. Neuron 99, 1029-1039.e1024, doi:10.1016/j.neuron.2018.07.031 (2018).
- Narikiyo, K. et al. The Claustrum Coordinates Cortical Slow-Wave Activity. bioRxiv, 286773, doi:10.1101/286773 (2018).
- Siapas, A. G. & Wilson, M. A. Coordinated interactions between hippocampal ripples and cortical spindles during slow-wave sleep. Neuron 21, 1123-1128 (1998).
- Hoops, D. et al. A 3D MRI-based atlas of a lizard brain. J Comp Neurol 526, 2511-2547, doi:10.1002/cne.24480 (2018).
- Moreno, N., Domínguez, L., Morona, R. & González, A. Subdivisions of the turtle Pseudemys scripta hypothalamus based on the expression of regulatory genes and neuronal markers. Journal of Comparative Neurology 520, Spc1-Spc1, doi:10.1002/cne.23022 (2012).
- Medina, L., Smeets, W. J., Hoogland, P. V. & Puelles, L. Distribution of choline acetyltransferase immunoreactivity in the brain of the lizard Gallotia galloti. J Comp Neurol 331, 261-285, doi:10.1002/cne.903310209 (1993).
- McInnes, L., Healy, J. & Melville, J. UMAP: Uniform Manifold Approximation and Projection for Dimension Reduction. arxiv.org/abs/1802.03426 (2018).
- Bruce, L. L. & Neary, T. J. Afferent projections to the ventromedial hypothalamic nucleus in a lizard, Gekko gecko. Brain Behav Evol 46, 14-29, doi:10.1159/000113255 (1995).
- Bruce, L. L. & Neary, T. J. Afferent projections to the lateral and dorsomedial hypothalamus in a lizard, Gekko gecko. Brain Behav Evol 46, 30-42, doi:10.1159/000113256 (1995).
- Ebner, F. F. in Evolution of Brain and Behavior in Vertebrates (eds R.B. Masterton, M.E. Bitterman, C.B.G. Campbell, & N. Hotton) 115-167 (Taylor & Francis Group, 1976).
- Font, C., Lanuza, E., Martinez-Marcos, A., Hoogland, P. V. & Martinez-Garcia, F. Septal complex of the telencephalon of lizards: III. Efferent connections and general discussion. J Comp Neurol 401, 525-548 (1998).
- Hoogland, P. V. & Vermeulen-Vanderzee, E. Efferent connections of the dorsal cortex of the lizard Gekko gecko studied with Phaseolus vulgaris-leucoagglutinin. J Comp Neurol 285, 289-303, doi:10.1002/cne.902850302 (1989).
- Smeets, W. J. & Steinbusch, H. W. Distribution of noradrenaline immunoreactivity in the forebrain and midbrain of the lizard Gekko gecko. J Comp Neurol 285, 453-466, doi:10.1002/cne.902850404 (1989).
- Smeets, W. J., Hoogland, P. V. & Voorn, P. The distribution of dopamine immunoreactivity in the forebrain and midbrain of the lizard Gekko gecko: an immunohistochemical study with antibodies against dopamine. J Comp Neurol 253, 46- 60, doi:10.1002/cne.902530105 (1986).
- ten Donkelaar, H. J., Bangma, G. C., Barbas-Henry, H. A., de Boer-van Huizen, R. & Wolters, J. G. The brain stem in a lizard, Varanus exanthematicus. Advances in anatomy, embryology, and cell biology 107, 1-168 (1987).
- ten Donkelaar, H. J. in The Central Nervous System of Vertebrates Vol. 1, 2, 3 1315- 1524 (Springer, Berlin, Heidelberg, 1998).
- Wolters, J. G., ten Donkelaar, H. J., Steinbusch, H. W. & Verhofstad, A. A. Distribution of serotonin in the brain stem and spinal cord of the lizard Varanus exanthematicus: an immunohistochemical study. Neuroscience 14, 169-193 (1985).
- Wolters, J. G., ten Donkelaar, H. J. & Verhofstad, A. A. Distribution of catecholamines in the brain stem and spinal cord of the lizard Varanus exanthematicus: an immunohistochemical study based on the use of antibodies to tyrosine hydroxylase. Neuroscience 13, 469-493 (1984).
- Pedersen, N.P., Ferrari, L., Venner, A. et al. Supramammillary glutamate neurons are a key node of the arousal system. Nat Commun 8, 1405 (2017) doi:10.1038/s41467- 017-01004-6
¶ Methods
¶ ANIMALS
Lizards: Animals (Pogona vitticeps known as “Australian dragon”) of either sex, weighing 100-400 grams, were obtained from our institute colony, selected for sex, size, weight, health status, and wild-type coloring.
Turtles: Wild-type turtles (Trachemys scripta elegans or Chrysemys picta) of either sex, weighing 200 to 400 g, were obtained from an open-air breeding colony (NASCO Biology, Wisconsin, USA). The animals were housed in our state-of-the-art animal facility.
All experimental procedures were performed in accordance with German animal welfare guidelines: permit #V54- 19c 20/15- F126/1005 delivered by the Regierungspraesidium Darmstadt, Darmstadt, Germany (Dr. E. Simon).
¶ RECORDINGS
¶ Lizard surgery for chronic recordings
Twenty-four hours before surgery, the lizard was administered analgesics (Butorphanol: 0.5 mg/kg s.c., Meloxicam: 0.2 mg/kg s.c.) and antibiotics (marbofloxacin, Marbocyl, 2 mg/kg). On the day of surgery, anesthesia was initiated with isoflurane, and maintained with isoflurane (1-4 Vol. %) after intubation. The lizard was placed in a stereotactic apparatus after ensuring deep anesthesia (absence of corneal reflex). Body temperature during surgery was maintained at 32°C using a heating pad and esophageal temperature probe. Heart rate was monitored using a Doppler flow detector. The skin covering the skull was disinfected using 10% Povidoneiodine solution before removal with a scalpel. A small (~3x2 mm) craniotomy was then drilled postero-lateral to the parietal eye along the midline. The dura and arachnoid layers covering the forebrain were removed with fine forceps, and the pia was removed gently over the area of electrode insertion (dorsal/dorsomedial cortex). The exposed skull was covered with a layer of UV-hardening glue, and the bare ends of two insulated stainless steel wires were secured in place subdurally with UV-hardening glue to serve as reference and ground.
Insertion of silicon probes: probes were mounted on a Nanodrive (Cambridge Neurotech) and secured to a stereotactic adaptor. On the day after the surgery, probes were slowly lowered into the tissue (~ 0.9-1.2mm). The brain was covered with Duragel followed by vaseline. After connecting grounds, the skull, craniotomy, and probes were secured with dental cement. Following surgery, lizards were released from the stereotax and left on a heating pad set to 32°C until full recovery from anesthesia.
¶ In vivo electrophysiology
One week before surgery, animals were habituated to a sleep arena for a minimum of 2 nights. One to two hours before lights off, the lizard was placed in the sleep arena, itself placed in a 3x3x3m EM-shielded room. The animal was let to sleep and behave naturally overnight, and returned to its home terrarium 3-4 hours after lights on. The animal then received food and water. Recordings were made from the cortex, anterior DVR (including claustrum) and/or posterior DVR of chronically implanted adult lizards. Electrodes were 32-channel silicon probes (50 µm pitch, 177 µm2 surface area for each site; in two rows of 16 contacts).
Recordings were performed with a Cheetah Digital Lynx SX system and HS-36 headstages of unity gain and high input impedance (∼1 TOhm). The headstage was connected with a headstage adapter to a connector on the head, and a lightweight shielded tether cable connected the headstage to the acquisition system. Recordings were grounded and referenced against one of the reference wires. Signals were sampled at 32 kHz, with wide-band 0.1–9,000 Hz. Electrophysiological traces were typically filtered <150Hz with a 2-pole Butterworth filter for display.
¶ Ibotenic-acid lesion experiments
In preparation for claustrum-lesion experiments we carefully removed, using fine forceps in anesthetized animals, the pia overlaying dorsal cortex and inserted a beveled quartz micropipette at an angle of 90º to the surface, to a depth of 1050–1150 µm from the surface, at appropriate a-p and m-l coordinates to reach the center of the claustrum. 400–600 nl of ibotenic acid (5 µg/µl in phosphate-buffered saline, PBS, pH 7.2) were injected at a rate of 50–100 nl/min (UMP3, World Precision Instruments, USA). The injection pipette was retracted 3 min after the end of injection. Two silicon recording probes were subsequently positioned bilaterally, as described above, for DVR recordings. For sham claustrum lesions, we injected PBS alone (same methods and volumes) on the sham-lesion side. Recordings were carried out each night from one to 6 days after surgery. Effects of the lesions could already be observed 24 hrs after surgery. A week after each experiment, the animal was sacrificed, its brain sectioned and stained (Nissl) for histological confirmation.
¶ SWR delay calculation
Sharp-waves were detected as described previously (template-based detection3). After independently detecting SWRs on probes in anterior and posterior DVR throughout a dataset, the delay between SWRs across probes was calculated by pairing SWRs on one probe with the SWR closest in time on the second probe. Pairs occurring >500 ms apart were ignored.
¶ SWRs at the SWS-REMS transition point
REMS and SWS periods and the timing of their transition, were calculated as described previously3. Average SWR rate and amplitudes were calculated by averaging these values triggered on all SWS-REMS transition points within 100ms bins, and smoothing the resulting histogram with a Gaussian filter (std. 25 ms).
In ibotenic-acid lesion experiments, sleep cycles were determined using median filtered betaband power (10-40 Hz, as above), for a 6-hour period beginning 3 hours after recording start time. The time course of beta was filtered above 0.001 Hz with a 2-pole Butterworth filter, and additionally smoothed with a Gaussian filter (std, 20s). Periods of SWS were conservatively defined as ones in which this signal was less than 1 s.d. below the mean. To avoid false SW detections observed in lesioned animals (which demonstrate reduced low-frequency power), SWs were detected through thresholding the voltage trace (1.5-2.5 s.d. below the mean) after low-pass filtering at 4 Hz with a 2-pole Butterworth filter. The threshold was adapted to each lesion experiment and was the same for both hemispheres within each experiment.
¶ Sharp-wave shape statistics
For comparison with ex vivo and slice sharp-waves, sharp-waves detected in vivo were lowpass filtered at 20Hz using a 2-pole Butterworth filter.
¶ Ex vivo and slice preparation
Adult lizards or turtles were deeply anesthetized with isoflurane, ketamine (60 mg/kg, and midazolam (2mg/kg). After loss of the corneal reflex, the animals were decapitated, and the heads were rapidly transferred into cooled artificial cerebrospinal fluid (ACSF) solution (Lizard: 126 mM NaCl, 3 mM KCl, 1.8 mM CaCl2, 4 mM MgCl2, 24 mM NaHCO3, 0.72 mM NaH2PO4, 20 mM glucose, pH 7.4, Turtle: 96.5 mM NaCl, 2.6 mM, KCl, 4 mM CaCl2, 2 mM MgCl2, 31.5 mM NaHCO3, 20 mM glucose, pH 7.4) bubbled with carbogen gas (95% O2, 5% CO2).
Ex vivo intact subcortical preparation: After isolation of the lizard brain, subcortical slabs were prepared with iridectomy scissors.
Slice preparation: Coronal, horizontal or sagittal subcortical area slices (700 µm thick) were prepared using a vibratome (VT 1200S, Leica) in ice-cold, oxygenated ACSF. The slices were allowed to recover for at least 60 min and then submerged in a chamber filled with oxygenated ACSF (Lizards: 126 mM NaCl, 3 mM KCl, 1.8 mM CaCl2, 1 mM MgCl2, 24 mM NaHCO3, 0.72 mM NaH2PO4, 20 mM glucose, pH 7.4, Turtle: 96.5 mM NaCl, 2.6 mM, KCl, 4 mM CaCl2, 2 mM MgCl2, 31.5 mM NaHCO3, 20 mM glucose, pH 7.4) at 20–22°C.
Ex vivo/Slice physiology and SWR detection: During recordings, oxygenated ACSF (Lizard: 126 mM NaCl, 3 mM KCl, 1.8 mM CaCl2, 1.2 mM MgCl2, 24 mM NaHCO3, 0.72 mM NaH2PO4, 20 mM glucose, pH 7.4, Turtle: 96.5 mM NaCl, 2.6 mM, KCl, 4 mM CaCl2, 2 mM MgCl2, 31.5 mM NaHCO3, 20 mM glucose, pH 7.4) was constantly superfused at 18-20°C (ex vivo) and 18-21°C (slices) at 4 ml/min. Local field potentials (LFPs) were recorded using micro-electrode arrays (MEAs), silicon probes, or glass pipettes filled with ACSF. The electrodes were carefully placed in the targeted areas with micromanipulators. Signals were low-pass filtered at 2kHz and digitized at 20kHz. For analysis of SWs, the traces were further low-pass filtered at 20 Hz using a 2-pole Butterworth filter. SWRs were detected at a threshold of 3× s.d. of the total signal. The detected events were visually scrutinized and manually rejected if they were erroneously detected. Events lasting less than 30ms were also discarded as they were typically artifacts. For claustrum electrical stimulation experiments, stimulation pulses lasted 50µs and were delivered with bipolar electrodes. Multi-unit extracellular recordings in cortex were carried out with glass micropipettes filled with ACSF. Mini-slices were cut with a sharp razor blade and were 0.61-3.12 mm2 in surface area.
¶ CMOS MEA experiments
The slices were placed over a high-density MEA (3Brain AG) of 4,096 electrodes (electrode size, 21×21μm; pitch, 81μm; 64×64 matrix; 5.12×5.12mm area). During recording, ACSF perfusion was interrupted to avoid movements of the slices and noise due to ACSF flux. Signals were sampled at 18kHz with high-pass filter at 1Hz.
Saturating or damaged channels were detected as channels whose voltage crossed ±500μV and were removed from later analysis. Channel data were low-pass filtered at 20Hz, z-scored, and troughs greater than 5(z) below the mean on the channel with the largest signal were taken as SWs. The signal ±400ms from these peak times, on all channels, was taken as a SWR episode. For calculation of SWR latency, SWRs were averaged on each channel and the time that the average signal crossed 1(z) below the mean was taken as the start of the SWR on that channel. Latency was calculated relative to the time of the earliest channel’s SWR. Channels that did not cross 1(z) were considered maximum latency. The resulting latency image was filtered with a 3×3 median filter to remove the impact of bad channels, and up-sampled by a factor of 10 for display.
¶ Whole-cell patch-clamp (WCPC) recordings of DVR and claustrum neurons
Long-shank patch pipettes (6-8 MΩ) were pulled from borosilicate glass with a Sutter P1000 electrode puller. Pipettes were filled with internal solution (140mM K-gluconate, 4mM NaCl, 14mM Phosphocreatine, 10mM HEPES, 4mM Mg-ATP, 0.3mM Na-GTP, 4mg/ml biocytin). Experiments were carried out on an upright Olympus BX61WI microscope with 5x and 40x water-immersion objectives and cells were patched under visual guidance. EPSCs and IPSCs were recorded in the voltage-clamp configuration with the same cell held at either −70 mV or +10 mV. Simultaneous patch-clamp and LFP recordings were carried out with an EPC10 Quadro amplifier (HEKA).
¶ Pharmacology
5HT hydrochloride (0.1-30 µM), carbamoylcholine chloride (50 µM), noradrenaline bitartrate (25 µM), SKF38393 hydrobromide (10 µM), ®-(+)-8-Hydroxy-DPAT hydrobromide (2 µM), L-703,664 succinate (1 µM), CP 809,101 hydrochloride (0.1 µM), LP44 (0.2 µM), and TTX (20 µM) were diluted to their final concentrations in ACSF (126 mM NaCl, 3 mM KCl, 1.8 mM CaCl2, 1.2 mM MgCl2, 24 mM NaHCO3, 0.72 mM NaH2PO4, 20 mM glucose, pH 7.4). For slice experiments, drugs were continuously bath-applied after a baseline recording period of 5-20 min. For ex vivo experiments in Ext. Data Fig. 8, TTX dissolved in ACSF was injected into the claustrum through a glass micropipette using a 10-ml syringe pressurizer (20-30 hPa for 15 min). For 5HT uncaging, RuBi-5HT (Abcam) (10 µM) was bath-applied, and whitelight (400-700nm, 0.11 W/cm2, TH4-200, Olympus) was turned on and off at chosen intervals (e.g., 80s).
We tested several metabotropic 5HT-R agonists. Of those, 1D agonist L-703,664 best mimicked the effects of 5HT, consistent with the high expression of 5HT1D-R in glutamatergic neurons in claustrum (Extended Data Fig. 5a). 5HTR7 agonist LP44 had no effect (Fig. 4f), also consistent with the low expression of the 5HTR7 in claustrum excitatory neurons. 5HTR2C agonist CP 809,101 increased the rate but not the amplitude of SWRs.
¶ SINGLE-CELL TRANSCRIPTOMICS
¶ Single-cell RNA sequencing libraries
Adult male lizards (150-400g) were deeply anesthetized with isoflurane, ketamine (50 mg/kg) and midazolam (0.5 mg/kg) and decapitated. The head was immersed in ice-cold, oxygenated ACSF (126 mM NaCl, 3 mM KCl, 2 mM CaCl2, 4 mM MgCl2, 24 mM NaHCO3, 0.72 mM NaH2PO4, 20 mM glucose, pH 7.4). The brains were perfused to remove blood from the vasculature. The data shown originate from four libraries constructed from data from one male lizard (160g, 20 months old).
Thereafter, the brain was removed and immersed in oxygenated, ice-cold ACSF. The brain was embedded in 4% low melting agarose, glued to the base of a vibratome (VT1200S, Leica), immersed in ice-cold oxygenated ACSF and 500μm-thick sections were prepared (speed: 0.08 mm/s). The sections were individually inspected under a dissection microscope (Stemi 2000- C, Zeiss) and anatomical regions of interest were dissected (telencephalon, amDVR). These slices were cut with fine scissors (Fine Science Tools) into small cubes of tissue (~500x500x500 μm).
These were transferred to dissociation buffer (20 U/ml papain, 200 U/ml DNAse I, 25 μg/ml liberase TM, 1 μM tetrodotoxin (TTX), 100 μM D-APV) and triturated with fire-polished, silanized glass pipettes of decreasing tip diameter (~10 passes per pipette). After every pipette change the supernatant (dissociated cell suspension) was removed and filtered through a 100 μm-mesh-diameter strainer.
The pooled dissociated cell suspension was diluted to 20 ml (with Hibernate A - CaCl2), transferred to a 50-ml reaction tube and filtered with a 40-μm mesh diameter strainer. Then 5 ml of 4% bovine serum albumin (BSA) in Hibernate A - CaCl2 was added to the bottom of the tube with a long-stemmed glass pipette. The solution was spun in a centrifuge at 4°C with 300g (lowest acceleration and brake) for 5 min. The supernatant was removed and the cell pellet resuspended in 20 ml of Hibernate A - CaCl2. This procedure was repeated for a second gradient clean-up. The pellet was then resuspended in an appropriate amount (50-200μl) of Hibernate A - CaCl2-MgCl2 and the cell concentration was measured with a Fuchs-Rosenthal cell counting chamber (Brand).
The cell suspension was then diluted to 466 cells/μl and used as input to half a chip (four samples) of the 10x Chromium system (Chemistry v3) with a targeted cell recovery of 7,000 cells/sample. The library construction was performed according to the manufacturer’s instructions.
The final four libraries were quantified using Qubit fluorometer (ThermoFisher) and sequenced five times on a DNA sequencer (NextSeq 500, Illumina) with an average depth of 442,806,563 reads/library.
¶ Analysis of transcriptomics data
Raw sequencing data were processed using Cellranger v3.0 (10X Genomics). Raw reads were demultiplexed and filtered with the cellranger mkfastq function with default settings. To generate digital gene expression matrices, demultiplexed reads were aligned to the Pogona genome with the cellranger count function, setting the force-cells parameter to 7000. For reads alignment, we re-annotated the Pogona genome (assembly 1.1.0, NCBI accession number GCF_900067755.1, April 10th 2017) using the same 3’-end MACE (Massive Analysis of cDNA Ends) data and the approach described in ref. 11.
Digital gene expression matrices were analyzed in R, using the Seurat v3.0 package14. Cells were filtered by number of genes (> 800 genes/cell) and percentage of mitochondrial genes (>5%), yielding a total of 20,257 cells, with a median number of 2,278 transcripts and 1,349 genes per cell. Data were normalized by the total number of transcripts detected in each cell, and regressed by the number of genes and of transcripts (by setting vars.to.regress = c(“nFeature_RNA”,“nCount_RNA”) in ScaleData function). Variable genes were identified after variance standardization from an estimate of the mean-variance relationship (FindVariableFeature, method=”vst”), and the top 1,000 highly variable genes were used for principal component analysis. The first 30 principal components were used for Louvain clustering (FindClusters, resolution=0.2) and for dimensionality reduction with UMAP45 (RunUMAP with default settings).
After this first round of analysis, neuronal clusters (characterized by high expression of panneuronal markers, such as the synaptic protein SNAP25) were reanalyzed using the same procedure as above and the following settings: >800 genes/cell, 2000 highly variable genes, 30 principal components, clustering resolution=2. This led to the identification of 33 neuronal clusters. Two clusters of doublets, recognized by the co-expression of glutamatergic and GABAergic markers, were filtered out at this stage, leaving 9,777 neurons in 29 clusters (Extended Data Fig. 3).
From this neuronal dataset, we identified 4,054 pallial glutamatergic neurons (with >1000 genes/cell) co-expressing the vesicular glutamate transporters SLC17A7 and SLC17A6. Further sub-clustering of these cells (analysis settings: 2,000 highly variable genes, 34 principal components, clustering resolution=3) led to the identification of 29 clusters (Fig. 3a and Extended Data Fig. 3). To assign an identity to each of these clusters, we analyzed the expression of marker genes with known tissue expression patterns (data and approach in ref. 11). This allowed us to define the pallial region to which each cluster belongs (for example, hippocampus for ZBTB20-expressing clusters). Further annotation of cluster identities (Extended Data Fig. 3) was based on the expression of selective markers or combination of marker genes, identified from the transcriptomics data.
¶ Analysis of ion channels and neurotransmitter receptor genes
We mined the Pogona genome for the following gene families: noradrenaline, acetylcholine, serotonin and dopamine receptors, calcium, chloride, sodium and potassium channels, GABA, glutamate, adenosine, cannabinoid, glycine and histamine receptors. This yielded 270 genes in total. Of these, 143 were kept for further analysis, because they were detected in at least 20% of the cells of at least one glutamatergic cluster (Extended Data Fig. 5a).
To calculate pairwise cluster correlations (Pearson correlations, Extended Data Fig. 5b), we used this set of 143 genes and average cluster expression data (calculated from normalized and log-transformed data with the AverageExpression function in the Seurat package). A distance matrix was calculated from the correlation matrix, and used for hierarchical clustering (R package hclust) with the Ward.D2 linkage method.
The gene expression matrix from above was transposed to calculate gene-gene correlations (Fig. 3g). The gene dendrogram was also calculated with hierarchical clustering and the Ward.D2 linkage method.
The heatmap in Fig. 3h was generated from the matrix of 29 glutamatergic clusters (columns) and average expression of the 143 genes (rows). The data matrix was scaled by columns, and the heatmap was plotted with the heatmap.2 function from the R package gplots. The dendrogram of glutamatergic clusters is based on Euclidean distance and Ward.D2 linkage.
¶ Mapping of single-cell transcriptomes across species
To map Pogona single-cell transcriptomes on mouse single-cell data, we used the dataset from ref. 13, available on the dropviz.org website. In this dataset, pallial glutamatergic neurons were sampled from three regions: “hippocampus”, “frontal cortex” and “posterior cortex”. These dissections encompass several cell types; for example, “frontal cortex” includes claustrum and “hippocampus” includes subiculum and entorhinal cortex. Raw data were processed through the Seurat pipeline (normalization, scaling, variable genes selection) and glutamatergic clusters and subclusters were selected, according to the cluster and subcluster identities provided by Saunders et al. (ref. 13) and dropviz.org. Subclusters were downsampled to a maximum number of 200 cells/subcluster, yielding a total of 17,455 cells.
Pogona-mouse comparative analysis were limited to one-to-one orthologs, according to the orthology annotations provided by Ensembl (Pogona assembly pv1.1 and mouse assembly GRCm38.p6, one-to-one orthologs downloaded on May 1st, 2019). Of 13,273 one-to-one orthologs, 10,693 were detected in both the mouse and Pogona datasets and used for the comparative analysis.
The Pogona and mouse data were analyzed jointly following the approach described in ref. 14. Briefly, after normalization and scaling, 1,500 highly variable genes were identified in each dataset. The union of these sets of variable genes was used for a joint canonical correlation analysis (CCA). The first 15 canonical components were then used to identify 2,626 transfer anchors, that is, pairs of cells with matching neighborhoods (“mutual nearest neighbors”) in the two transcriptomics spaces (function FindTransferAnchors from Seurat). These anchors were then used to project Pogona cells (“query” dataset) on the mouse dataset (“reference” dataset), using the TransferData function from Seurat. The projection is based on a weighted classifier, that assigns a classification score based on the distance of each cell from the transfer anchors. Fig. 3g represents the result of the classification, showing the fraction of single cells from each Pogona cluster mapping on each of the mouse subclusters (mouse subclusters without matching lizard cells are not indicated in the figure).
The approach described above was also used to project the transcriptomes of turtle pallial glutamatergic cells on the Pogona data (Ext. Data Fig. 7a). The turtle data are from ref. 11. The comparison was based on 9,820 one-to-one orthologs detected in both species. For this analysis, the top 2,000 variable genes of each dataset were used for CCA. The first 25 canonical components were used to compute 3,406 transfer anchors.
¶ ANATOMY
¶ Identification of Pogona brain areas with potential role in brain-state regulation
Areas known to play a role in controlling brain state have been, over the past decades, identified in a number of mammalian species. Those areas can be identified by their location (e.g., within the hypothalamus, midbrain or brainstem), their axonal projections, and by the neuroactive substances their neurons contain and release (and thus potential marker genes). To our knowledge, no such description exists at present for the brain of the bearded dragon (Pogona)
but anatomical studies of homologous areas have been performed by other lizard species (refs. 43,44,46-56). These references were used to identify relevant brain areas, including POA, SUM57 and TMN in the hypothalamus, VTA, SN and PAG in the midbrain, and LDT, LoC, SC, Ra in the brainstem. The location and identity of these areas were established in Pogona by IHC and/or FISH using appropriate neuronal markers, combined with Nissl stains of brain sections. Tyrosine hydroxylase (TH, marker of catecholaminergic neurons) was used to identify POA, VTA, SN, PAG and LoC (Extended Data Figs. 6). Choline acetyltransferase (ChAT) was used to identify LDT (Extended Data Figs. 6a). Histamine (His) was used to identify TMN (Extended Data Fig. 6a). Serotonin (5HT) was used to identify the raphe (Extended Data Fig. 6a). SC identification was based on the prior identification of LDT and LoC and by the expression of SLC17A6 (vesicular glutamate transporter 2, vGluT2, glutamatergic neuron marker) by ISH (Extended Data Fig. 6a). The expression of SLC17A6 by ISH was used also for the identification of SUM (Extended Data Fig. 6a) (see also ref. 57).
¶ Abbreviations
LoC: Locus coeruleus; LDT: lateral dorsal tegmental nucleus; PAG: periaqueductal grey; POA: preoptic area; Ra: Raphe; SC: subcoeruleus; SN substantia nigra; SUM: supramammillary nucleus; TMN: tuberomammillary nucleus; VTA: ventral tegmental area.
¶ Pogona whole-brain images
Pogona brain reconstruction (Fig. 3i) was based on images obtained with a µCT scanner, and the surface function of the Imaris software (Oxford Instruments). The boundaries of relevant nuclei were determined from consecutive serial histological sections. The serial images were aligned and assembled to 3D volumes using the Voloom software, and then imported into Imaris and aligned with the 3D data. The boundaries of some areas identified by retrograde tracing were defined from GFP and Nissl staining patterns.
¶ Immunohistochemistry and in situ hybridization
The lizards were deeply anesthetized with isoflurane, Ketamine (60 mg/kg) and Midazolam (2 mg/kg) until loss of the foot-withdrawal reflex. Pentobarbital (10 mg/kg) was then administered by intraperitoneal injection. After loss of the corneal reflex, the lizard was perfused transcardially with cold phosphate-buffered saline (PBS; 1.47×10⁻³M KH2PO4, 8.10×10⁻³M Na2HPO4·12H2O, 2.68×10⁻³M KCl, 1.37×10⁻¹M NaCl) followed by 4% paraformaldehyde (PFA) in PBS. The brain samples were post-fixed with 4% PFA/PBS for 16h at 4°C and subsequently immersed in 30% sucrose for 24h at 4°C. The brain area was sectioned coronally (60µm) with a microtome at -24°C. The sections were permeabilized for 30 min at room temperature (RT) in blocking solution (PBST: PBS with 0.3% Triton X-100 and 10% goat serum) and incubated with primary antibodies (anti-GFP, A10262, Invitrogen, Chicken, 1:1000; Hippocalcin, ab24560, abcam, rabbit, 1:1000; ChAT-choline acetyltransferase, AB144P, Merk, Goat, 1:100; mTH-tyrosine hydroxylase, 22941, Immunostart; mouse, 1:100; rabTH, AB152, Merk, rabbit, 1:200; Histamine, 22939, Immunostart, rabbit, 1:100; Serotonin, MAB352, Merk, rat, 1:100) in blocking solution overnight at 4°C. After washing with PBST 3 times, the samples were incubated with secondary antibodies conjugated with appropriate secondary antibodies (1:500, All from Invitrogen) in blocking solution for 4 h at RT. Ensued three washes with PBST. Some slices were counterstained with NeuroTrace 435/455 blue-fluorescent Nissl stain (N21479, Invitrogen, 1:200) in PBS for 2h at RT. After rinsing with PBS, the samples were mounted with Dako Fluorescence Mounting Medium (S3023, Dako) or Roti-Mount FluorCare DAPI (HP20.1, Carl Roth). Images were acquired using a confocal system or fluorescent microscopy at 10x, 20x or 40x. Chromogenic ISHs and dual colorimetric ISHs were performed following the protocols previously described in ref 11.
¶ Fluorescent in situ hybridization by RNAscope
The lizards were deeply anesthetized as described above. After loss of corneal reflex, the animals were sacrificed by decapitation. Brains were dissected out immediately, embedded in OCT on dry ice/ethanol bath and stored at –80 °C. Fresh-frozen brains were sectioned at 25µm on a Thermo Fisher Scientific CryoStar NX70 cryostat and placed onto SuperFrost-coated (Thermo Fisher Scientific) slides. Some slides were stored at –80 °C after air drying. RNAScope hybridization was performed according to the manufacturer’s instructions. We used the RNAscope Multiplex Fluorescent assay (Advanced Cell Diagnostics) for fresh-frozen sections. Target genes and probe catalogue numbers were Pv-CHAT-C2, 522631-C2; PvSLC17A6-C1, 529431-C1. Fluorescent Nissl was used for counterstaining. Slides were mounted with ProLong Gold Diamond Antifade Mountant (P36970, Thermo Fisher Scientific). Images were acquired with a digital slide scanner (Pannoramic MIDI II, 3DHISTECH) at 20x magnification.
¶ Tract tracing
The lizards were anesthetized as described for in vivo recordings. Extensive preliminary search for useful AAV serotypes for reptilian brains and for appropriate incubation conditions were carried out by Lorenz Pammer22. The tracers (rAAV2-retro-CAG-GFP, 37825-AAVrg; rAAV2-retro-hSyn-EGFP, 50465-AAVrg; AAV9-CB7.Cl.mCherry.WPRE.RBG, 105544- AAV9; all from Addgene, https://www.addgene.org) were injected in one or two forebrain locations (e.g., dorso-medial cortex, DVR, amDVR, etc). Four to 6 weeks later, the animals were deeply anesthetized as described above; after loss of corneal reflex, the animals were sacrificed by decapitation. Brains were dissected out, processed for histology, sectioned and imaged. The data presented come from 18 of 30 injected brains. The remaining 12 brains were rejected either because the viral injections failed or because the injections were not sufficiently specific. Targeting specific regions in the brain of Pogona and Trachemys is difficult because the brain is loosely contained in the cranial cavity and its position relative to the cranium and reliable landmarks is thus variable: the brain floats in CSF, attached by cranial nerves. As a consequence, there exists no reliable stereotactic coordinates based on cranium landmarks. The lateral ventricles are large. The external appearance of the forebrain also lacks reliable landmarks (e.g., blood vessels or sulci). Finally, these animals are not standardized species, bred over generations to reduce variability.
Note that, because rAAV2-retro does not infect all neuron types equally23, negative retrogradelabeling results should be confirmed with other methods. Conversely, connectivity estimated using the tracers we used is likely underestimated.
¶ STATISTICS and REPRODUCIBILITY
Unless stated otherwise, data are mean ± s.e.m. For comparisons of two groups we performed a two-tailed unpaired t-test, two-tailed paired t-test, Mann-Whitney rank-sum test or Wilcoxon signed-rank test, as appropriate (all two-sided). For multiple comparisons we performed a Bonferroni test. Significance was determined with the 0.05 alpha level for all statistical tests. Box plot (Fig 4d): margins are 25th and 75th percentiles; red: median; whiskers: boundaries before outliers; outliers (+) are values beyond 1.5 × interquartile range from the box margins. Experiment numbers and repetitions are indicated in the table below.
| Figure 1b-e | The experiment was repeated 7 times independently with similar results. |
| Figure 2a-c | The experiments were repeated 4 times independently with similar results. |
| Figure 2e | The experiments were repeated amDVR:13 times; plDVR: 9 times independently with similar results. |
| Figure 3 | a-b,d-h: The experiments were repeated 4 times; c:10 times independently with similar results. |
| Figure 4a-c | The experiments were repeated3 times independently with similar results. |
| Extended Figure la-d | The experiments were repeated 7 times independently with similar results. |
| Extended Figure 1h | The experiments were repeated 3 times independently with similar results. |
| Extended Figure 2b | The experiments were repeated 15 times independently with similar results. |
| Extended Figure 2g&i | The experiments were repeated 12 times independently with similar results. |
| Extended Figure 2h&j | The experiments were repeated 2 times independently with similar results. |
| Extended Figure 3f | The experiments were repeated 3 times independently with similar results. |
| Extended Figure 4a | The experiments were repeated 3 times independently with similar results. |
| Extended Figure 4b | The experiments were repeated; amDVR:13 times; plDVR: 9 times independently with similar results. |
| Extended Figure 6a-c | Except c5-7, the experiments were repeated at least 3 times independently with similar results. C5-7 were rprodued oncein 5experiments (seFig. 3 legend) |
| Extended Figure 8a,e-f | The experiments were repeated 4 times independently with similar results. |
| Extended Figure 8b-d | The experiments were repeated 4 times independently with similar results. |
| Extended Figure 7b | The experiments were repeated 3 times independently with similar results. |
| Extended Figure 7c | The experiments were repeated 5 times independently with similar results. |
| Extended Figure 7d | The experiments were repeated 4 times independently with similar results. |
| Extended Figure | The experiments were repeated 3 times independently with similar results. |
| 7eg Extended Figure 8a,e-f | The experiments were repeated 4 times independently with similar results. |
| Extended Figure 8b-d | The experiments were repeated 4 times independently with similar results. |
| Extended Figure 9a-d | The experiments were repeated 2(a),2(b)and 3 (c)times with similar results.Lesion of claustrum (d) was confirmed for all experiments. |
| Extended Figure 10a-b | The experiments were repeated 2 (a) and 3-4 times (b)independently and with similar results |
Sequencing data have been deposited in the NCBI Sequence Read Archive: BioProjects PRJNA591493 (lizard); PRJNA408230 (turtle); Links to those archives and to analysis code can be found at: https://brain.mpg.de/research/laurent-department/software-techniques.html. Data available upon request to GL (gilles.laurent@brain.mpg.de).
¶ Extended Data Legends
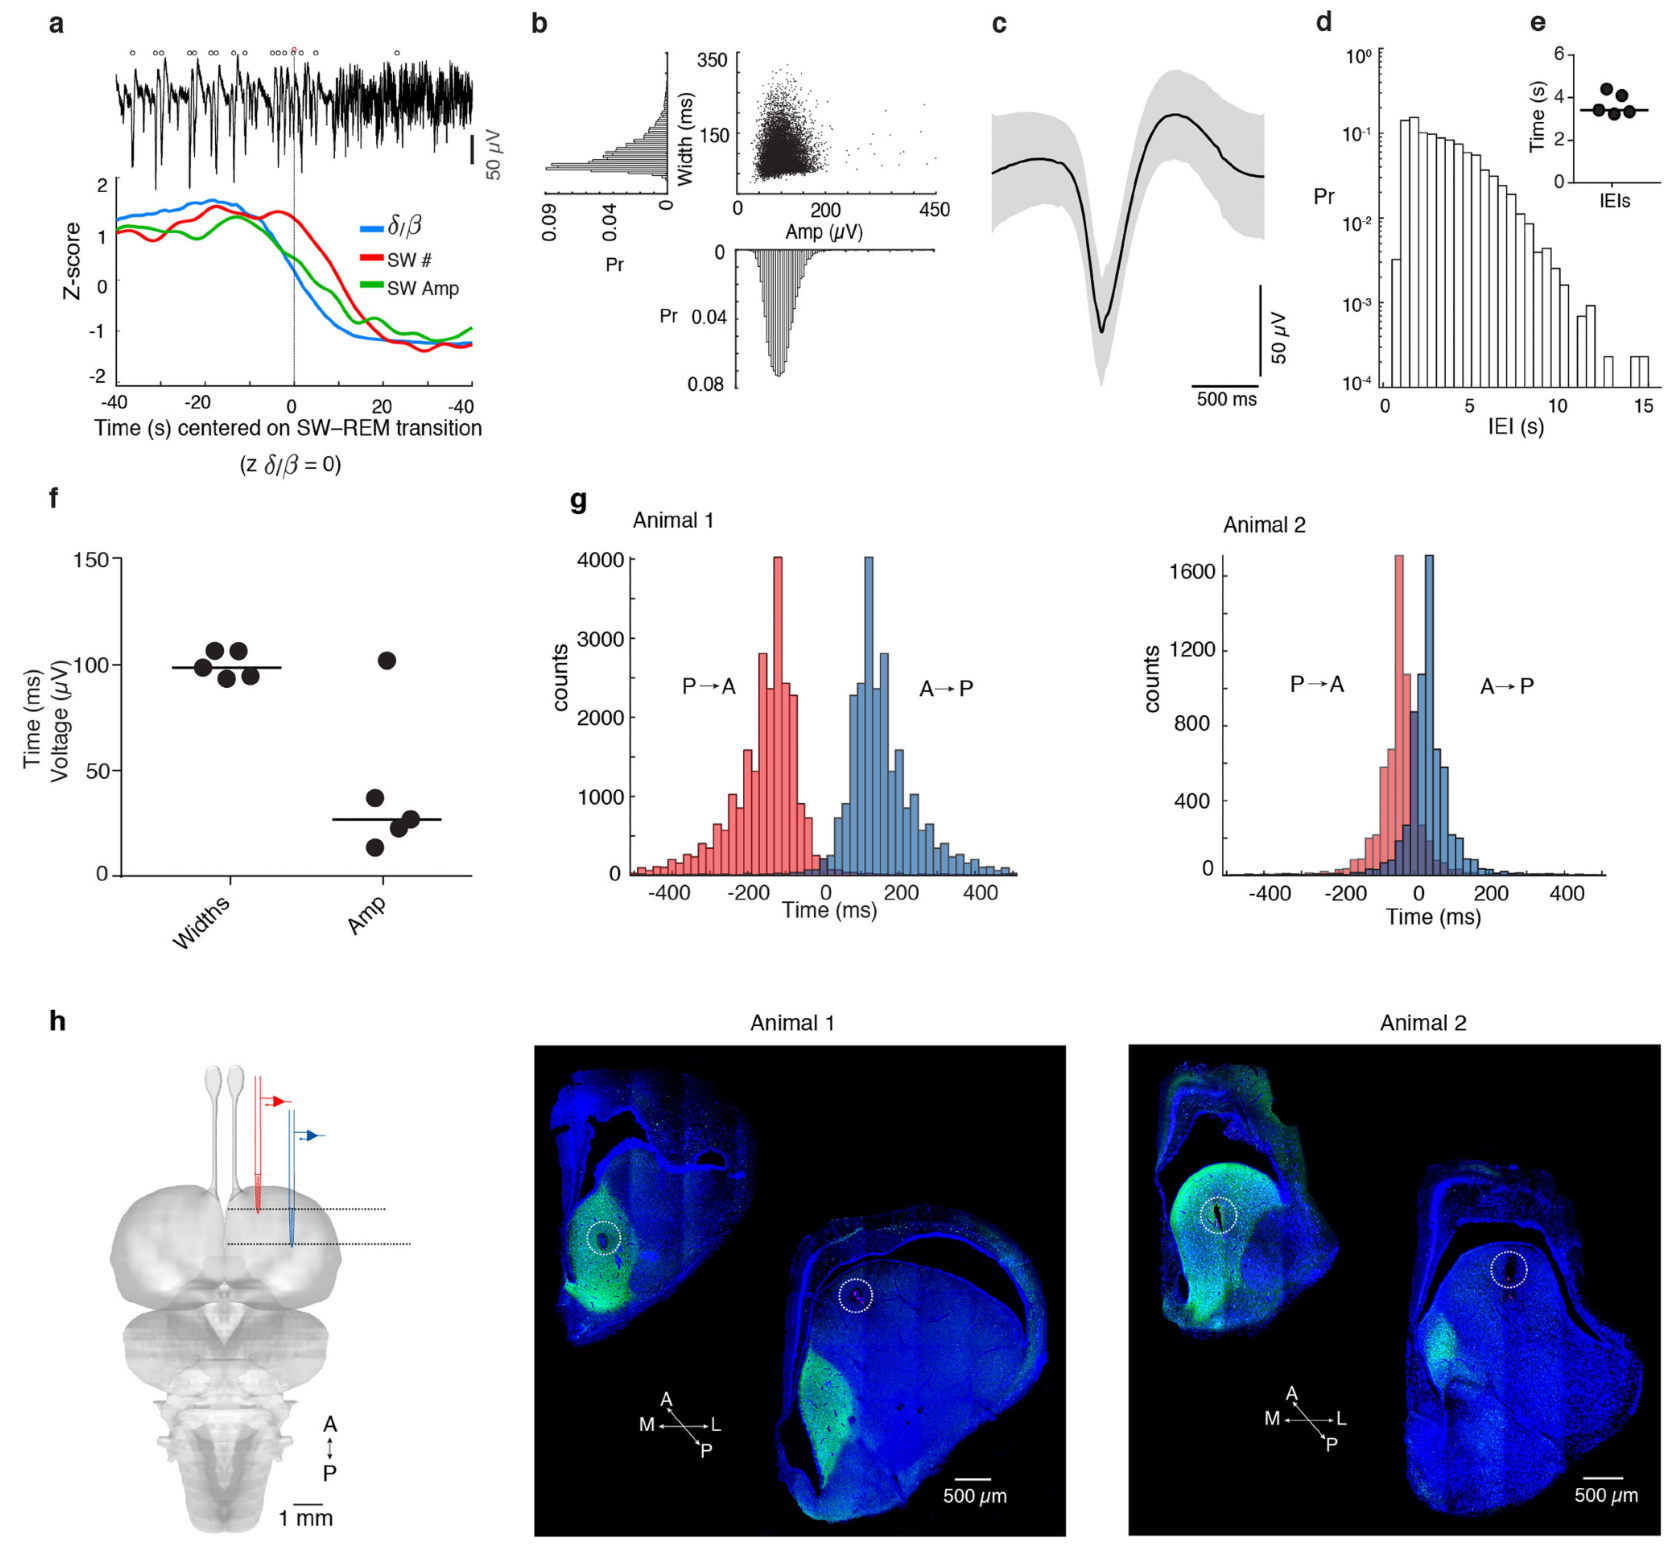
Extended Data Figure 1 | Further description of SWR statistics and propagation in vivo. a, SW amplitude and frequency vary as the animal transitions between SW and REM sleep. Top: illustrative LFP trace (<150 Hz) showing a decrease in sharp-wave amplitude and frequency around the SW-REM transition point. Open circles indicate detected sharp-waves (see Methods and ref. 3). Data in a-d are from the same animal and a single night, corresponding to the recording in Fig. 1 (anterior recording site, red). Statistics based on n = 11,123 sharpwaves. b, Distribution of sharp-wave width (measured at half peak amplitude) and peak amplitude from animal in Fig. 1 and Extended Data Fig. 1a. c, Mean sharp-wave ± 1 SD (grey), n = 11,123 sharp-waves. d, Inter-Event Interval (IEI) for sharp-waves recorded during SWS. y-axis in log scale. e, f, Summary of data recorded over 5 nights from 2 animals. Each circle represents the mean of one night; black line shows the median. e, Mean inter-event intervals (IEIs) during SW sleep. f, Mean sharp-wave width and amplitude (n = 8,055–13,494 sharpwaves/night). g, Delay distributions of sharp-waves in anterior (or posterior) DVR, triggered on simultaneously recorded posterior (or anterior) DVR. Sharp-waves from 3 nights (animal 1, n = 24,501 SWs), and 2 nights (animal 2, n = 13,070 SWs). h, Locations of simultaneous recording sites in aDVR (circles). Left: schematic of recording configuration. Middle and right: Confocal images highlighting recording sites, as identified by electrolytic lesions and DiI applied to the back of the silicon probes. Post-hoc staining with an antibody against hippocalcin was used to determine claustral borders (see Fig 3).
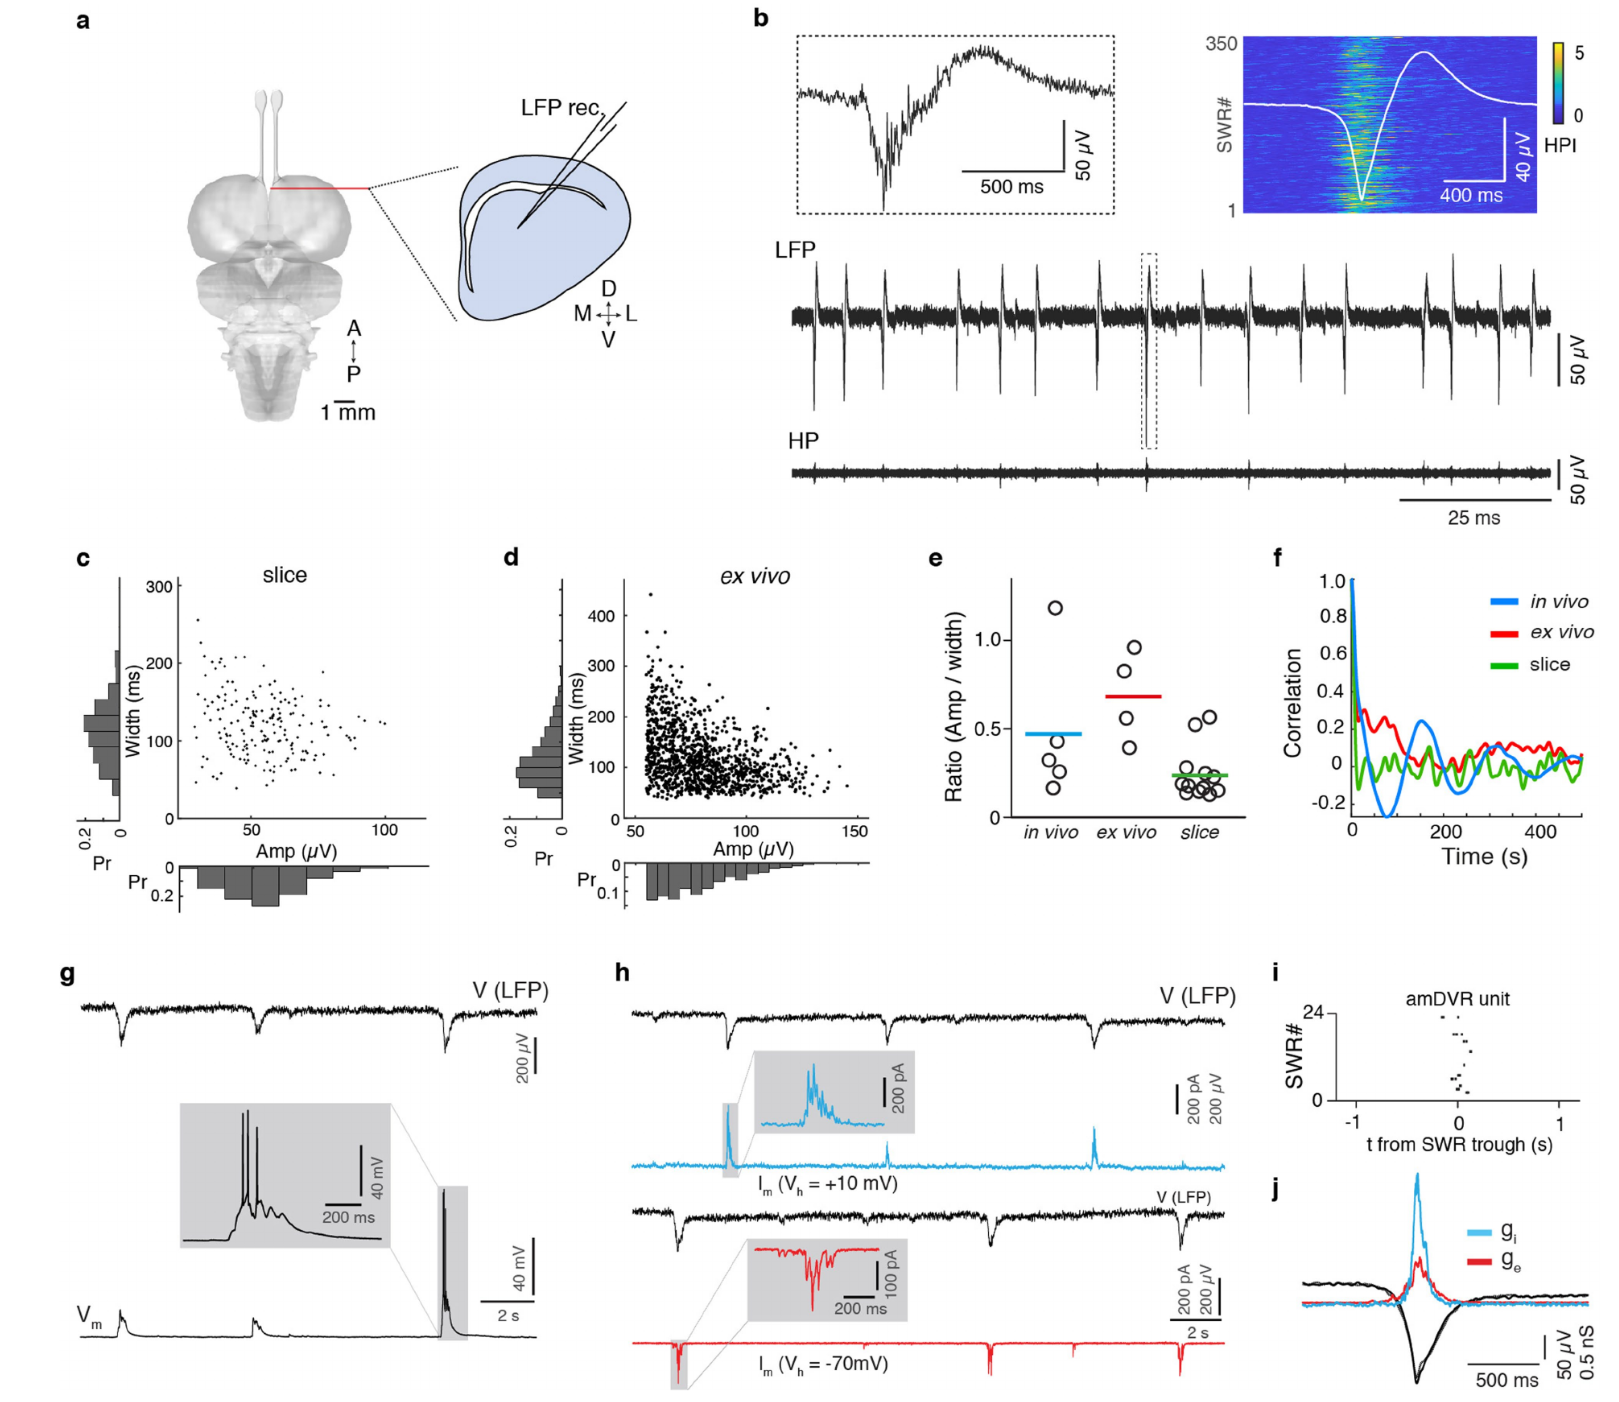
Extended Data Figure 2 | Comparison of SWR statistics across preparations and recording conditions. a, Slice preparation (see Methods)) for field-potential recordings. b, Spontaneous sharp-waves (LFP, <150 Hz) and corresponding ripples (HP, 70-150 Hz) in amDVR. Insets: top left, expanded SWR in box; top right: 350 ripples; high-pass signal intensity (HPI, >70 Hz) aligned on trough of sharp-wave (overlaid as average). c, Distribution of amplitude (x) and width (y, full width at half-maximum) of SWR events in a representative DVR slice. d, Distribution of SWR amplitude and width (as in c) in a representative ex vivo preparation. e, Ratio of amplitude (μV) to width (ms). n = 5 sleep epochs from 3 animals (in vivo), 4 ex vivo brains, and 12 slices. Colored lines: means. f, Autocorrelation function of sharp-wave times showing that the characteristic rhythmic modulation of sharp-wave generation (due to the alternation of SWS and REMS with 2-3min period) in sleeping animals (in vivo, blue) is absent from both ex vivo brain (red) and slice (green) preparations. n = 5 epochs from 3 animals (in vivo), 4 ex vivo brains, and 12 slices. g, Whole-cell patch-clamp (WCPC) recording in current-clamp mode of a DVR neuron (Vm) together with LFP recording in neighboring region (LFP) with a glass micropipette. Note simultaneous depolarization of the neuron and SWRs, and moderate neuronal depolarization giving rise to occasional firing (3 action potentials here). Experiment repeated with 12 neurons. h, WCPC recording of an amDVR neuron in V-clamp mode, held at depolarized (cyan) and hyperpolarized (red) holding potentials (Vh). Note volleys of excitatory (red) and inhibitory (cyan) currents at each SWR (LFP), and near absence of synaptic input in between. i, Spike times of patched amDVR neuron in relation to sharp-wave. Note locking to sharp-wave trough (t=0), and absence of firing otherwise. n = 2 amDVR neurons. j, Mean excitatory (ge) and inhibitory (gi) conductances (n = 20 and 21 events, respectively). Black/grey: averaged SWs recorded with i and e conductances. Traces aligned on sharp-wave trough.
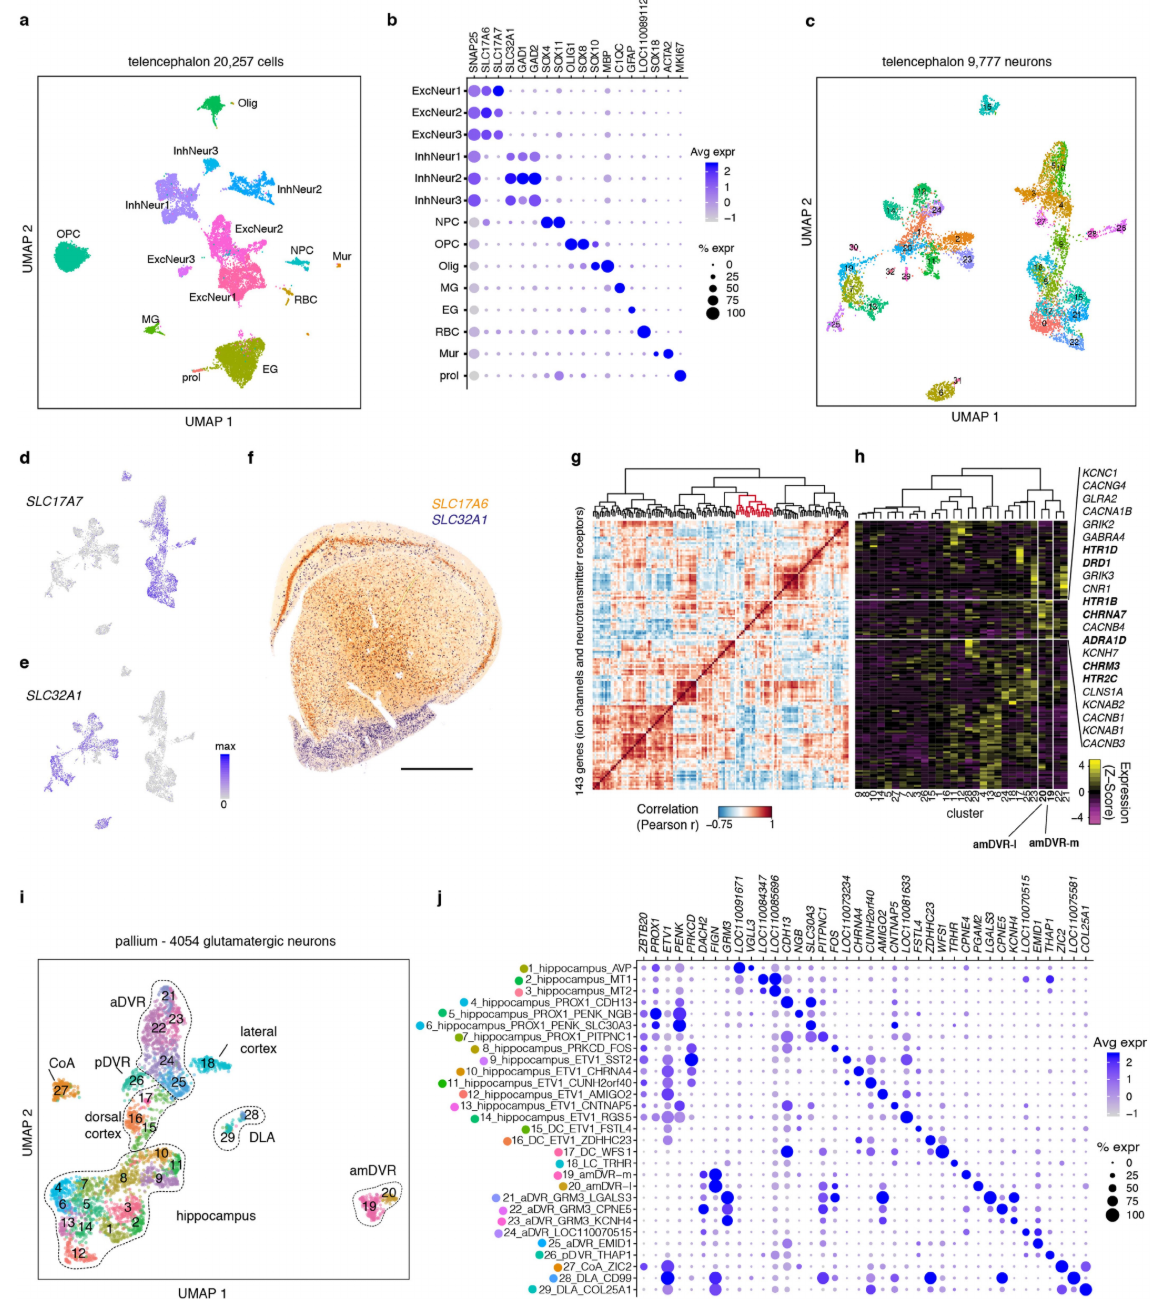
Extended Data Fig. 3 | Additional single-cell transcriptomic characterization. a, UMAP45 representation of 20,257 Pogona telencephalic cells, color-coded by cluster. EG: ependymoglial cells; ExcNeur: excitatory neurons; InhNeur: inhibitory neurons; MG: microglia; Mur: mural cells; NPC: neural progenitor cells; Olig: oligodendrocytes; OPC: oligodendrocyte progenitor cells; RBC: red blood cells. b, Dotplot showing expression of canonical cell markers (along each row) across telencephalic cell clusters (columns). Dot size: percentage of cells in a cluster in which the gene has been detected; color: expression level. c, UMAP representation 9,777 lizard telencephalic neurons, color-coded by cluster. d-e UMAP representations of glutamatergic (SLC17A7) and GABAergic (SLC32A1) neurons in the telencephalon dataset. f, Double colorimetric in situ hybridization in a frontal section through the anterior Pogona forebrain. Scale bar: 1,000 µm. SLC32A1 (blue) labels GABAergic neurons in the subpallium and scattered GABAergic neurons that have migrated from subpallium to pallium. SLC17A6 (orange) labels glutamatergic neurons in the pallial region. g, Ordered matrix of pairwise Pearson’s correlations between expression of 143 ion channels and neurotransmitter receptor genes detected in this glutamatergic pallial Pogona dataset (see Extended Data Fig. 5). Dendrogram (top) based on correlation coefficients and Ward.D2 linkage; red indicates a gene module with enriched expression in amDVR. h, Average expression, in the 29 glutamatergic Pogona clusters, of the 143 genes in g (and Extended Data Fig. 5). Genes with enriched expression in amDVR listed at right. i, UMAP representation 4,054 lizard pallial glutamatergic neurons, color-coded by cluster (same as in Fig. 3). j, Dotplot showing expression of specific cluster markers (along the rows) in the 29 pallial glutamatergic clusters (along each column). Dot size: percentage of cells in a cluster in which a gene is detected; color: expression level.
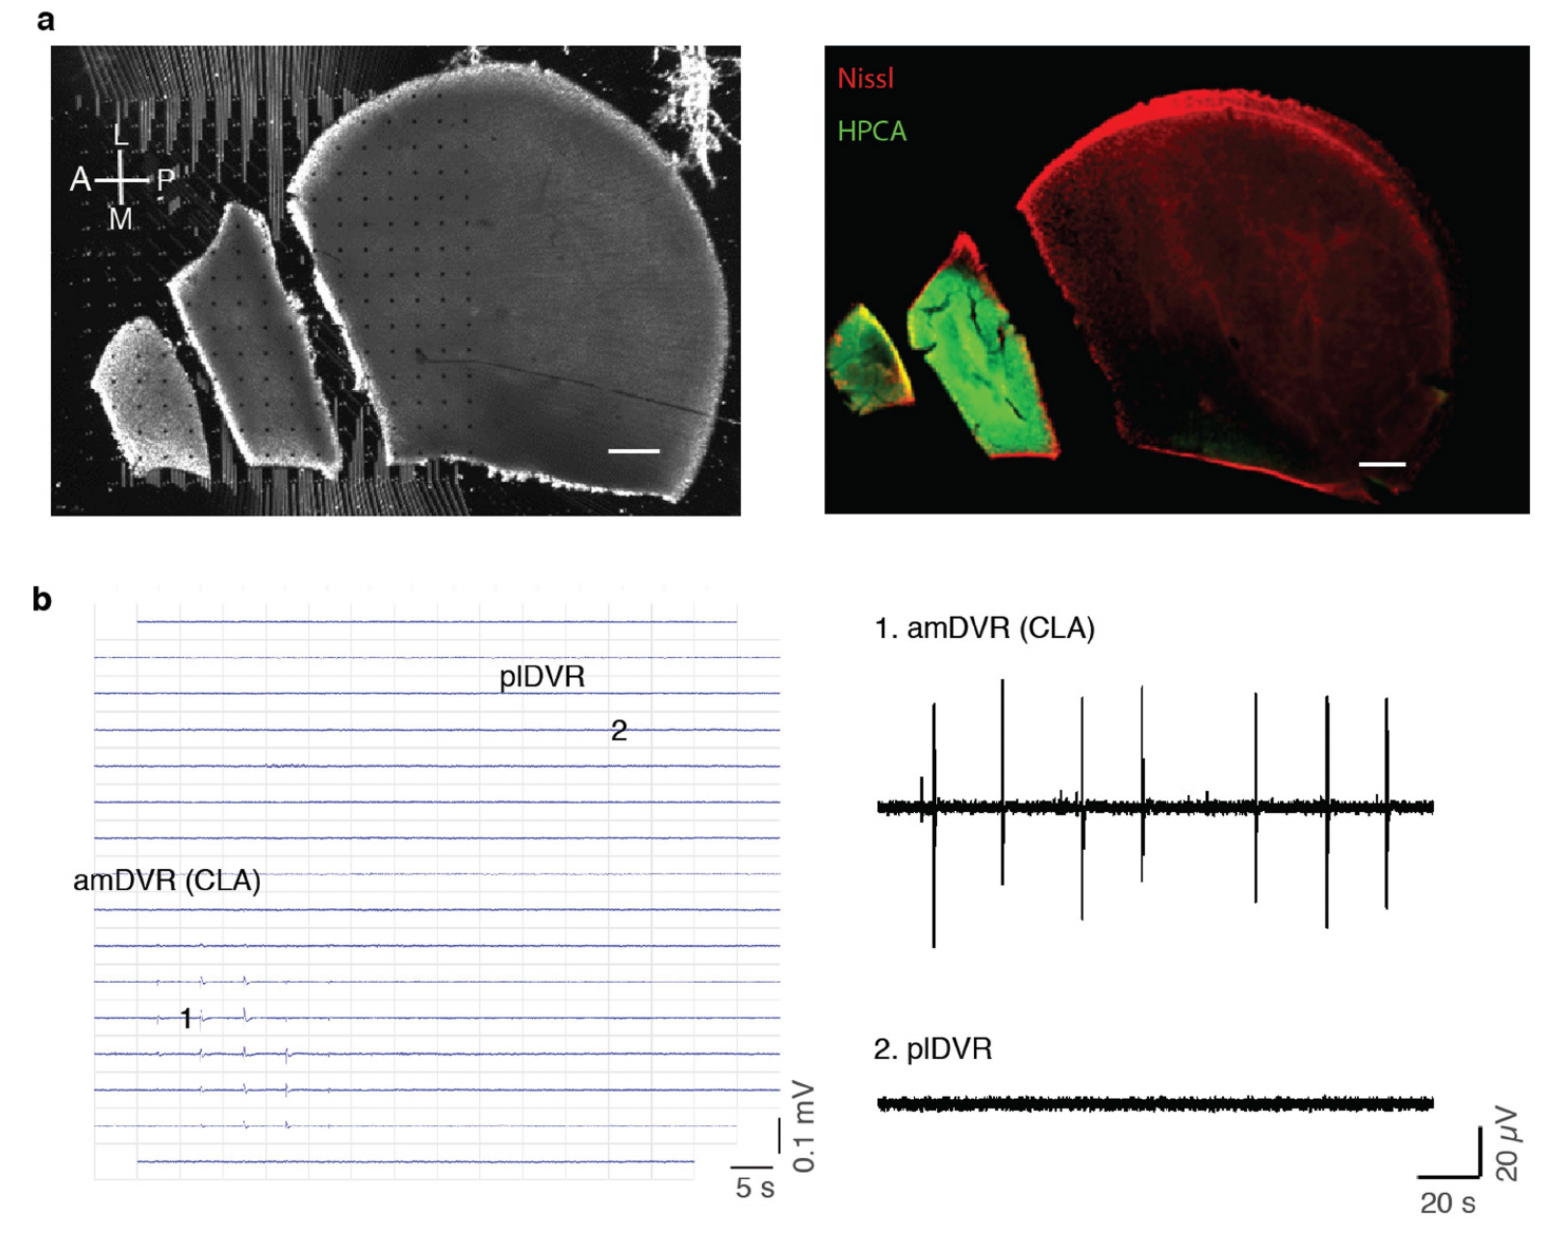
Extended Data Fig. 4 | Minislices of DVR and localization of SWR generation. a, Left, Recording configuration of mini-DVR slices on a planar 252 channel MEA. Dots represent electrodes. Right, posthoc immuno-staining of the slices at left. Red: Nissl, Green; Hippocalcin (HPCA). b, Left, Spatial distribution of SWR waveforms as recorded from minislices in a. Right, illustrative LFP traces recorded from the amDVR or claustrum (1) and posterior lateral DVR (2) (see recording positions on the micro-electrode array at left). In conclusion, SWRs occur spontaneously in amDVR, and are absent from plDVR once it is disconnected from amDVR (claustrum).
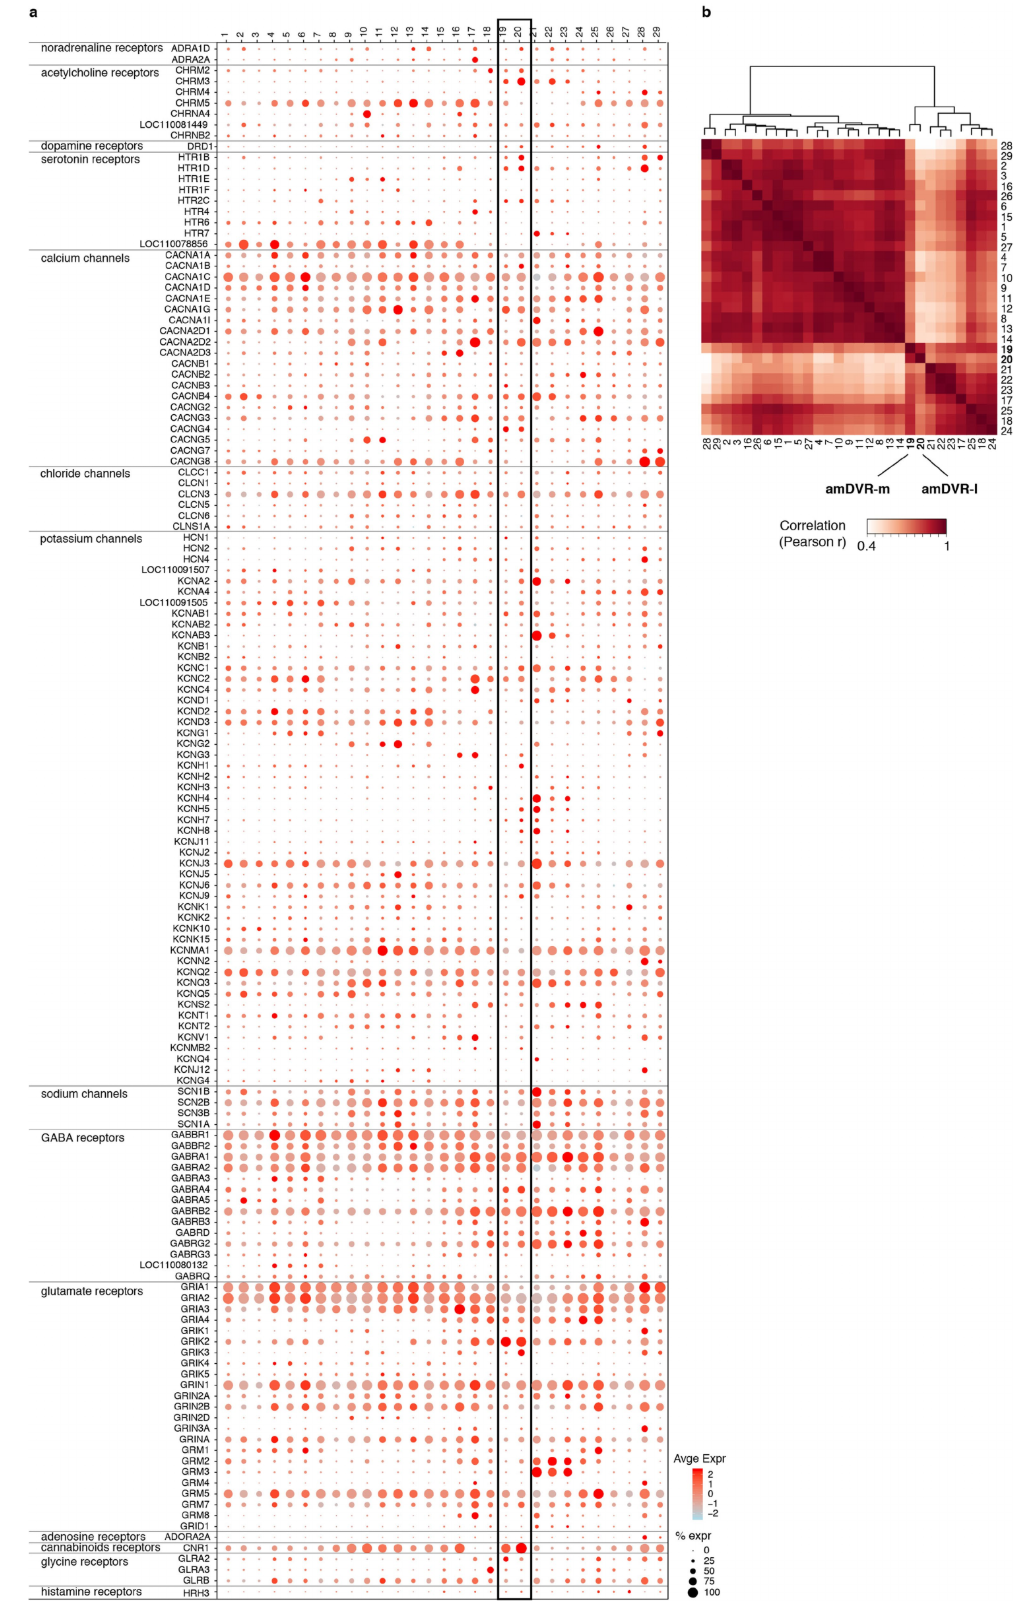
Extended Data Fig. 5 | Ion-channel and neurotransmitter-receptor mRNAs in the glutamatergic cell clusters of the Pogona telencephalon. a, Dotplot showing expression of ion-channel and neurotransmitter-receptor genes (rows) in Pogona glutamatergic clusters (columns 1-29). The plot shows only genes detected in at least 20% of the cells of at least one cluster. Dot size indicates the percentage of cells in a cluster where the gene was detected; dot colors indicate expression level. Clusters 19 and 20 (box) correspond to the amDVR or claustrum. They differ by the expression of some ACh- and 5HTreceptor subtypes (see also Fig. 3h). b, Ordered pairwise Pearson’s correlation matrix of cluster transcriptomes, calculated from the expression of the ion-channel and neurotransmitterreceptor genes in a. This gene set is sufficient to distinguish the amDVR clusters (19 and 20) from all others. The dendrogram is based on Pearson correlations and Ward.D2 linkage.
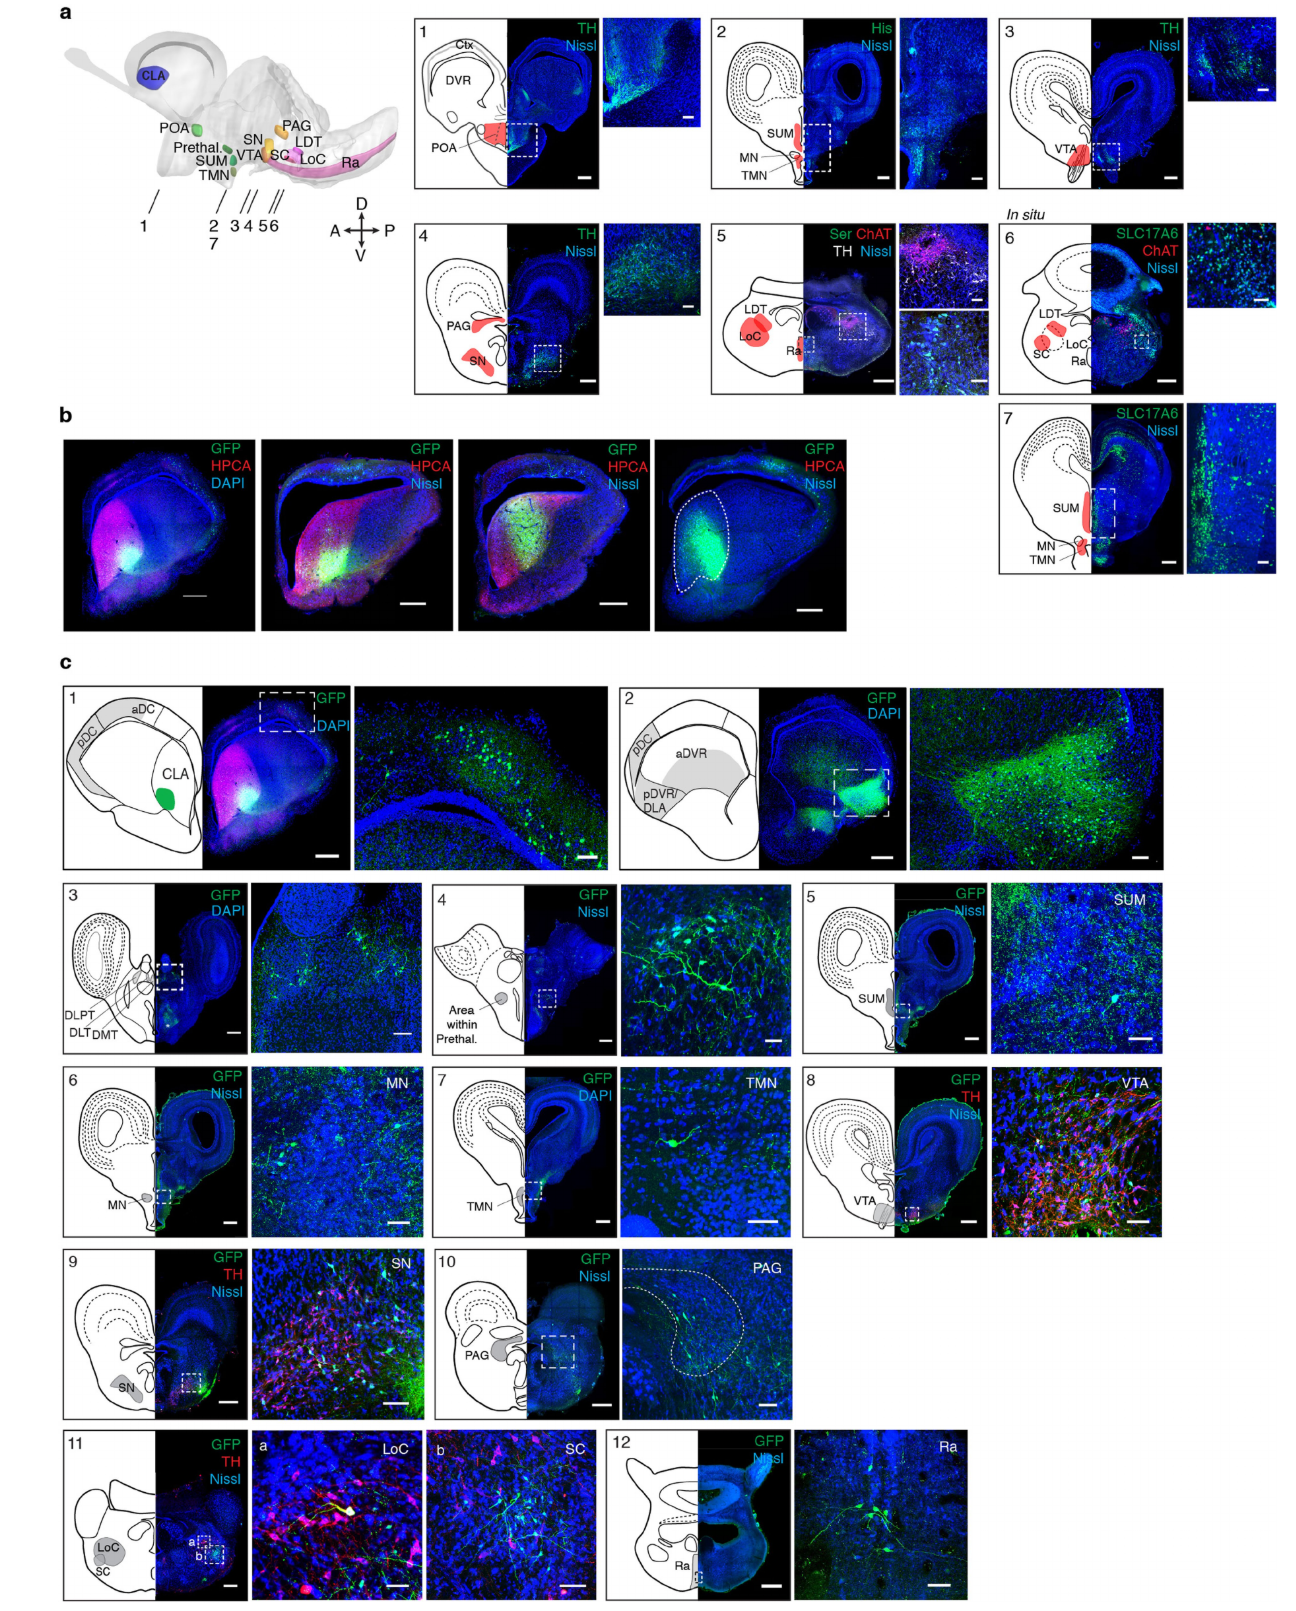
Extended Data Fig. 6 | Identification of potential regulatory areas of brain states and distribution of GFP labeled neurons after claustrum injection of rAAV2-retro. a, Left, Schematic of the Pogona brain in sagittal view, showing the regions defined by immunohistochemistry, in situ hybridization and retrograde tracing. 1-7 indicate levels of transverse sections shown at right. Panels 1-7: Micrograph and corresponding schematic representation of relevant areas (in red), identified by IHC, ISH (in situ) and Nissl stains. Scale bars: 500 µm. To the right in each panel: magnified view of area(s) delineated as box(es) in photomicrographs. Scale bars: 100 µm. b, Identification of AAVrg-hSyn-eGFP injection sites. Scale bar: 500 µm. (Rightmost panel: red channel not shown.) c, Illustrative examples of retrograde labeling of claustrum connectivity, in transverse sections. 1-2: Inputs to claustrum revealed by rAAV2-retro injection in claustrum. Panel 1: injection site in lateral claustrum; claustrum indicated by anti-hippocalcin immunostain (pink); note retro-labeled cells in aDC (box, magnified at right). Panel 2: Same brain as in 1, more posterior section; labeled region in box is DLA. 3-12: Representative images illustrating the distribution of GFP-labeled neurons in DLPT, DLT, DMT, prethalamus, SUM, MN, TMN, VTA, SN, PAG, LoC and SC, with projections to claustrum. Catecholaminergic neuron marker tyrosine hydroxylase (TH) used to indicate location of VTA, SN and LoC. Scale bar: 500 µm; Magnified area calibrations: DLPT, DLT, DMT, prethalamus, SUM, MN, TMN, VTA, LoC: 50 µm; SN, PAG, SC: 100 µm.
Abbreviations: CLA:claustrum; aDC: anterior dorsal cortex; pDC: posterior dorsal cortex; DMT: dorso-medial thalamus; DLA: dorso-lateral (basolateral) amygdala; DLT: dorso-lateral thalamus; DLPT: dorso-lateral posterior thalamus; DMC: dorso-medial cortex; aDVR: anterior dorsal ventricular ridge; pDVR: posterior dorsal ventricular ridge; LC: lateral cortex; LoC: Locus coeruleus; LDT: lateral dorsal tegmental nucleus; MC: medial cortex; MN: mammillary nucleus; PAG: periaqueductal grey; POA: preoptic area; SC: subcoeruleus; SN substantia nigra; SUM: supramammillary nucleus; TMN: tuberomammillary nucleus; VTA: ventral tegmental area.
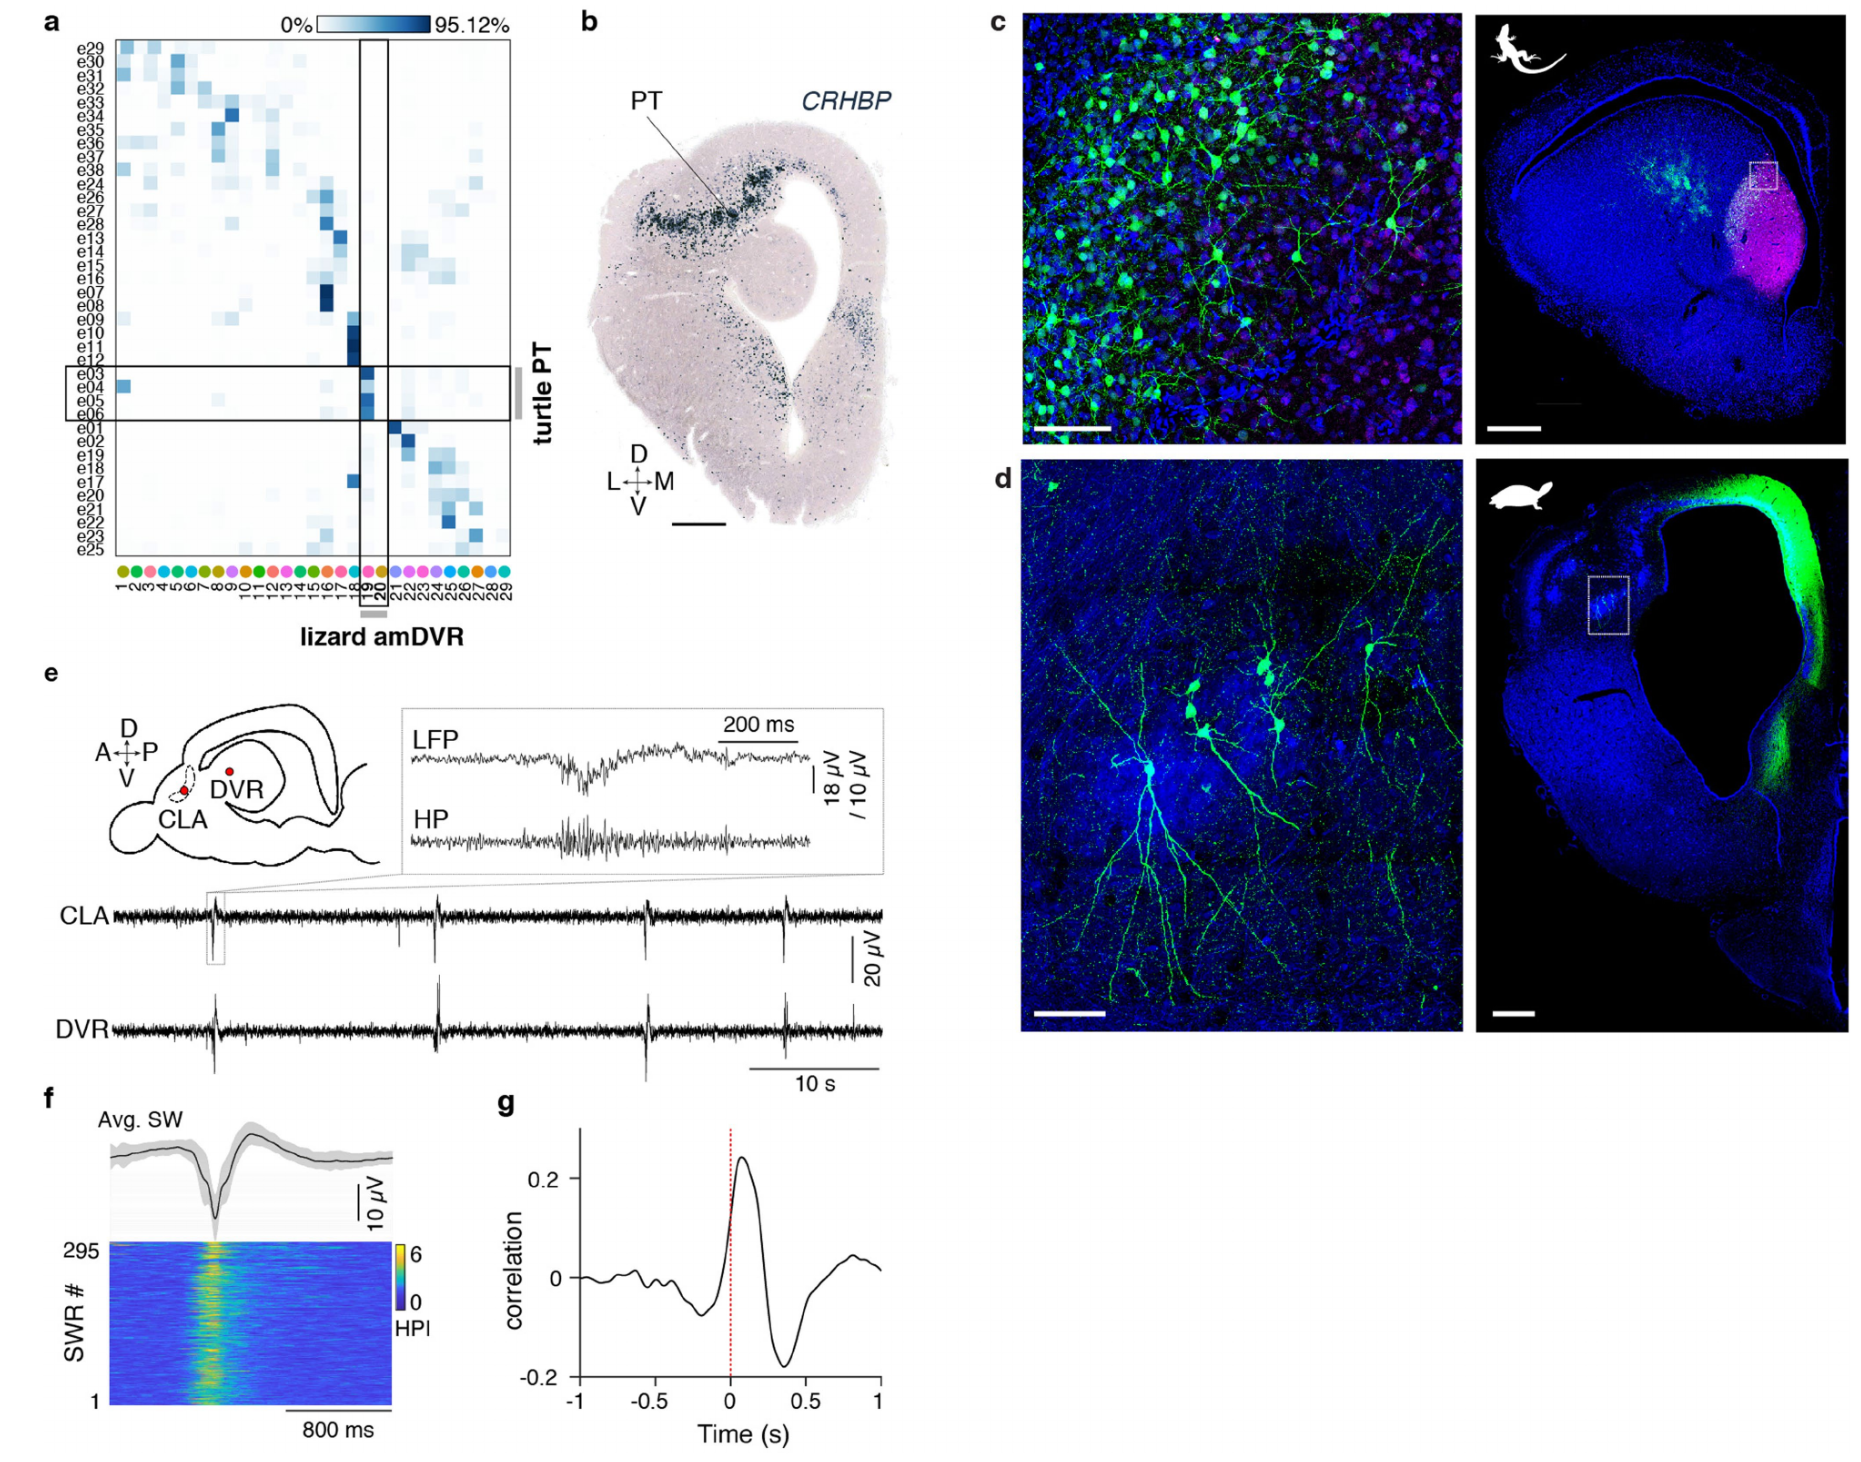
Extended Data Fig. 7 | The claustrum of lizard and turtle differ in position and architectonics, but both are autonomous sources of SWRs. a, Transcriptomic similarity between turtle and lizard clusters, measured as fraction of single cells mapping from the turtle pallium dataset to Pogona clusters (Methods). Note that the turtle cell clusters e03-06 (pallial thickening, or PT) map on the lizard cluster 19 (amDVR or claustrum). Turtle data and clusters from ref. 11. b, ISH in an anterior transverse section showing expression of PT marker CRHBP. Scale bar: 500μm. c, Architectonic of lizard claustrum. Retrograde labeling of claustrum neurons by rAAV2-retro injected in aDVR (right). Left panel: magnification of boxed area in right panel (in claustrum). Note disordered distribution of multipolar neurons. Pink: anti-hippocalcin immunostaining. Calibration: 100μm (L); 500μm ®. d, Architectonic of turtle claustrum. Retrograde labeling of claustrum neurons by rAAV2-retro injected in DMC (right panel). Left panel: magnification of boxed area in right panel. Note arrangement of bipolar neurons within PT layer (see also b for layering of PT). Scale bar: 100μm (L); 500μm ®. e, Spontaneous sharp-waves recorded simultaneously in claustrum and DVR in turtle slice preparation. Red dots (schematic): recording sites. Note sharp-wave (LFP) and ripple in high-pass (HP) band. f, Bottom: 295 successive spontaneous ripples; high-pass signal intensity (HPI, >70Hz) aligned on trough of sharp-wave. Average of 295 sharp-waves, aligned on waveform troughs; grey: SD. g, Representative cross-correlogram of LFP traces recorded simultaneously from claustrum and DVR (reference: claustrum), showing DVR trailing claustrum.
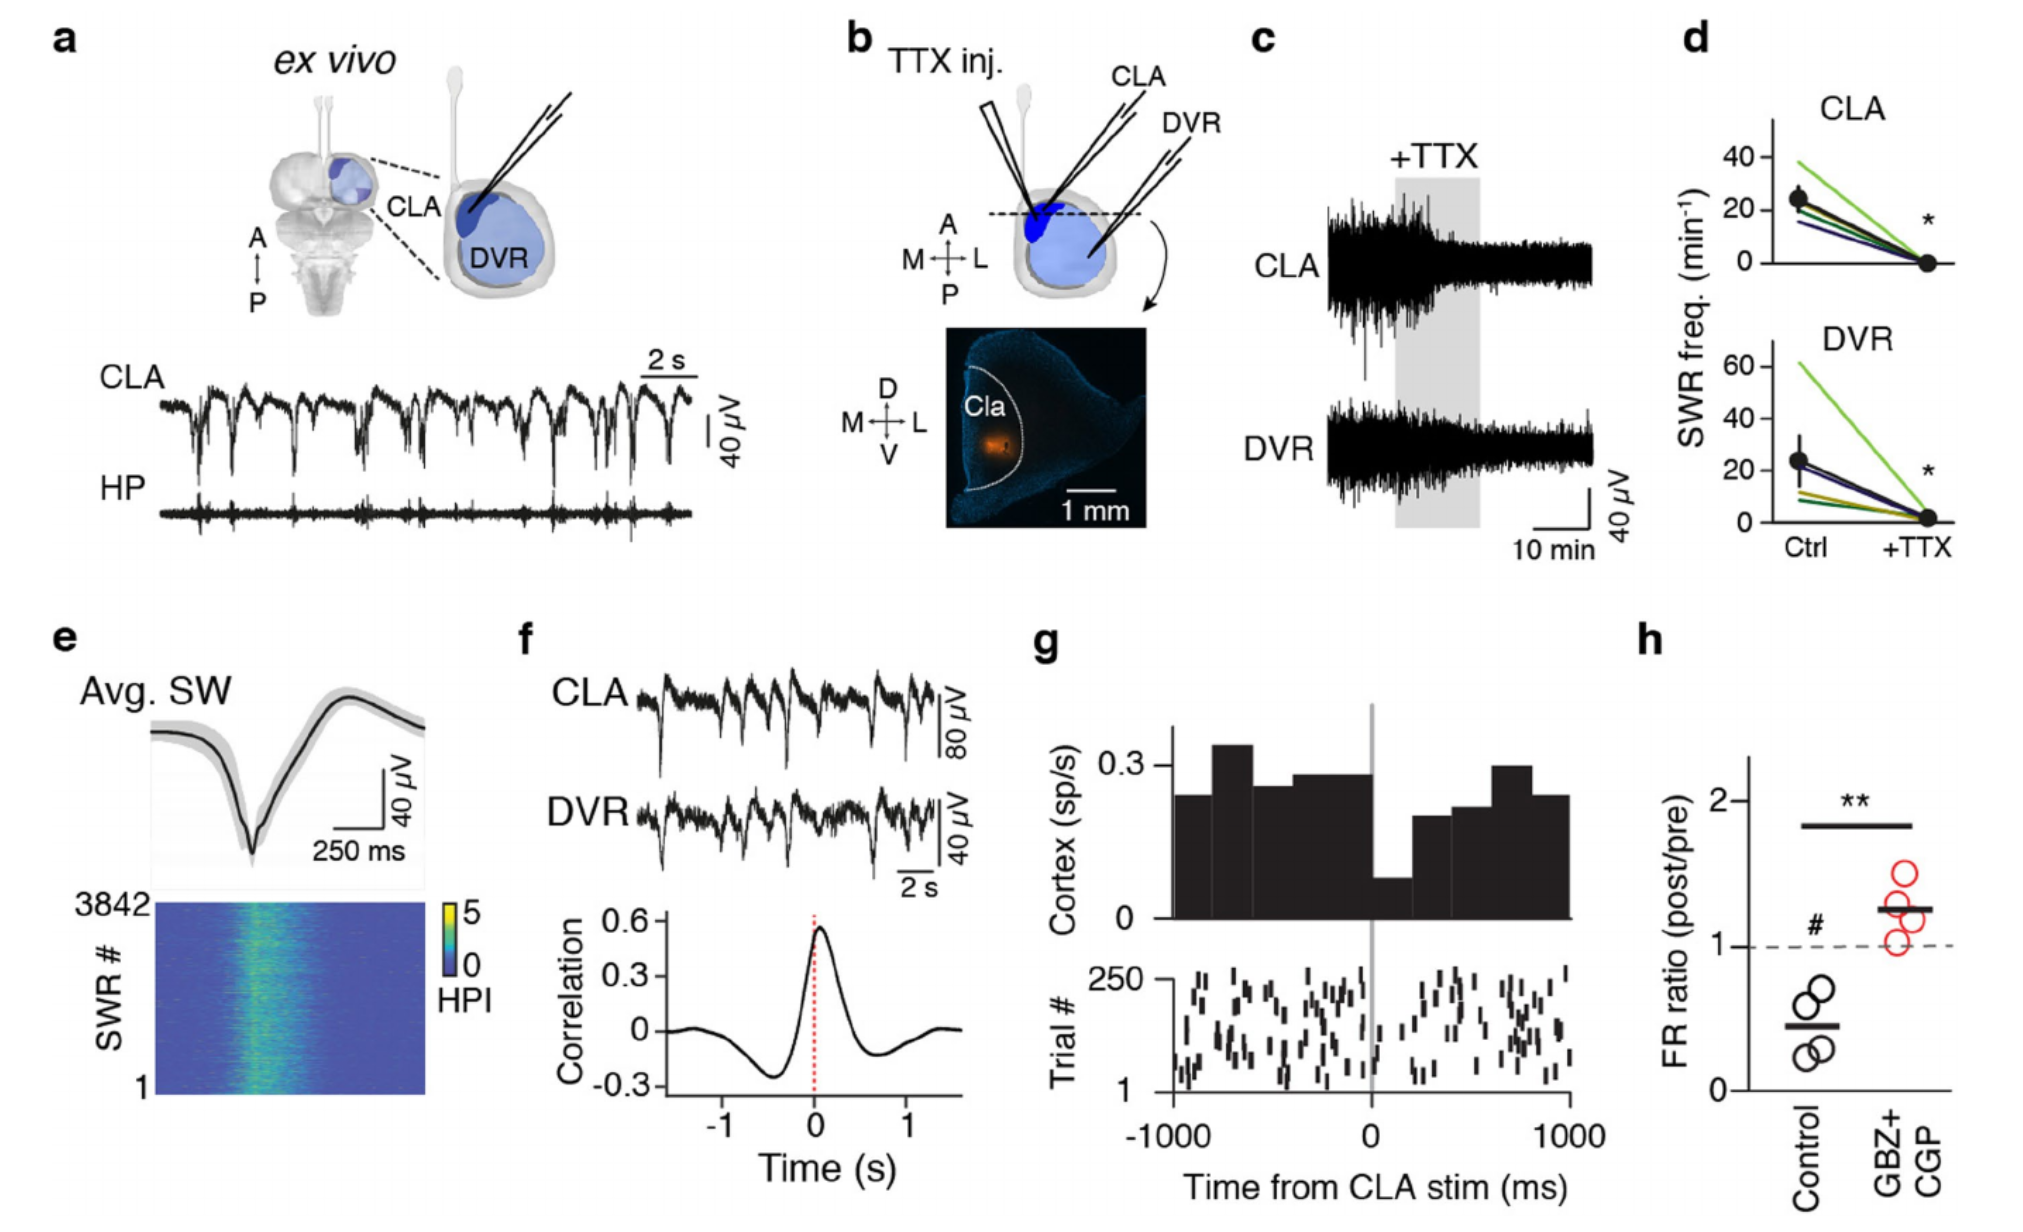
Extended Data Fig. 8 | Sharp-wave ripple recordings and stimulation experiments with lizard ex vivo brain preparations. a-f: Experiments in ex vivo brain preparation (a, top left) after cortex removal. a bottom, Spontaneous SWRs recorded in the claustrum (CLA, <150 Hz). HP: 70-150-Hz filtered LFP, showing ripples (bottom trace). b, Local pressure injection of 20μM TTX in claustrum and post hoc assessment of injection with Evans blue (red, transverse section, bottom). c, TTX injected in claustrum (shading) silences sharp-wave activity in CLA, but also (indirectly) in DVR. d, Analysis of 4 experiments as in c. Filled circles: mean±s.e.m. CLA: *p=0.029, T=26, two-sided Mann-Whitney rank-sum test. DVR: *p=0.029, T=26, two-sided Mann-Whitney rank-sum test. e, Average trace (top) and standard deviation (shading) from 3,842 sharp-waves recorded from claustrum of an ex vivo forebrain (alignment on trough). Bottom: high-pass signal intensity (HPI, >70 Hz) aligned on sharp-wave trough, showing ripple alignment. f, Top: simultaneous recordings from ipsilateral CLA and DVR in an ex vivo preparation. Bottom: cross-correlation between simultaneous recordings in ipsilateral CLA and DVR, showing that CLA precedes DVR by ~100ms. g, Peri-stimulus time histogram for multiunit activity in cortex, in response to ipsilateral CLA activation in an intact ex vivo forebrain. Experiment carried out in normal ACSF at room temperature in the presence of 30µM 5HT to suppress spontaneous SWRs in claustrum and 50µM CCh to raise cortex excitability. Claustrum stimulus: single 50µs electrical pulse, delivered with a bipolar electrode. Cortex multi-unit activity recorded with glass micropipette. h, Change in cortical firing rate (FR) measured in 200-ms-bin-after vs. 200ms-bin-before the CLA stimulus (as in g). Control: as in g. GBZ: gabazine (5 μM), CGP; CGP52432 (GABAB antagonist, 2 μM), n = 4 ex vivo brains from 3 animals each. The control experiment shows that CLA stimulation has an immediate and reliable inhibitory effect on cortex (#: significantly different from baseline, p=0.017, t3=4.8, two-sided paired t-test). The stimulation experiment in GABA blockers shows that CLA stimulation now slightly excites cortex (**: significantly different from control, p=2.0 x 10⁻³, t6=-5.22, two-sided Student’s ttest), suggesting that claustrum projections both activates and inhibits cortical neurons, probably via direct excitatory projections and indirect inhibitory ones through interneurons (see ref. 39 for rodent experiments). Short horizontal lines indicate means.
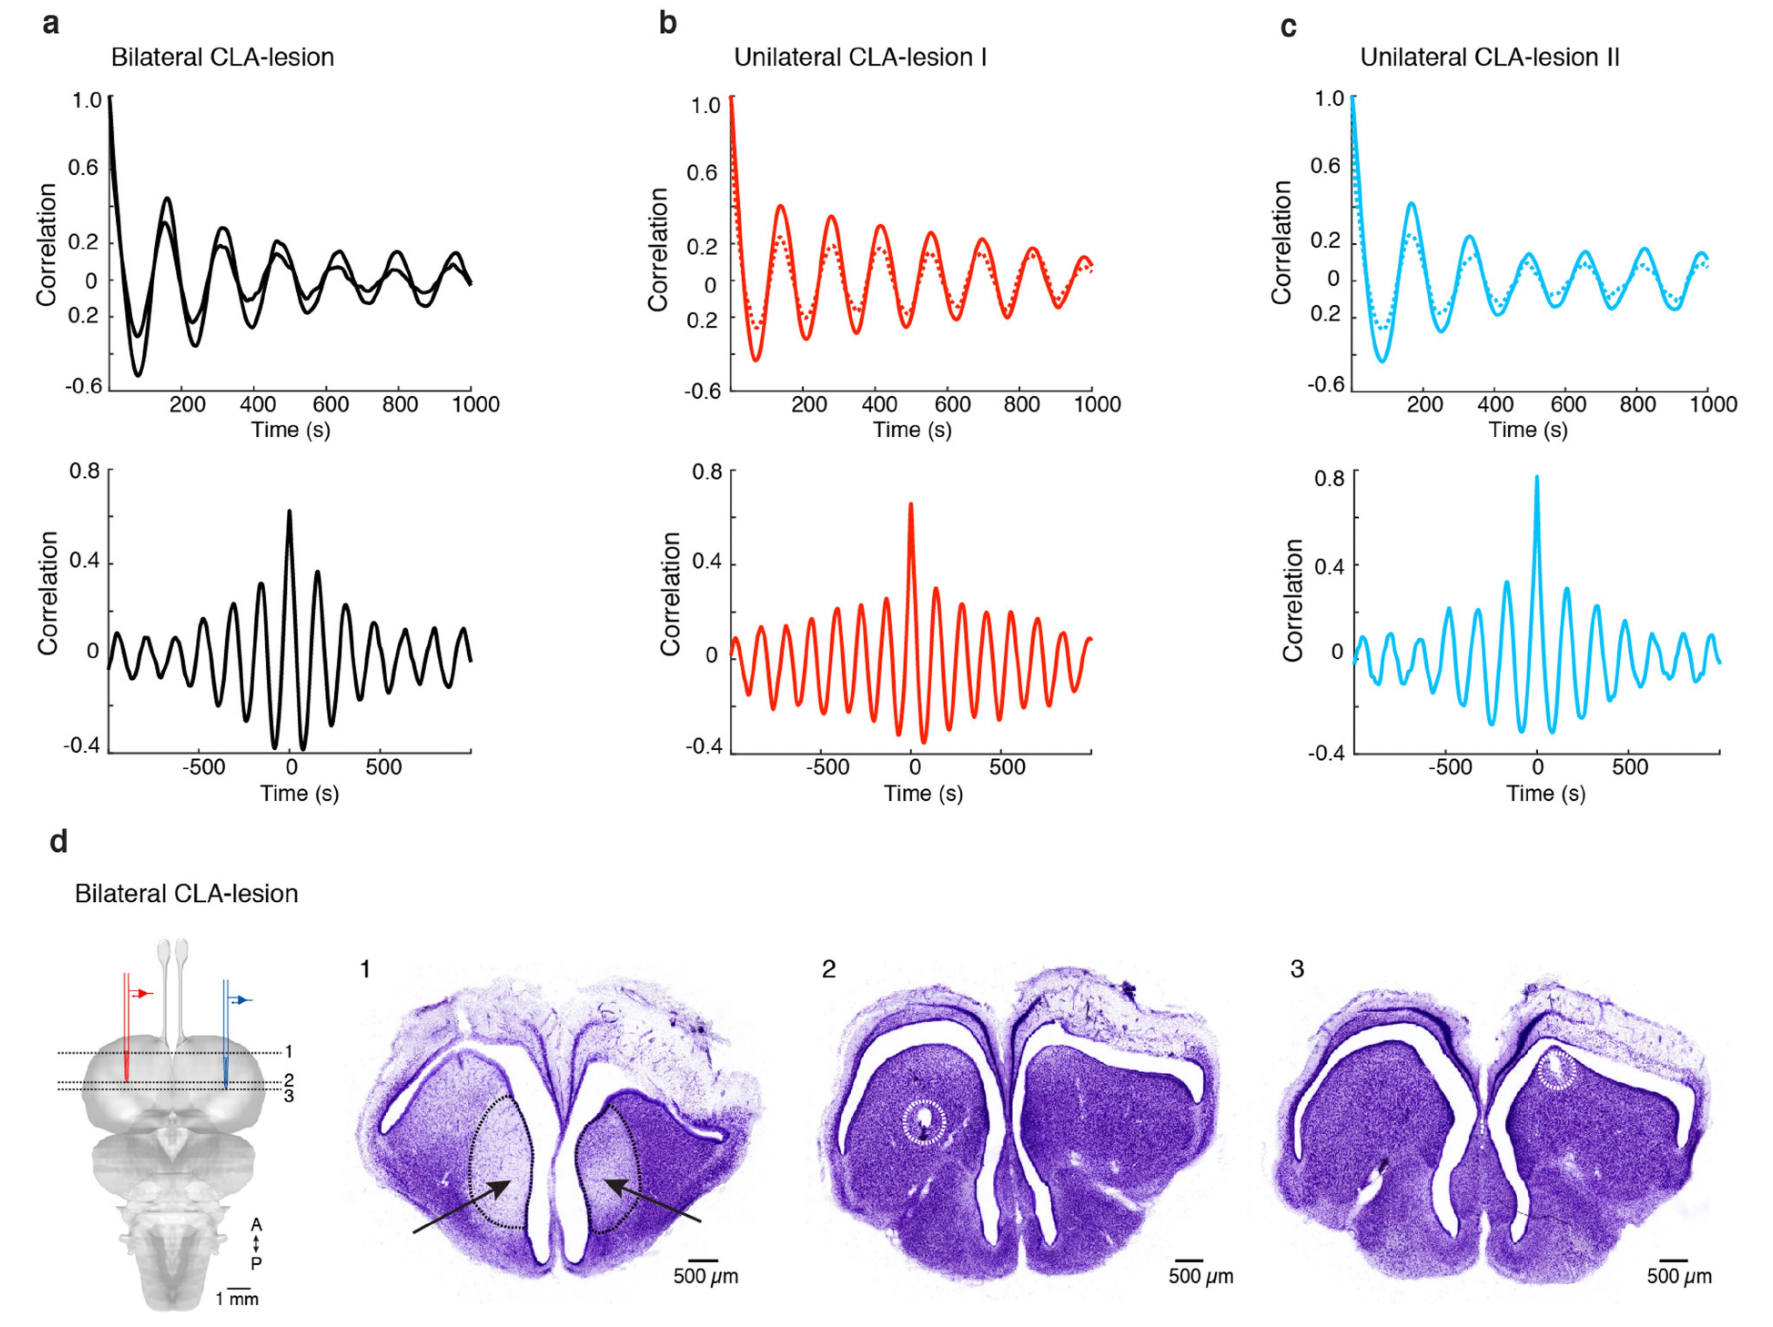
Extended Data Fig. 9 | Further analysis of in vivo ibotenic-acid lesion experiments in sleeping Pogona. a, Autocorrelation (top) and cross-correlation (bottom) of -band activity in L and R DVR during sleep in an animal with bilateral claustrum lesions (see lesions in d). Note that the sleep rhythm (~3-min period) remains after claustrum lesions and therefore does not seem to depend on claustrum integrity. b-c, same as a, but with unilateral ibotenic-acid lesion in two animals (I and II). The non-lesioned (sham) side was injected with the same volume of PBS vehicle but with no ibotenic acid. Top: stippled line: sham; solid line: lesion. d, Nissl stains (1-3) of transverse sections of the brain of bilateral-CLA-lesion animal in a (shown also in Fig. 4b), at levels indicated in schematic at left. Note the claustral lesions (arrows, 1) visible as cell body loss, and the recording sites in L (2) and R (3) DVRs (stippled circles).
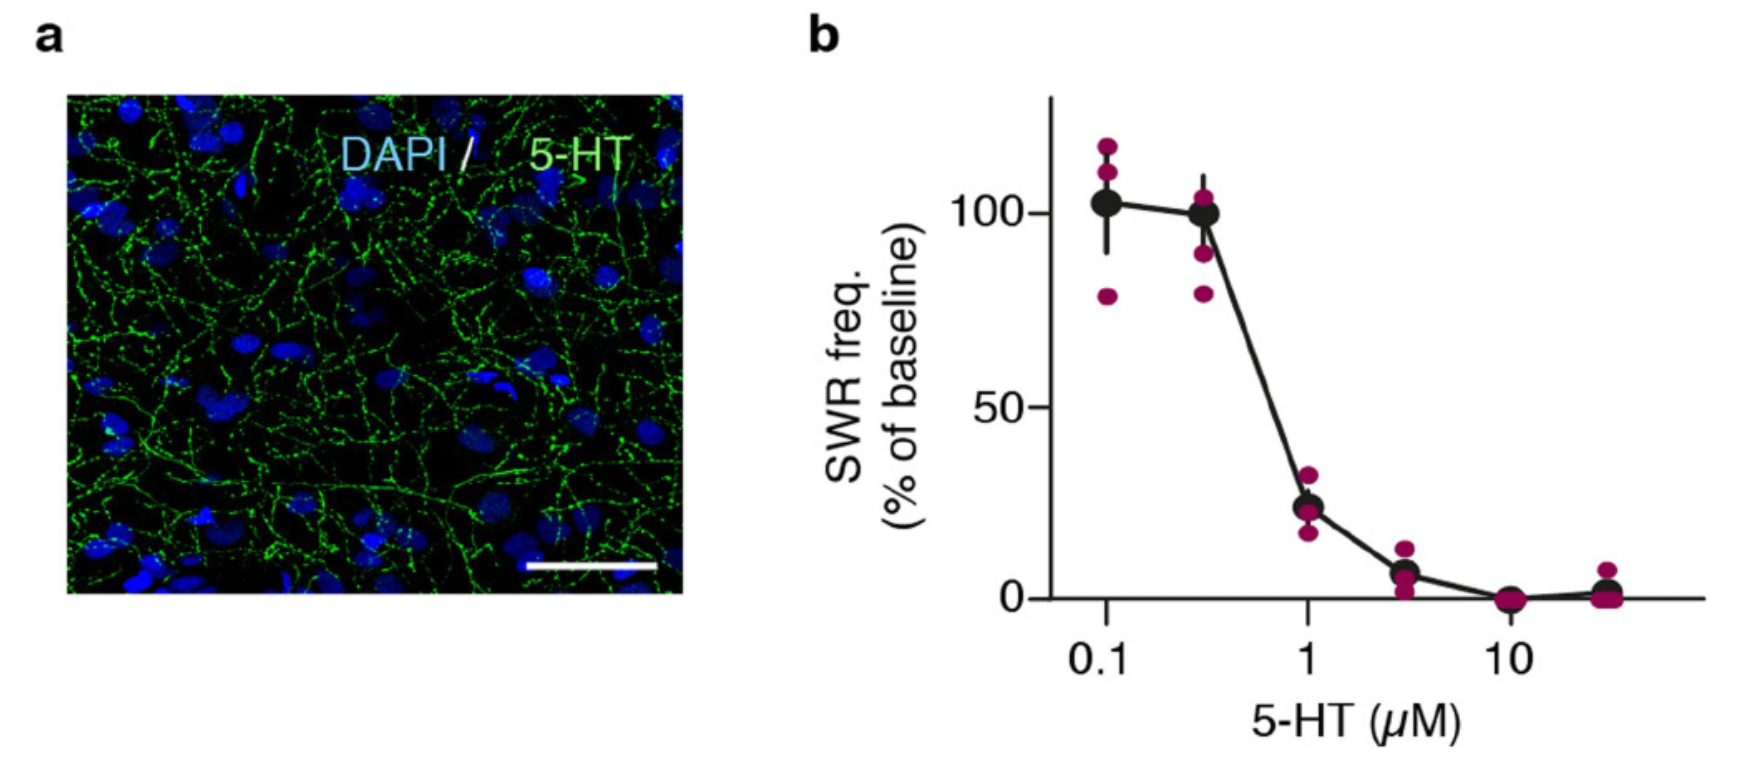
Extended Data Fig. 10 | Further data on 5-HT projections to claustrum and their effects on sharp-wave ripple generation. a, Transverse section of claustrum double-labeled with DAPI (blue, nuclei) and 5HT (axonal fibers) antibodies. Note dense meshwork of serotonergic fibers. Scale bar: 50µm. b, Spontaneous SWR frequency in claustrum mini-slices as a function of superfused 5HT concentration. Red circles, individual experiments (slices). Black: mean and s.e.m.