¶ Targeted antisense oligonucleotide treatment rescues developmental alterations in spinal muscular atrophy organoids
Irene Faravelli 1,15,18, Paola Rinchetti 1,16,18, Monica Tambalo 2,18, Ilisa Simutin 2, Lisa Mapelli 3, Sara Mancinelli 2,4, Matteo Miotto 4, Mafalda Rizzuti 5, Andrea D’Angelo5, Chiara Cordiglieri 6, Giulia Forotti5, Celia Peano7,17, Paolo Kunderfranco8, Luca Calandriello5, Giacomo P. Comi1,5, Elvezia Paraboschi2, Eleonora Pali3, Francesca Beatrice5, Egidio D’Angelo9, Sreer Przedborski 10,11,12,13, Monica Nizzardo 5, Simona Lodato 2,4 & Stefania Corti 1,14
Spinal muscular atrophy (SMA) is a severe neurological disease caused by mutations in the gene, characterized by early onset and degeneration of lower motor neurons. Understanding early neurodevelopmental defects in SMA is crucial for optimizing therapeutic interventions. Using spinal cord and cerebral organoids generated from multiple SMA type 1 male donors, we revealed widespread disease mechanisms beyond motor neuron degeneration. Single-cell transcriptomics uncovered pervasive alterations across neural populations, from progenitors to neurons, demonstrating SMN-dependent dysregulation of neuronal differentiation programs. Multi-electrode array (MEA) analysis identified consistent hyperexcitability in both spinal and brain organoids, establishing altered electrical properties as a central nervous system-wide feature of pathogenesis. Early administration of an optimized antisense oligonucleotide (ASO) that increased SMN levels rescued morphological and functional deficits in spinal cord organoids across different genetic backgrounds. Importantly, this early intervention precisely corrected aberrant splicing in here identified targets enriched at critical nodes of neuronal differentiation. Our findings demonstrate that early developmental defects are core features of SMA pathogenesis that can be prevented by timely therapeutic intervention, providing insights for optimizing treatment strategies.
Spinal muscular atrophy (SMA) is a severe inherited neurological disorder and still one of the leading genetic causes of death in childhood1,2 . SMA is caused by autosomal recessive mutations in , SMN1resulting in reduced expression of full-length SMN protein3 . This leads to progressive degeneration of more vulnerable spinal motor neurons (MNs), causing proximal muscle weakness and atrophy, and early lifethreatening respiratory failure4,5 . SMA phenotypic spectrum is very broad and consists of different clinical forms, from fatal to mild, which are ranked on the base of the motor milestones reached by the patients6 .
The SMN protein is expressed in several fetal tissues, including the brain, spinal cord, skeletal muscle, heart, and kidney; it significantly decreases after birth, suggesting that SMN is particularly important during prenatal life7,8 . Recent data from human SMA autopsies associated abnormal MN axon development in utero with postnatal degeneration in SMA9 . Beyond spinal cord involvement, defects in cognitive function and brain neuropathology have been reported in SMA patients, but only partially documented10. The early events that drive the degeneration as well as their impact on the entire central nervous system (CNS), are still largely unknown: considering presymptomatic factors is key when modeling the disease.
Recently, FDA/EMA approved breakthrough therapeutic strategies to restore the levels of SMN and they are currently in clinical use5,11. These approaches are based on either cDNA replacement of or SMN1the use of antisense oligonucleotides (ASOs) or small molecules to achieve splicing correction of . is a paralog of that produces a truncated and rapidly degraded SMN protein, which can be used as a point of action to restore SMN levels12. These drugs have dramatically changed the clinical prognosis of SMA, and for the fatal to severe SMA type 1, are able to reduce the disease to a chronic condition by halting or preventing motor disability. Although growing clinical data show that approved treatments also provide benefits in the chronic phase, it is emerging that the greatest impact is achieved when patients are treated pre-symptomatically5 . Remaining unmet therapeutic needs are the treatment of patients after symptom onset5 and the elusive understanding of the factors halting treatment efficacy. Critically, even newborns identified through screening show incomplete motor recovery, particularly those with two copies13. SMN2Therefore, a better understanding of SMA mechanisms in prenatal disease stages is pivotal to optimizing current therapeutic approaches with the aim of increasing efficiency, targeting biodistribution, and developing new clinical strategies.
Conventional 2D cultures and animal models can only partially recapitulate the phenotypic and genetic complexity of human MN diseases. CNS 3D human organoids14–16, in contrast, display a high degree of cellular diversity, enabling them to model complex cell–cell interactions, while modeling the patient-specific genetic background.
Here, we leveraged an efficient protocol for the generation of induced pluripotent stem cell (iPSC)-derived spinal cord organoids (SCOs) and unveiled early clinically relevant SMA pathological phenotypes. We detected alterations in progenitors’ behaviour, early neuronal differentiation defects, even before hallmarks of cell death appeared, and identified disease susceptibility for distinct neuronal subtypes, beyond MNs.
A pervasive alteration of the splicing machinery has been involved in several neurodegenerative diseases, and it has been recently postulated for the adult MN disease amyotrophic lateral sclerosis (ALS)¹⁷. SMN protein has a recognized role in the splicing machinery, but the impact of its disruption on developmental processes remains still unexplored. Using SCOs, we identified genes with abnormal splicing in SMA and those rescued by SMN-targeting therapies. This allowed us to study how restoring SMN reshapes the transcriptional landscape in patient-derived SCOs. Interestingly, we found that SMN deficiency disrupts the splicing of key genes involved in neural differentiation, potentially triggering SMA pathogenesis. Our findings demonstrate SMN critical role in neural development and the significance of its restoration in therapeutic strategies.
¶ Results
¶ SMN deficiency impacts progenitors and neurons in the spinal cord
We derived human SCOs from healthy control (CTRL, n=5) and SMA type 1 (n=5) patient-derived iPSCS lines (Supplementary Fig. 1 and Supplementary Data 1). Spinal cord development is a complex process that entails both rostro-caudal specification, mediated by Wnt and retinoic acid (RA), and dorso-ventral patterning, downstream of sonic hedgehog (SHH) signaling¹⁸,¹⁹. Thus, SCOs were cultured in the presence of small molecules acting on these pathways to recapitulate in vitro the spinal cord specification²⁰⁻²² (Fig. 1a). In both CTRL and SMA organoids, the treatment promoted progressive caudal neuralization, as evidenced by the appearance of neuronal progenitors at the early differentiation stage (1 month), marked by the expression of PAX6 and NESTIN (Fig. 1b). This was followed by the appearance of the neuronal markers DCX and MAP2, indicating ongoing neuronal differentiation (Fig. 1b, Supplementary Fig. 2, and Supplementary Data 2 and 3). As the differentiation proceeded, we observed the presence of spinal precursors expressing HOXB4 and OLIG2 along with ISL1- and MNX1-positive MNs (Fig. 1b and Supplementary Fig. 2). At 2 months, we also detected the presence of astroglial cells (Supplementary Fig. 2). Together, the data show that SCOs can recapitulate key aspects of spinal cord neurogenesis.
To explore the early events driving SMA pathogenesis, we analyzed 2-month-old CTRL and SMA SCOs composition by single-cell RNA-seq (C1, C3, S1, and S3 lines, Fig. 1c–e, Supplementary Fig. 3, and Supplementary Data 4). Accounting for technical variability, we sequenced individual SCOs deriving from 2 CTRL and 2 SMA lines (Supplementary Data 1) and successfully profiled a total of 27,114 cells. Module annotation with defined sets of marker genes for dorsal and ventral domains identified different classes of neural progenitors (Prog, ), including floor plate progenitors (pFP, ), difSOX2, SOX9 SHHferentiating neurons (Neuron, ), and subtypes of spinal cord DCXneuronal domains (Fig. 1c–e and Supplementary Fig. 3). At this stage, we could also identify distinct clusters of MN precursors (pMN, ) OLIG2and postmitotic MNs (MN, ) (Fig. 1c–e, Supplementary PHOX2B, ISL1Figs. 3d–g and 4, and Supplementary Data 4). The selective expression of defined combinations of HOX transcripts associated with a posterior neural tube patterning suggested the acquisition of a cervical spinal cord identity (Supplementary Fig. 3d). To benchmark CTRL SCOs against human embryonic and fetal spinal cord development, we used two complementary transcriptomic datasets. The first, a single-cell RNA-seq dataset spanning a broad range of developmental stages23, allowed us to identify the time point most closely resembling our organoids, revealing a strong transcriptional similarity with firsttrimester spinal cord, peaking at gestational week 8 (Supplementary Fig. 3e). The second dataset24, a high-resolution single-cell atlas of the human fetal spinal cord (4–8 gestational weeks), enabled precise mapping of the cellular composition of SCOs. This analysis showed that SCOs closely matched major neural cell classes, including progenitors and neurons, while lacking similarity with mesodermal or endodermal lineages (Supplementary Fig. 3f, g). Together, these findings support the use of SCOs as a robust in vitro model for studying neurological diseases with multicellular involvement, such as SMA.
To investigate whether cell composition and relative contribution of neuronal types are altered in the absence of SMN protein, we performed a differential abundance test using the MiloPy framework25 (Fig. 1f, g). This revealed that specific cell subtypes were differentially represented in SMA organoids, with MNs significantly decreased in SMA genotype.
We further extended our analyses to include pairwise comparisons between individual genotypes/lines in order to evaluate the consistency of our findings across conditions. Except for the C1 vs. S3 comparison, all line-to-line comparisons revealed a significant reduction in MN numbers in SMA relative to CTRL. Considering the inherent variability of the in vitro system, these results nevertheless demonstrate a significant reduction in MN numbers at this stage (Supplementary Fig. 5). Interestingly, in contrast with the reduction of MNs, pMNs were enriched in SMA organoids, as well as other clusters of neural progenitors (Fig. 1f, g). These results support a broader effect on neural diversity in the reduction of SMN, which impacts the proportion of different cell types in the developing organoids.
We therefore investigated the transcriptional changes associated with the lack of SMN in each cluster. To account for the differences in abundance presented in SMA SCOs, we performed differential gene expression analysis in clusters presenting at least 25% of cells of each genotype (Fig. 1h and Supplementary Fig. 6; absolute log fold change ≥ 0.5 and adjusted p-value < 0.05). While the largest proportion of deregulated genes (2031 genes differentially expressed between CTRL and SMA SCOs, 772 upregulated and 1259 downregulated) was observed in cells ascribed to the MN cluster, progenitor cells were the next most affected (Supplementary Data 5). Interestingly, specific genes related to progenitor fitness were downregulated (ASCL1, SOX4), while those involved in the apoptosis signaling were upregulated (Fig. 1i). Gene ontology analysis on progenitors (Fig. 1j) revealed a pervasive effect of the lack of SMN on pathways involved in several developmental processes. Overall, these findings highlight the profound impact of SMN deficiency on the cellular composition and transcriptional landscape of SCOs. While the significant reduction in spinal MNs is a key hallmark of SMA, the altered abundance and transcriptional dysregulation of progenitor cells reveal an equally critical aspect of the disease pathology with a broader disruption in neural development, often disregarded in the investigation of this disease.
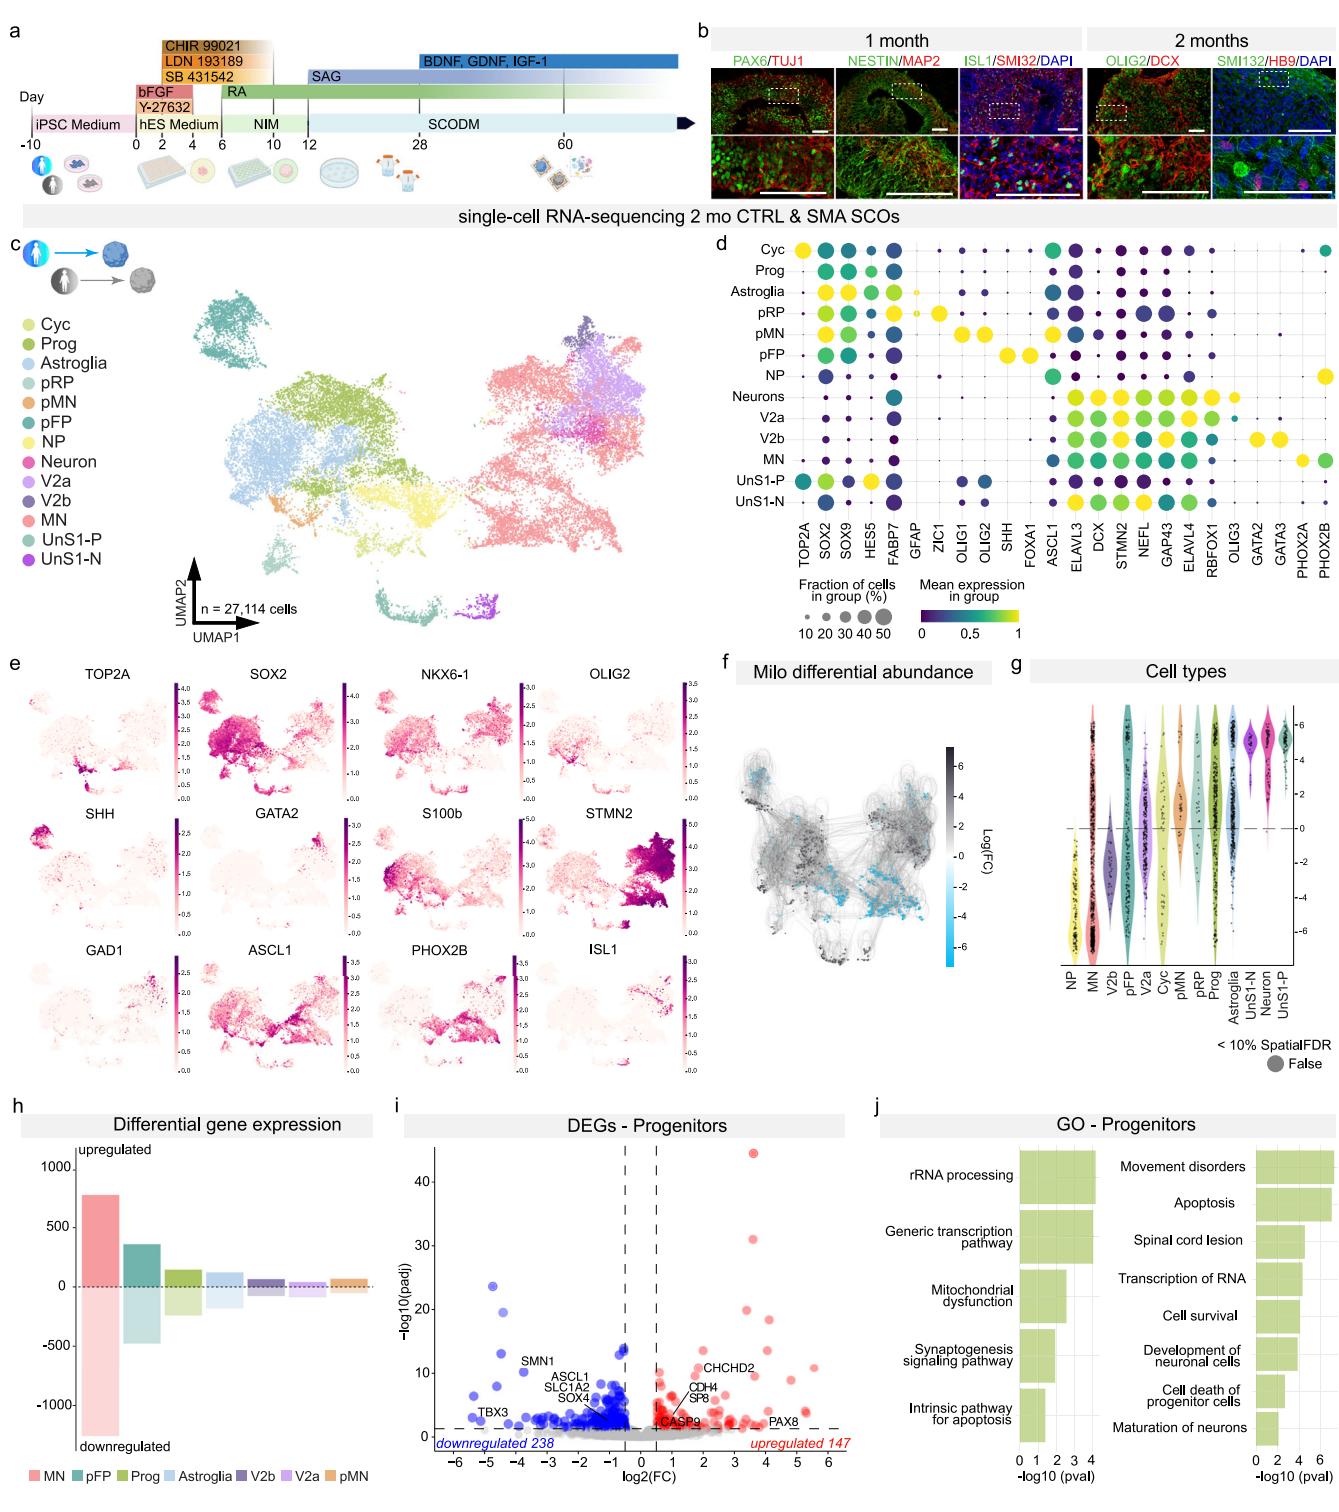
Fig. 1 | CTRL and SMA SCOs display different subtypes of spinal cord cell populations. a Schematics of human SCO generation. Created in BioRender.
Rinchetti, P. (2025) https://BioRender.com/l7ay5hq. b Immunostaining of developmental and neuronal markers in SCOs at 1 and 2 months. SCOs exhibit positive staining for neurodevelopmental markers, including PAX6, NESTIN, and OLIG2 (green), as well as neuronal markers such as ISL1 (green), TUJ1, MAP2, SMI32, and DCX (red). Additionally, motor neurons are indicated by the positive expression of HB9 (red). Nuclei were stained with DAPI (blue). Scale bar: 100 μm. Representative images. Immunostaining was performed independently on at least three different organoids per batch for a minimum of three CTRL and three SMA lines. c CTRL and SMA single cell RNA-sequencing at 2 months (mo) from the C1, C3, S1, and S3 lines. Unsupervised UMAP subdivides SCOs into neural progenitors (cycling cells (Cyc), progenitors (Prog), astroglia, progenitors roof plate (pRP), motor neuron progenitors (pMN), floor plate progenitors (pFP), neurogenic progenitors (NP)), differentiating neuronal cells (Neuron), several subtypes of ventral neurons (V2a, V2b), and motor neurons (MN), and a distinct cluster of unmatched SMA cells, specifically originating from the SMA S1 line (unmatched-S1 progenitors (UnS1-P), unmatched-S1 neurons (UnS1-N)). d Dot plots showing cluster-specific expression of representative genes associated with cell differentiation; dot size corresponds to the percentage of cells in a cluster expressing each gene and the color corresponds to the average expression level (from violet to yellow, low to high). e UMAP feature plots showing the log-normalized counts of selected representative genes for proliferative factors (TOP2A and SOX2), progenitor markers (NKX6-1, OLIG2, SHH, GATA2) and neuronal differentiation markers (STMN2, GAD1, PHOX2B, and ISL1). f Abstracted graph of neighborhoods of the results from Milo differential abundance testing. SMA enrichment in grey and CTRL enrichment in blue. g Violin plot showing the distribution of log-fold changes of differentially abundant neighborhoods assigned to cell type labels. h Numbers of deregulated genes across different clusters. i Volcano plot of differential gene expression (DEG) in progenitor clusters in SMA SCOs relative to CTRL. Values of log2 Fold Change are plotted against −log10 of the q-value for each gene. Red denotes genes upregulated in SMA, while blue denotes genes downregulated in SMA (absolute log fold change ≥ 0.2, min.pct = 0.25 and adjusted q-value < 0.05, thresholds plotted as dashed lines). j Selected Gene Ontology (GO) for upregulated and downregulated genes in the progenitor cluster performed with QIAGEN Ingenuity Pathway Analysis (IPA) software (Fisher test with Benjamini–Hochberg correction).
¶ SMA progenitor defects precede motor neuron impairment
To longitudinally capture the differentiation progression phenotype at the cellular level, we performed high-content image analysis (Fig. 2a–d). Notably, aberrant differentiation trajectories were observed in SMA SCOs. While CTRL SCOs showed a clear reduction in SOX2-expressing neural progenitors and an increase in the postmitotic neuronal marker TUJ1 from 1 to 2 months, SMA SCOs exhibited a less pronounced reduction in SOX2 and no increase in the proportion of TUJ1-positive cells (Fig. 2a–d; percentage of SOX2-positive cells in each organoid at 1 vs. 2 months: CTRL 47.57% ± 11.94 vs. 20.40% ± 13.85, p < 0.0001; SMA 38.79% ± 14.42 vs. 25.44% ± 13.91, p = 0.0148; percentage of TUJ1-positive cells in each organoid at 1 vs. 2 months: CTRL 13.52% ± 4.788 vs. 28.42% ± 12.35, p = 0.0002; SMA 21.49% ± 14.28 vs. 13.84% ± 6.759, p = 0.0764). Accordingly, the SOX2/TUJ1 ratio was significantly higher in the control group at day 30 (p = 0.0444) but showed a marked decrease by day 60, indicating a shift from progenitor cells to differentiated neurons over time, in line with the expected physiological trajectory. However, this pattern was not observed in the SMA condition (Fig. 2e).
Since SCOs recapitulate the early stage of spinal cord development, and our data suggest that the physiological process of cell death could be enhanced in SMA, we longitudinally tested CTRL and SMA SCOs for programmed cell death. SMA SCOs indeed exhibited a difference in apoptosis dynamics in comparison with CTRL SCOs, with a steep enhancement at 2 months (percentage of apoptotic nuclei in each organoid at 1 vs. 2 months: CTRL 11.30% ± 2.512 vs. 7.369% ± 5.125, p = 0.3786; SMA, 4.245% ± 2.372 vs. 23.02% ± 11.34, p < 0.0001; Supplementary Fig. 7a, b). Enrichment analysis of apoptosis-related biological functions, based on differentially expressed genes (DEG) between SMA and CTRL SCOs, revealed that these processes were predominantly upregulated in SMA pMNs and MNs (Supplementary Fig. 7c).
Differences in cell death rate might explain, at least in part, the reduced MN population in SMA SCOs captured by MiloPy (Fig. 1f, g), while the altered cell type composition suggests changes in early developmental programs in SMA tissue.
To examine differences in developmental dynamics from progenitors to neuronal states, we performed pseudotemporal ordering of cells using CytoTRACE, implemented via the CellRank framework (Fig. 2e). This method infers cellular differentiation status based on transcriptional complexity, and importantly, it is agnostic to the choice of root cell, allowing unbiased pseudotemporal ordering without requiring prior assumptions about lineage starting points. In line with in vivo human fetal development24, CTRL organoids displayed a continuous progression from progenitor populations to differentiated neuronal cell types (Fig. 2e, f). In contrast, SMA SCOs displayed a significant global shift toward lower developmental maturity (Kolmogorov–Smirnov (KS) test, p = 2.16e-08) that could also be shown across all genotypes (Supplementary Fig. 9). Cell-type-specific analyses further revealed a robust, statistically significant divergence in the pseudotime score distributions (Fig. 2g).
Altogether, these data support our previous results pointing at an early alteration in SMA neurodevelopment, where cells pause at intermediate developmental states unable to proceed along their maturation, which could, in turn, impact in their ability to survive in the nascent circuits.
¶ SMA motor neuron developmental trajectory is hindered
To investigate gene expression changes during MN differentiation, we partitioned the dataset to focus specifically on MN lineage, including pMNs, early and mature MNs (Fig. 3 and Supplementary Fig. 8). We identified the main categories of somatic MNs, with little to no evidence of a distinct visceral MN population, as visceral markers were either absent or co-expressed with skeletal MN markers (Supplementary Fig. 8b). Using diffusion mapping of the MN lineage subset, we visualized eight distinct transcriptional clusters (Supplementary Fig. 8a) corresponding to three individual MN subtypes based on the expression levels of PHOX2B vs. ISL1/MNX1 (Supplementary Fig. 8b–e). PHOX2B . ISL1/MNX1Despite the overall higher abundance of MN cells in CTRL genotypes (Fig. 1f, g), the MN-1 ISL1⁺/MNX1⁺ subpopulation was preferentially enriched in SMA genotypes.
Next, we explored developmental pathways within the MN partition, allowing us to map the neurogenic progression from pMN to mature MNs (Fig. 3a–c). In CTRL SCOs, the neurogenic trajectory from pMNs to MNs followed the expected sequential progression during differentiation (Fig. 3b, c). A different scenario emerged in the MN differentiation trajectory of SMA SCOs. In contrast to the continuous progression seen in CTRL samples, the differentiation trajectory in SMA appeared polarized. This polarization was characterized by a concentration of cells at the progenitor state at the beginning of the trajectory, an accumulation of cells in an intermediate state, and a notable enrichment of MNs at the end of the trajectory, predominantly within a single branch (Fig. 3c). Importantly, consistent results were obtained when the dataset was analyzed by individual cell lines, suggesting that while the relative abundance of MNs differs among lines, the underlying developmental alteration is a shared feature across all (Supplementary Fig. 9). This suggests that SMN deficiency may disrupt the progressive acquisition of fate along MN differentiation, leading to an imbalance between progenitors and terminally differentiated neurons.
The interplay between specific transcription factors (TFs) is pivotal for the execution of correct developmental programs in the spinal cord26; cell-type-specific TFs represent central hubs in gene regulatory networks and alteration of their expression is associated with downstream defects in cell identity acquisition and maintenance18. To investigate whether the early developmental defects associated with SMA disease were driven by changes in TF activity, we used pySCENIC (Single-Cell Regulatory Network Inference and Clustering) algorithm27 as a tool for the selection of key TFs along the developmental trajectory of CTRL and SMA SCOs organoids(Fig. 3d, e). Interestingly, we found several TFs known to control key aspects of the molecular development of the human spinal cord (i.e., SOX2, SOX9, OLIG2, NKX6-1) expressed along the different states of the SOX2, SOX9, OLIG2, NKX6-1trajectories in SMA and CTRL SCO (Fig. 3d, e), suggesting important variations in the activity of transcriptional programs among cell states in absence of SMN. Histone modifiers and regulators of chromatin architecture were also identified (CHD2, HDAC2, KDM5A), which could be important determinants in human spinal cord development and could impact SMA disease course.
To determine whether the developmental TF expression implied differential gene regulatory programs, we calculated regulon activity. We observed that shared regulons of TFs key for MN differentiation (e.g., ) had shifted profile of activity in SMA, with a SOX2, PHOX2B, CHD2sustained activity of - transcriptional programs, which is associated with the prolonged maintenance of progenitor states (Fig. 3d, e). Together, these analyses support the idea that, not only SMA SCOs fail to properly differentiate into mature MNs, but also show that the neuronal developmental trajectory, with the associated transcriptional regulations, is strongly altered from the early progenitor state. This might impinge on MN survival as well as influence the overall spinal cord neuronal differentiation.
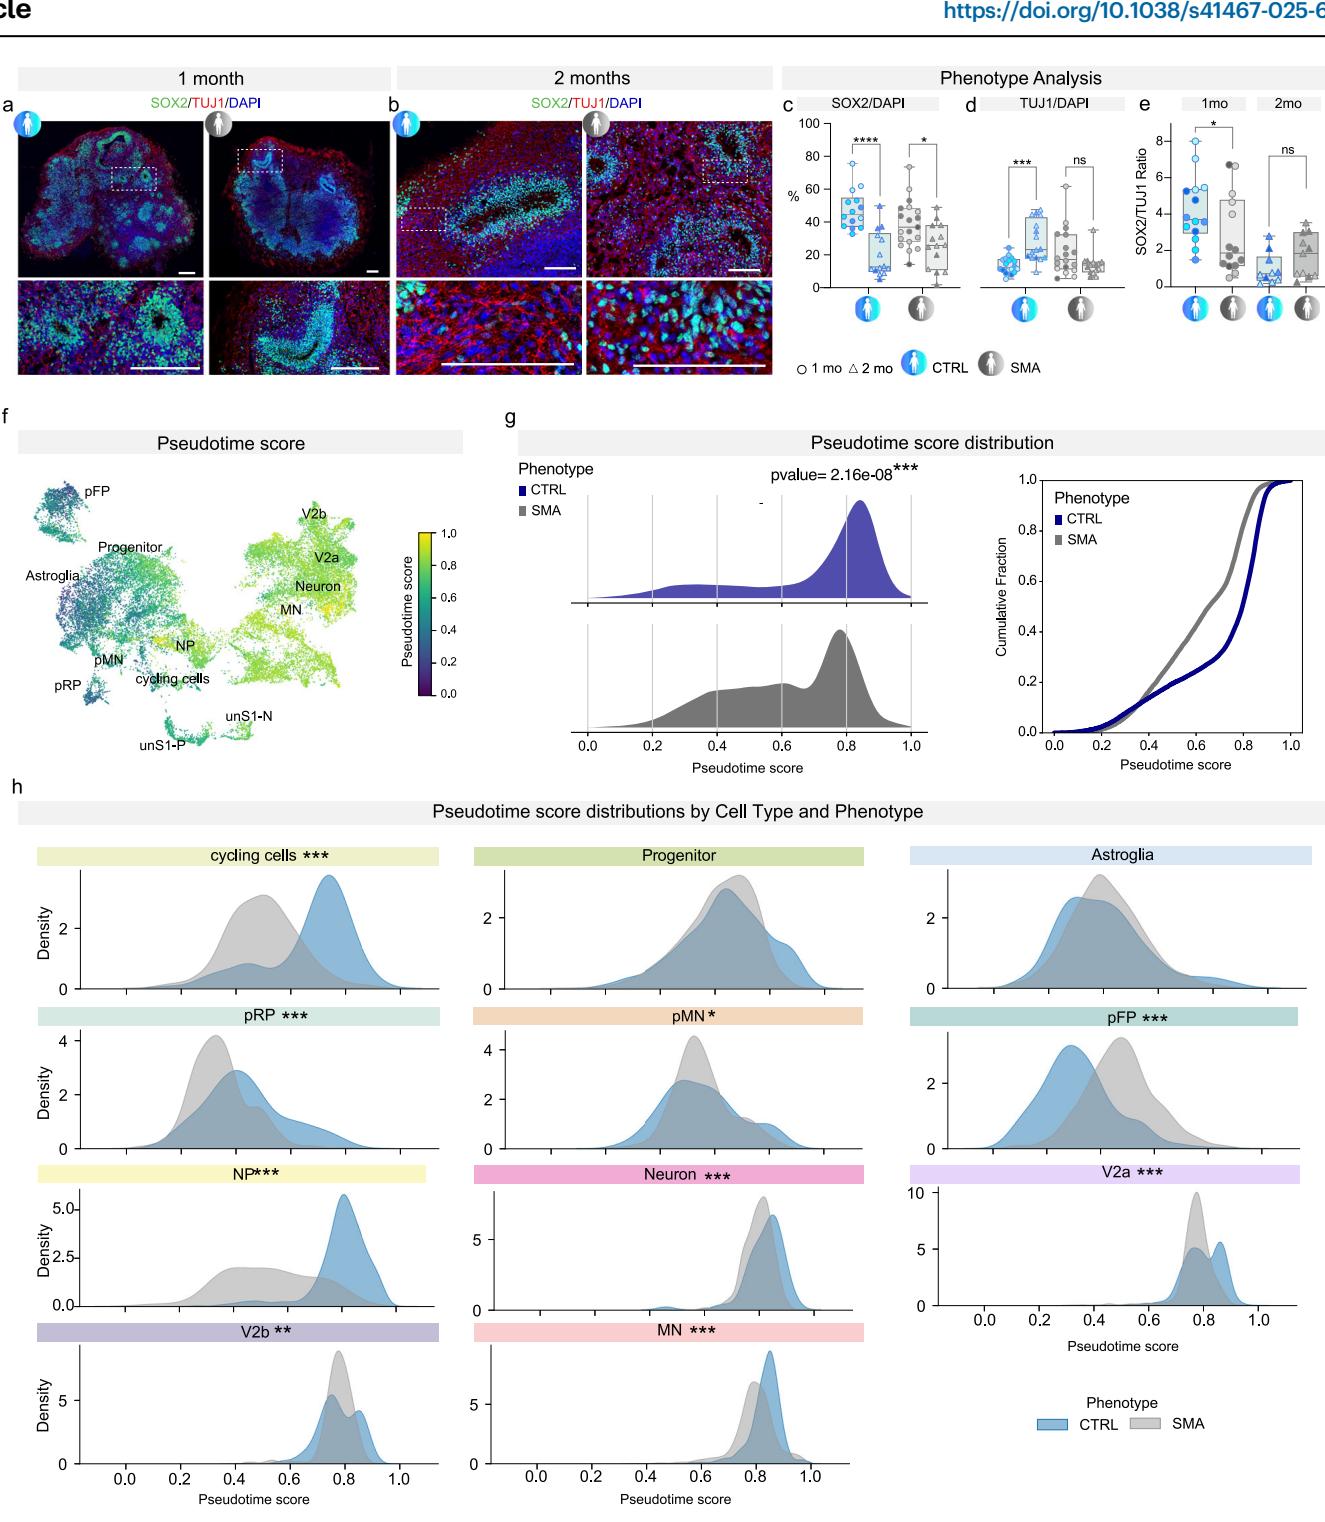
Fig. 2 | Neurodevelopmental disease signatures of SMA SCOs. a, b Representative images of SOX2 (green) and TUJ1 (red) staining at 1 and 2 mo in CTRL and SMA SCOs. Scale bar: 200 μm. Nuclei were stained with DAPI (blue). c Quantification of SOX2-positive cells (as a percentage of cells revealed by DAPI staining) at 1 (circles) and 2 mo (triangles) (two-way ANOVA, Sidak’s multiple comparisons test: p < 0.0001 and p = 0.0148 for CTRL and SMA, respectively. n = 28 from D30 and D60 CTRL SCOs: n = 4 C1, n = 4 C2, n = 3 C4, n = 3 C5; n = 8 C1, n = 3 C4, n = 3 C5; n = 33 from D30 and D60 SMA SCOs: n = 4 S1, n = 7 S2, n = 6 S4, n = 2 S5; n = 5 S2, n = 4 S3, n = 5 S4). Box plots show the minimum and maximum values in the series along with the median and 25th–75th percentiles. d Expression of TUJ1 increases over time in CTRL, while in SMA SCOs there is a trend of decrease in the expression of TUJ1 (two-way ANOVA, Sidak’s multiple comparisons test: p = 0.0002 and p = 0.0764 for CTRL and SMA, respectively. n = 33 from D30 and D60 CTRL SCOs: n = 4 C1, n = 5 C2, n = 3 C3, n = 3 C4, n = 3 C5; n = 4 C1, n = 3 C2, n = 3 C3, n = 3 C4, n = 2 C5; n = 33 from D30 and D60 SMA SCOs: n = 4 S1, n = 2 S2, n = 4 S3, n = 6 S4, n = 2 S5; n = 4 S1, n = 3 S2, n = 3 S3, n = 5 S4). e Stacked bar plot showing the ratio of SOX2 and TUJ1 at 1 mo and 2 mo in CTRL and SMA SCOs (Mann–Whitney test: p = 0.0444 and p = 0.1734 for CTRL vs. SMA at 1 mo and 2 mo, respectively. n = 24 from D30 and D60 CTRL SCOs: n = 4 C1, n = 4 C2, n = 3 C4, n = 3 C5; n = 5 C1, n = 3 C4, n = 2 C5; n = 25 from 1 mo and 2 mo SMA SCOs: n = 4 S1, n = 2 S2, n = 6 S4, n = 2 S5; n = 3 S2, n = 3 S3, n = 5 S4). f UMAP plot showing cells colored by pseudotime score, with label annotation of major cell types. g Left: Density plots of pseudotime score distributions in CTRL (blue) and SMA (gray) cells (two-sided Kolmogorov–Smirnov (KS) test, p = 2.16e-08). Right: Cumulative distribution plot of pseudotime scores in CTRL and SMA cells. h Density plots of pseudotime scores for individual cell types, comparing CTRL (blue) and SMA (gray). Significant differences in pseudotime distributions were assessed using the two-sided KS test. Asterisks indicate significance levels: *p < 0.05, **p < 0.01, ***p < 0.001, ****p < 0.0001. Source data are provided as a Source Data file.
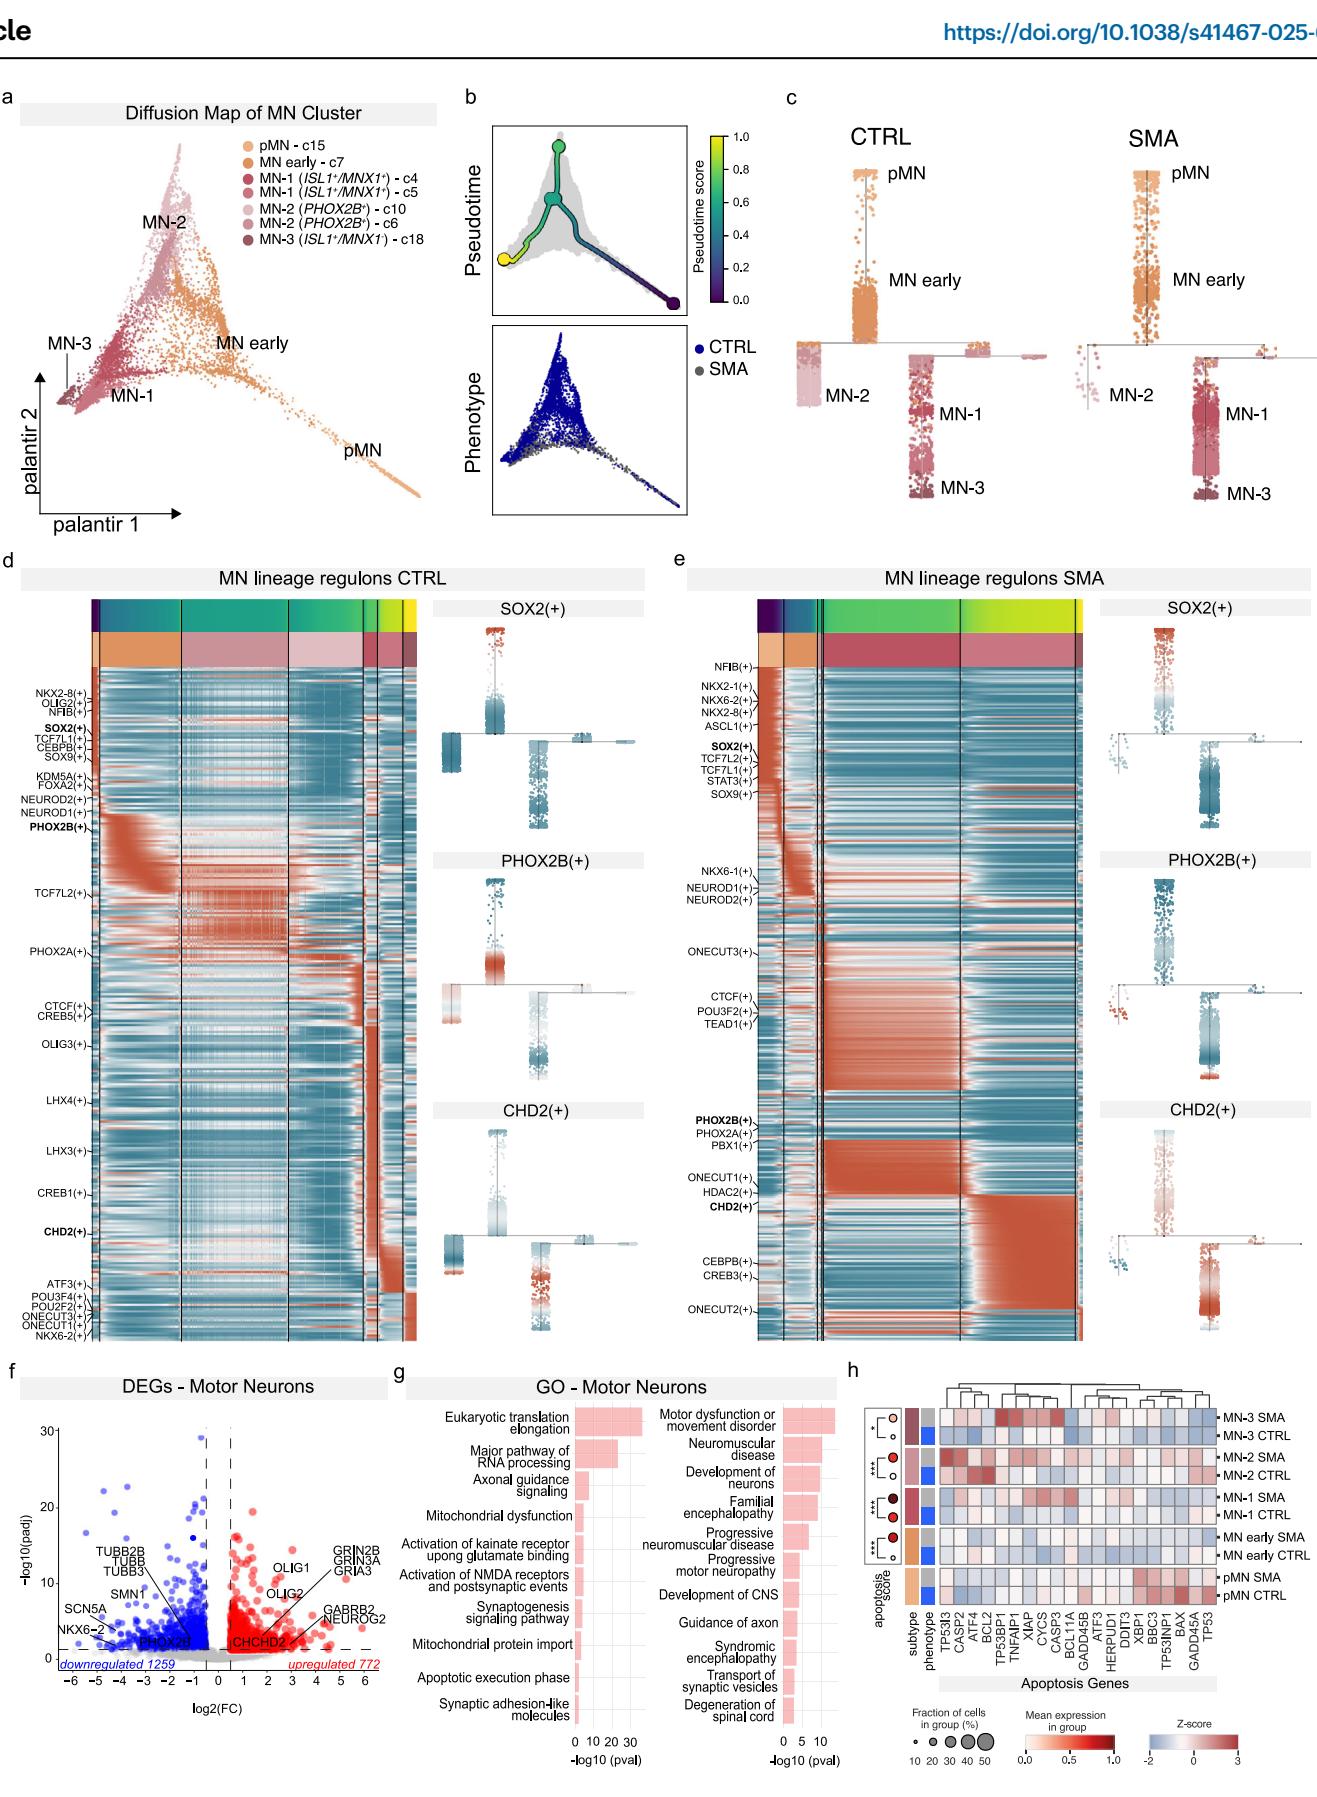
Fig. 3 | SMA SCOs show molecular signatures of disease. a Diffusion map (DM) of MN clusters colored by subcluster identity. b Top: DM colored by pseudotime score. Bottom: DM colored by sample phenotype (CTRL, SMA). c Projection of MNs onto the pseudotime trajectory for CTRL and SMA samples. Cells are colored by subcluster identity to show distribution along the trajectory. d, e Heatmap displaying regulon activity trends and pseudotime associated with the CTRL (d) and SMA (e) trajectories, binned by each subcluster identity. Regulon activity scores of SOX2, PHOX2B, and CHD2 in CTRL and SMA samples. High level of regulon’s activity in red and low level in blue. f Volcano plot of differential gene expression (DEG) in MN clusters in SMA SCOs relative to CTRL. Values of log2 Fold Change are plotted against −log10 of the q-value for each gene. Red denotes genes upregulated in SMA, while blue denotes genes downregulated in SMA (absolute log fold change ≥ 0.2, min.pct = 0.25 and adjusted q-value < 0.05, thresholds plotted as dashed lines). g Selected Gene Ontology (GO) for upregulated and downregulated genes in motor neurons performed with QIAGEN Ingenuity Pathway Analysis (IPA) software (Fisher test with Benjamini–Hochberg correction). h Left: Dot plot showing expression of apoptosis module scores. Right: Heatmap of apoptosis-related gene expression across MN subclusters and phenotypes.
We then looked at the transcriptional landscape of SMA vs. CTRL MNs (Fig. 3f, g). SMA MNs showed downregulation of genes involved in neuronal growth and synaptic maturation (TUBB3, TUBB, SCN5A). Notably, a small subset of genes showed consistent deregulation in virtually all cell types in SMA SCOs (Supplementary Data 5). They included CHCHD2, a mitochondrial protein involved in oxidative phosphorylation, and whose upregulation was previously shown in other neurodegenerative conditions to be serving a compensatory protective response against oxidative stress²⁸,²⁹. Interestingly, CHCHD2 has been shown to be subjected to alternative splicing. We validated by qPCR that this gene reproducibly displayed the same trend of deregulation across individual SCOs derived from two independent lines of CTRL and SMA (Supplementary Fig. 10a), while no difference was observed in multiple lines of undifferentiated SMA iPSCs (Supplementary Fig. 10b). Overall, SMA SCOs exhibit a disease-associated molecular signature across various MN maturation states, leading to global alterations in multiple molecular programs. Gene ontology analysis defined enriched categories related to metabolic processes, stress response and spinal cord disorders (Fig. 3g). Indeed, a significant reduction in neural projections (identified with staining for the heavy neurofilament NEF-H/SMI32, a marker gene enriched in MNs) was detected in SMA neurons derived from dissociated SCOs (CTRL 59.17 ± 12.30 μm vs. SMA 34.62 ± 8.34 μm, p < 0.0001; Supplementary Fig. 8f, g). Finally, we examined molecular programs associated with cell death by calculating module scores for apoptosis in each MN partition in CTRL vs. SMA conditions (Fig. 3h). We found a significant enrichment of cell death–related molecular programs in SMA MNs across all subgroups. This indicates that, although some MN subtypes are more represented in SMA at this time point, they not only exhibit dysregulation of developmental trajectories but have also already initiated degenerative cascades associated with MN loss.
Pathological patterns of activity in SMA spinal cord organoids Modifications in the electrophysiological activity of spinal MNs have previously been reported in 2D cultures³⁰ and pre-symptomatic mouse models of SMA³¹. As in other motor degenerative disorders³², this abnormal activity might contribute to the SMA human disease phenotype. However, it is not clear how early in disease progression this dysfunction occurs and how it varies across CNS compartments. We exploited high-density multi-electrode array (HD-MEA) technology to investigate the functionality of SCOs derived from SMA patients (Fig. 4a–c). Basal recordings of 2-month-old CTRL and SMA SCOs showed spontaneous spiking activity, with significantly lower frequencies in SMA SCOs (CTRL 1.956 ± 0.5354 Hz vs. SMA 1.355 ± 0.6807 Hz, p = 0.0127; Fig. 4b, c). Moreover, SMA SCOs significantly increased their firing frequency more than CTRL SCOs after a glutamatergic stimulus, suggesting an early dysfunction with features of hyperexcitability (CTRL 44.06% ± 20.03 vs. SMA 91.03% ± 28.42, p < 0.0001; Fig. 4b, c).
Notably, DEG analyses revealed, across different clusters, the presence of a set of deregulated genes related to synaptic channels among different neuronal populations, suggesting an overall impact on synaptic function (Supplementary Fig. 11a). To rule out changes in GABAergic transmission, we tested spontaneous firing frequency upon application, at the basal level, of gabazine and strychnine³³ to block GABA-A and glycine receptors. As expected, an increased spontaneous firing frequency was observed in CTRL organoids (CTRL 44.21% ± 5.626) and a similar behaviour was detected in SMA SCOs (SMA 43.75% ± 16.4, p = 0.9521; Supplementary Fig. 11b–d). This response suggested the presence of active mechanisms of neuronal inhibition in the organoid circuits (CTRL 43.71% ± 36.38 vs. SMA 35.72% ± 19.11, p = 0.5455). GAD65 staining confirmed the presence of inhibitory interneurons in both CTRL and SMA SCOs (Supplementary Fig. 11b lower panel), as also highlighted by single-cell molecular data. These results support the hypothesis that the observed hyperexcitability response of SMA organoids to glutamate does not imply a reduced inhibitory transmission, and it is more likely to be ascribed to alterations in glutamatergic transmission maturation.
Overall, we showed that SCOs display basal firing activity with the potential to respond to an exogenous stimulus and they generate functional circuits. Furthermore, SMA SCOs possess distinct electrophysiological properties, including increased glutamate sensitivity, that can potentially lead to hyperexcitability, a common trait of many neurodegenerative disorders.
¶ Pathological patterns of activity in SMA cerebral organoids
SMA has traditionally been considered a lower MN disease; nonetheless, cerebral involvement has been reported in the most severe SMA cases¹⁰. It is still debatable whether this feature is directly linked to SMA pathogenesis, or it is indirectly associated with spinal degeneration retrogradely spreading to the brain. To begin exploring these alternatives, we employed an adapted protocol for generating 3D cerebral organoids¹⁴ from SMA and healthy iPSC lines (Fig. 4d, e and Supplementary Fig. 12), where a putative secondary effect of spinal cord degeneration was excluded. Both CTRL and SMA cerebral organoids displayed complex morphology, with heterogeneous regions containing neural progenitors (SOX2+), mainly localized within neural rosettes, and neurons (TUJ1+; Fig. 4f). We quantified the number of SOX2-positive progenitors across CTRL and SMA brain organoids at both the RNA and protein levels and did not detect a significant difference at the 2-month time point (CTRL 57.45 ± 19.10 vs. SMA 67.02 ± 11.54, p = 0.2449; Fig. 4g). In parallel, we did not detect any significant difference for the expression of NEF-H/SMI32 (Supplementary Fig. 12c). Staining for glial populations (GFAP+) , cortical neurons (CTIP2+ and SATB2+) and general neuronal markers (DCX and MAP2) at 2 months revealed the presence of a variety of cell types (Supplementary Fig. 12a, b). As for SCOs, brain differentiation can take place from SMA reprogrammed pluripotent cells and cerebral organoids are able to recapitulate key early steps of brain development.
Interestingly, cerebral organoids displayed abnormal electrophysiological activity like that seen in SMA SCOs. HD-MEA analysis (Fig. 4h, i) revealed that SMA cerebral organoids had a significantly lower basal spike frequency compared to CTRLs (2.206 ± 0.6826 Hz CTRL vs. 0.8497 ± 0.1629 Hz SMA, p < 0.0001; Fig. 4i). Consistent with the SCOs response observed after glutamatergic stimulation, SMA cerebral organoids increased their firing frequency by a significantly higher factor than CTRL organoids (115.3% ± 36.20 SMA vs. 39.11% ± 13.21 CTRL, p < 0.0001; Fig. 4i). Moreover, the presence of an active inhibitory neuronal circuit exploiting GABA-A (and likely glycine) receptors was detected (Supplementary Fig. 12d, e). Our results thus show pathological features in SMA cerebral organoids, demonstrating direct involvement of the disease in the CNS, beyond the spinal cord, and revealing the need to consider additional targets in the clinical therapeutic setting to evaluate the efficacy and the long-term response to treatments.
¶ Optimized SMN-targeted approach effectively restores cellular and functional alterations
Among the approved therapies for SMA¹², nusinersen is based on an antisense oligonucleotide (ASO) acting on SMN2 (ASO_10-27), increasing the overall levels of SMN protein. To determine if SMA SCOs are a suitable model for testing the effectiveness of potential therapies, and whether increasing SMN protein levels can correct specific molecular disease signatures, we tested a recently validated ASO for SMN2 with optimized morpholino chemistry (MO-10-34³⁴,³⁵) conjugated with an arginine-rich cell-penetrating peptide (r6-MO). We recently demonstrated that r6-MO can increase drug biodistribution and efficacy in animal models³⁶.
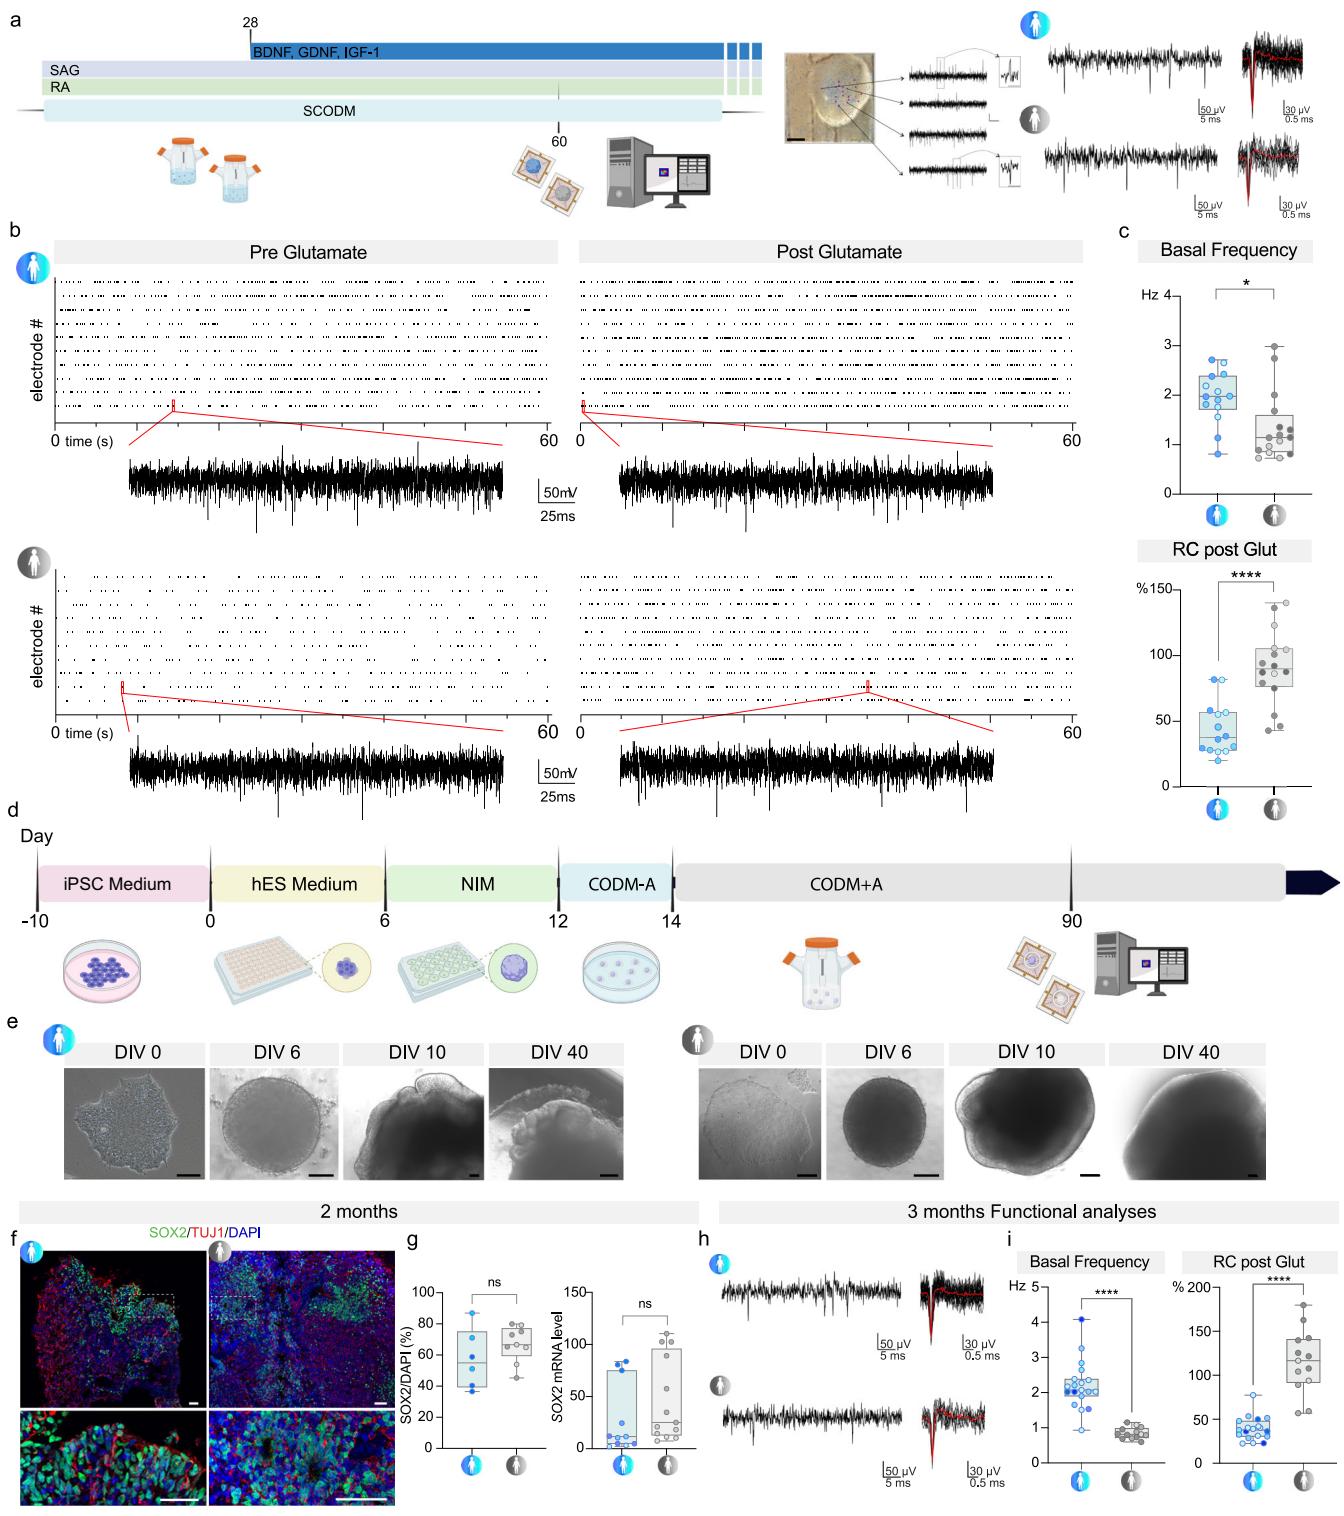
Fig. 4 | SMA SCOs and cerebral organoids (CrOs) show alterations to electrophysiological activity with features of hyperexcitability. a Schematic of MEA analysis time-line and representative image of SCO on HD-MEA chip with recorded traces showing basal activity. Scale bar: 500 μm. Elements of the schematic created in BioRender. Rinchetti, P. (2025) https://BioRender.com/0o9jsh1. b Raster plot of CTRL and SMA SCOs pre- and post-glutamate. c Top: Quantification of basal firing activity in CTRL vs. SMA SCOs (unpaired t-test, p = 0.0124, n = 29 organoids from n = 5 C1, n = 4 C3, n = 5 C4; n = 1 S1, n = 4 S2, n = 7 S4, n = 4 S5). Bottom: Relative change (RC) in firing frequency increase after glutamate (glut) perfusion in CTRL vs. SMA SCOs (unpaired t-test, p < 0.0001, n = 30 organoids from n = 5 C1, n = 4 C3, n = 5 C4; n = 1 S1, n = 4 S2, n = 7 S4, n = 4 S5). Box plots show the minimum and maximum values in the series along with the median and 25th–75th percentiles. d Schematic of human CrOs generation. Created in BioRender. Rinchetti, P. (2025) https://BioRender.com/33yw3mr. e Representative bright-field images of the progression of the differentiation pathway for CTRL and SMA CrOs. Scale bar = 100 μm. f Representative images of SOX2 (green) and TUJ1 (red) staining at 2 mo in CTRL and SMA CrOs. Scale bar: 200 μm. Nuclei were stained with DAPI (blue). g Left: Quantification of SOX2 as a percentage of positive nuclei and analysis of mRNA level in CrOs at 2 months. In both analyses the expression of SOX2 does not differ in CTRL and SMA CrOs (Left graph: unpaired t-test, p = 0.2449; n = 15 organoids from n = 3 C3, n = 3 C5; n = 5 S1, n = 4 S3). Right graph: unpaired t-test, p = 0.2524; n = 24 organoids: n = 2 C1, n = 2 C3, n = 1 C4, n = 3 C5, n = 3 C6; n = 3 S1, n = 3 S2, n = 7 S3). Box plots show the minimum and maximum values in the series along with the median and 25th–75th percentiles. h Representative traces of basal recording of CTRL and SMA CrOs (3 mo). i Left: Basal firing frequency was lower in SMA CrOs than in CTRL (unpaired t-test, p < 0.0001, n = 32 organoids from n = 8 C1, n = 3 C2, n = 4 C3, n = 4 C6; n = 2 S1, n = 5 S3, n = 6 S4). Right: The relative increase in firing frequency after glutamate (glut) perfusion was greater in SMA than in CTRL CrOs (unpaired t-test, p < 0.0001, n = 32 organoids from n = 8 C1, n = 3 C2, n = 4 C3, n = 4 C6; n = 2 S1, n = 5 S3, n = 6 S4). Box plots show the minimum and maximum values in the series along with the median and 25th–75th percentiles. Source data are provided as a Source Data file.
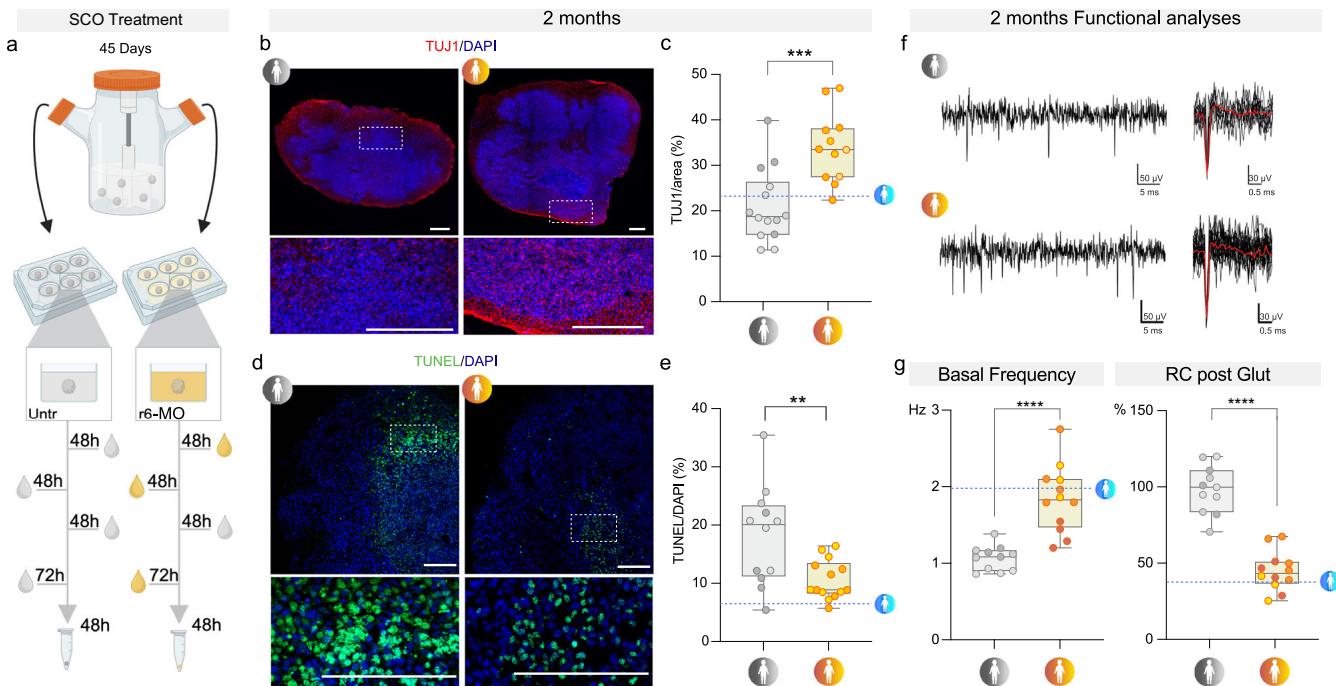
Fig. 5 | SMA organoids display specific cellular features that are rescued by r6-morpholino. a Schematic representation of r6-morpholino (r6-MO) treatment. SMA SCOs were treated three times for 48 h: T1, T2 48 h later, T3 72 h after the media was changed without the compound. Created in BioRender. Rinchetti, P. (2025) https://BioRender.com/cd9gra2. b Representative images of TUJ1 staining of Untr and r6-MO-treated SMA SCOs at 2 mo. Scale bar: 300 μm. Nuclei were stained with DAPI (blue). c TUJ1 expression (intensity/area) is greater in r6-MO-treated SCOs than in untreated SCOs (unpaired t-test, p = 0.0003, n = 26 organoids from untreated: n = 7 S1, n = 3 S2, n = 4 S3; treated: n = 7 S1, n = 3 S2, n = 2 S3). Box plots show the minimum and maximum values in the series along with the median and 25th–75th percentiles. d Representative images of TUNEL staining of Untr and r6-MO-treated SMA SCOs at 2 mo. Scale bar: 300 μm. Nuclei were stained with DAPI (blue). TUNEL-positive cells were less frequent in r6-MO-treated SCOs than in Untr SCOs (unpaired t-test, p = 0.0050, n = 26 organoids from untreated: n = 4 S1, n = 3 S2, n = 5 S3; treated: n = 4 S1, n = 3 S2, n = 7 S3). Box plots show the minimum and maximum values in the series along with the median and 25th–75th percentiles. f Representative traces of basal recording of Untr and r6-MO-treated SMA SCOs at 2 mo. g Left panel: Quantification of basal firing activity in Untr vs. r6-MO-treated SCOs (unpaired t-test, p < 0.0001, n = 23 organoids from untreated: n = 4 S1, n = 4 S2, n = 3 S3; treated: n = 4 S1, n = 5 S2, n = 3 S3). Right panel: Relative change (RC) in the firing frequency decrease in r6-MO-treated SCOs compared to Untr after glutamate perfusion (glut) (unpaired t-test, p < 0.0001, n = 23 organoids from untreated: n = 4 S1, n = 4 S2, n = 3 S3; treated: n = 4 S1, n = 5 S2, n = 3 S3). Box plots show the minimum and maximum values in the series along with the median and 25th–75th percentiles. Source data are provided as a Source Data file.
First, we investigated whether unconjugated MO-10-34 and the r6-MO could increase SMN protein levels in SMA SCOs. SMA SCOs were treated at day 45 with either unconjugated (bare) MO or r6-MO (2.4 nmoles), or their respective custom-made scrambled sequences, for 48 h. This treatment was repeated three times with increasing doses (up to 4.8 nmoles) (Fig. 5a and Supplementary Fig. 13a). SMN reduction is a hallmark of SMA pathology (Supplementary Fig. 13b). We therefore first assessed whether our treatment could increase both SMN protein and mRNA levels. A significant increase in SMN protein expression was observed in lysates from r6-MO-treated organoids compared to untreated controls at later time points (Supplementary Fig. 13c). Biotin-tagged r6-MO was detected both at the periphery and within the central core of the organoids (Supplementary Fig. 13d), indicating effective and widespread tissue distribution. Consistent with this, treatment with either r6-MO or MO-10-34 (bare morpholino) led to a significant upregulation of SMN mRNA levels compared to their respective scramble controls across all treated lines (S1, S2, and S3) (Supplementary Fig. 13e, f). To specifically examine the expression of SMN1 and SMN2 isoforms, we performed restriction fragment length polymorphism (RFLP) analysis in CTRL, untreated SMA, scramble-treated SMA, and r6-MO-treated SMA lines. This analysis confirmed that r6-MO treatment significantly reduced the levels of the truncated SMN2 Δ7 isoform in favor of the full-length SMN2 transcript (Supplementary Fig. 13g).
Notably, the differentiation phenotype was completely restored by r6-MO treatment (percentage of cells positive for TUJ1: SMA 20.99% ± 8.044 vs. r6-MO 33.93% ± 7.648, p = 0.0003; Fig. 5b, c). The administration of r6-MO at day 45 was also able to significantly prevent cell death (percentage of apoptotic nuclei in each organoid at 2 months: untreated 18.16% ± 8.443 vs. r6-MO 10.58% ± 3.37, p = 0.005; Fig. 5d, e), supporting the idea that early intervention could halt the aberrant cellular processes, positively changing the course of the disease.
Strikingly, at the functional level, treatment with r6-MO resulted in enhanced basal activity compared to untreated SMA SCOs (r6-MO 1.843 ± 0.4396 Hz vs. untreated 1.067 ± 0.1623 Hz, p < 0.0001; Fig. 5f, g), which was paralleled by a reduced response to the glutamatergic stimulus (percentage increase in frequency: r6-MO 44.76% ± 12.81% vs. untreated 98.31% ± 15.56%, p < 0.0001; Fig. 5f, g).
These findings reveal that fundamental cellular and functional phenotypes could be rescued by an early specific SMN-increasing therapy across multiple genetic backgrounds. Taken together, these data provide insights into the value of optimized ASOs and their impacts on the early treatment of SMA pathology.
¶ SMA splicing defects are rescued by SMN-increasing therapy
Disease-modifying therapies are currently changing the natural history of SMA, but the specific molecular pathways affected by SMN-targeted approaches and what is their impact on the different cell types along the developmental trajectory are not fully elucidated. We leveraged our platform to dissect the molecular drivers responsible for the rescue in the cellular and functional phenotypes. The SMN protein has a well-recognized crucial role in the splicing machinery³⁷. Thus, by RNA deep-sequencing, we investigated changes in splicing events in SMA SCOs, and assessed the splicing modifications induced by the MO treatment. We analyzed CTRL (n = 3 lines, 3 individual replicates), SMA (n = 2 lines, 4 individual replicates), and SMA-treated SCOs (n = 2 lines, 4 individual replicates) after a two-month differentiation period, following treatment with r6-MO and r6-scrambled-MO as negative control (Supplementary Fig. 14).
In SMA vs. CTRL SCOs, an overall transcriptional alteration was confirmed with 666 genes upregulated and 463 genes downregulated (Supplementary Fig. 14a and Supplementary Data 6). GO analyses revealed enrichment for progressive encephalopathy disorder, while showing downregulation for synaptogenesis and glutamate receptor signaling (Supplementary Fig. 14b). These findings correlate with the alterations in functional activity displayed by SMA SCOs. Since bulk-tissue RNA-sequencing reveals averaged gene expression patterns across entire organoids, we employed our single-cell expression data to infer gene modules and understand co-expression in specific cell types. This analysis identified 5 distinct modules with genes enriched in specific cell types: cycling cells (M1: CDK1, CDKN3, NUSAP1, TOP2A, UBE2S), progenitors (M2: BTG1, EFNB1, HES2/4, TUBA1C), astroglia and progenitors (M3: GABBR2, NTRK2, PHGDH, PTPRZ1, SLC1A4), intermediate progenitors/early MNs (M4: FOXP4, RARA, SP1, TEAD2/3, TCF3), and mature MNs (M5: GRIA1/2/4, MAPT, NEFL, SCN2A) (Supplementary Fig. 14c and Supplementary Data 6). These data further suggest a pervasive phenotype, involving distinct developmental dynamics, where MNs, along with differentiating cells, are significantly affected by the lack of SMN1.
To uncover the molecular mechanisms downstream of r6-MO treatment and elucidate the pathways leading to functional rescue, we compared the transcriptional and splicing landscapes of r6-MO-treated SMA SCOs with those treated with r6-scramble-MO. The r6-scramble-MO treatment served as a negative control, providing a baseline for comparison with r6-MO treatment. Relatively few transcriptional changes were detected after r6-MO treatment compared to r6-scrambled-MO, suggesting that, at least within the considered time window, a global transcriptional change is not required for phenotypic rescue.
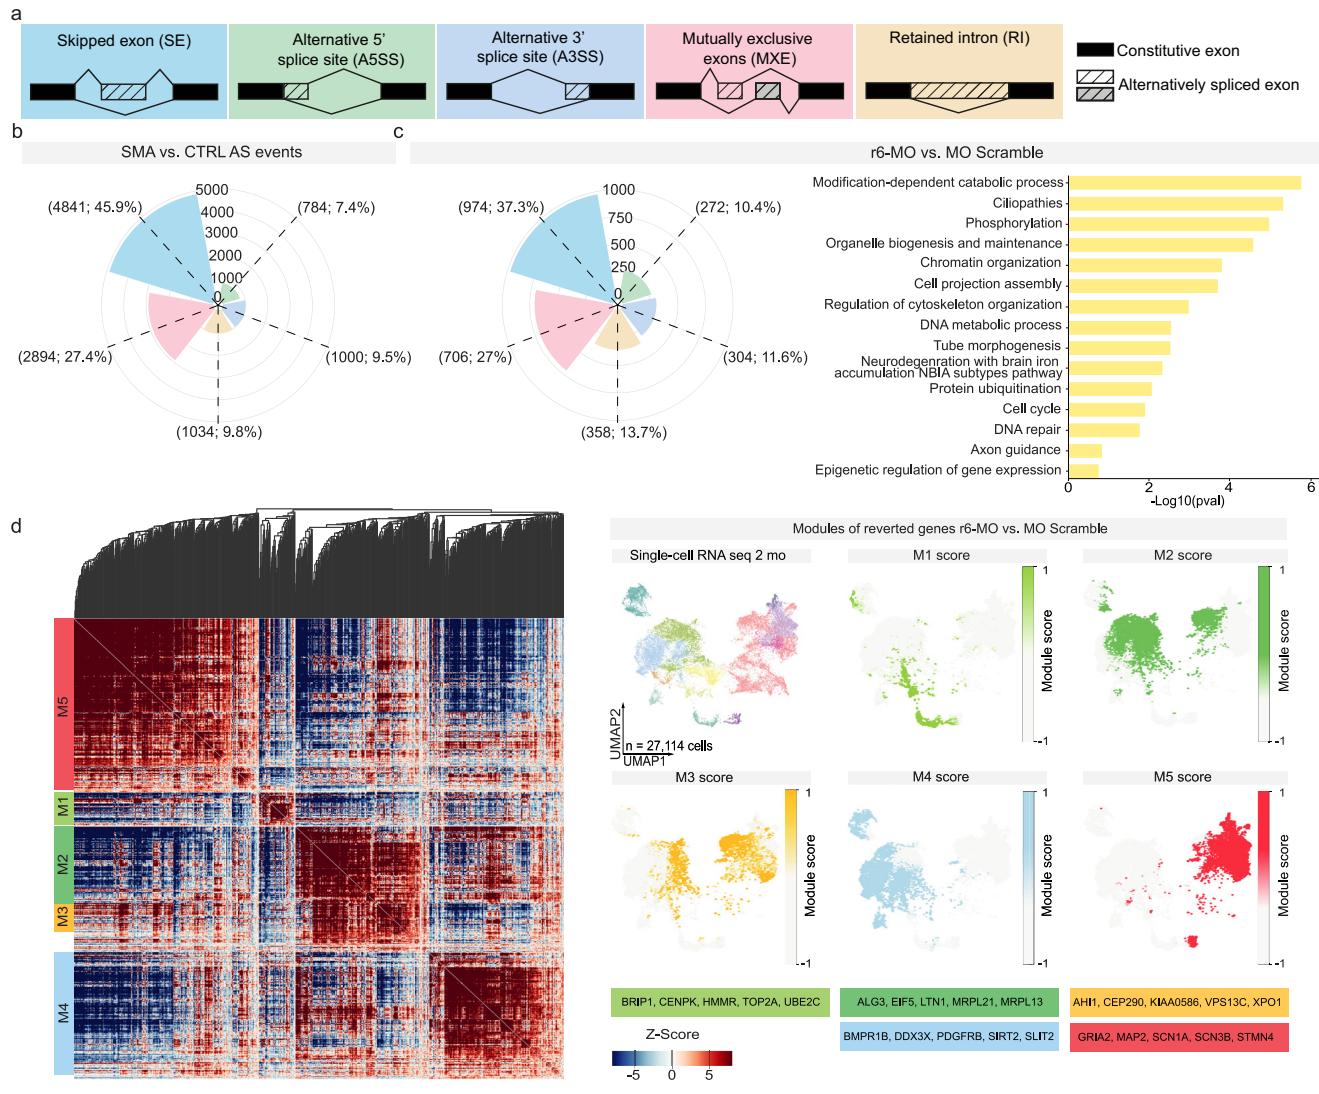
In contrast, analysis of pre-mRNA splicing patterns in SMA vs. CTRL, and r6-MO vs. r6-MO-scrambled-treated SMA organoids showed substantial differences across conditions (Fig. 6a, b and Supplementary Fig. 14d). The loss of SMN1 in SMA SCOs (comparing CTRL with SMA organoids) and SMN rescue by r6-MO treatment (comparing r6-scramble-MO with r6-MO) led to multiple significant alternative splicing changes. The most altered events were found to be skipped exons (SE), mutually exclusive exons (MXE), followed by intron retention (IR), alternative 3’ (A3SS) and 5’ (A5SS) splice site events, detected with a lower frequency (Supplementary Data 7). To assess how r6-MO treatment affects the splicing landscape of SMA cells, we compared pre-mRNA splicing events in r6-MO-treated SCOs to those in r6-scramble-MO (baseline control)-treated cells. A total of 2,614 splicing events were specifically modified by r6-MO (Fig. 6c and Supplementary Data 8). The most abundant ones were represented by SE, MXE, and IR in similar proportions to those observed for the comparison of CTRL vs. SMA. We identified 1982 genes specifically associated with the 2614 rescued splicing events (Supplementary Data 8). Gene ontology enrichment analysis of these genes showed significant enrichment for regulation of chromatin organization, DNA metabolic process, and cell cycle, as well as axon guidance and neurodegeneration (Fig. 6c). Importantly, changes in splicing events could be aligned with specific gene modules from the single-cell RNA-seq analysis (Fig. 6d). We leveraged all the detected rescued spliced genes to compute module score analysis,revealing unique combinations of spliced genes specifically associated with cycling cells (M1: BRIP1, CENPK, HMMR, TOP2A, UBE2C), progenitors (M2: ALG3, EIF5, LTN1, MRPL21, MRPL13), progenitors and neurons (M3: AHI1, CEP290, KIAA0586, VPS13C, XPO1) astroglia (M4: BMPR1B, DDX3X, PDGFRB, SIRT2, SLIT2) and MN cell types (M5: GRIA2, MAP2, SCN1A, SCN3B, STMN4) (Fig. 6d).
Our findings indicate lineage-specific splicing alterations downstream of r6-MO treatment (Supplementary Data 9). To assess whether these changes restore the splicing landscape of specific genes toward control levels, we compared splicing events related to the SMA phenotype vs. CTRL with those induced by r6-MO (using r6-scramble-MO as a specific treatment control). To do this, we intersected the splicing events induced in the SMA vs. CTRL and r6-MO vs. r6-scramble-MO conditions. This integrated analysis revealed a distinct set of splicing events rescued upon r6-MO treatment (Fig. 6e and Supplementary Data 9). Notably, genes outside this category (which did not fully recover their splicing patterns following r6-MO treatment) were linked to broader pathophysiological processes, further suggesting a systemic involvement beyond spinal cord diseases (Supplementary Data 10). Early r6-MO treatment restored the splicing isoforms of 98 genes (Supplementary Data 9), which were identified as top candidates in our bioinformatics analysis. These genes likely play a crucial role in alleviating the phenotypic defects of SMA, with several chromatin remodeling enzymes, including ARIH2, ATG4A/B, CHD9, and HDAC6, emerging as key players. Over time, these targets may help re-establish the molecular profile of both progenitors and neurons, thus contributing to the observed cellular and functional rescue.
Among the rescued genes, we highlighted CHD9 (Chromodomain Helicase DNA-binding protein 9), a key regulator of the cell cycle in embryonic stem cells³⁸, and HDAC6 (Histone Deacetylase 6), which is critical for motor neuron development and function through its roles in axonal transport, autophagy promotion, and neuroprotection³⁹,⁴⁰ (Fig. 6f, sashimi plots). These findings suggest that rescued splicing events impact diverse cellular and molecular processes crucial for progenitor and neuronal development, driving the observed functional recovery following r6-MO treatment.
Specifically rescued events
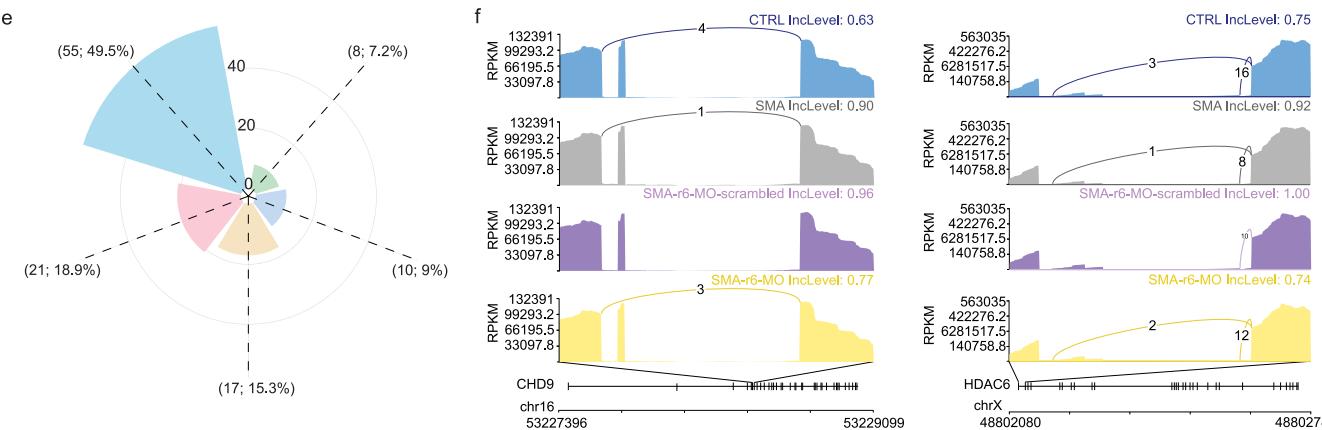
Fig. 6 | r6-MO treatment modulates splicing events in SMA SCOs. a Schematic of the main classes of alternative splicing events (AS). b Rose plot showing the frequencies of AS events, categorized by major event classes, based on a comparison between SMA vs. CTRL (n = 3 C2, n = 3 C3; n = 3 S1, n = 3 S2, n = 3 S3). c Rose plot showing the frequencies of AS events, categorized by major event classes, based on a comparison between r6-MO vs. scrambled-MO treatment in SCOs (n = 3 S1, n = 3 S2, n = 3 S3). Gene Ontology analysis (performed with Metascape) for the 1982 genes associated with r6-MO-specific splicing events. d Clustermap showing the single-cell co-expression profiles of 907 genes with splicing events specific to r6-MO at 2 months in SMA single-cell RNA-sequencing, organized into distinct modules. Genes are grouped into modules based on shared co-expression profiles in low-dimensional space. Module scores are highlighted on the UMAPs of individual modules, with key genes highlighted for each module. e Rose plot showing the frequencies of AS events, categorized by major event classes, based on the overlap between the SMA vs. CTRL and r6-MO vs. scrambled-MO comparisons. These AS events represent those specifically reverted by r6-MO treatment in SCOs. f Sashimi plots display the read distribution and splice junctions for representative exon skipping events in CHD9 and HDAC6, across the four experimental groups.
It is worth noting that the “reverted” genes, despite not showing any class-specific expression in our single-cell dataset, displayed significant enrichment in “SMA-S1 unmatched clusters”, which comprise both progenitors and neurons that are exclusively present in one of the SMA patients (Supplementary Fig. 14e, f). Although confirmed only in one of the lines where these unmatched populations emerged, these data further suggest that an early splicing defect—caused by SMN1 deficiency—could impact the molecular dynamics of spinal cord development, subverting the physiological trajectory of neuronal maturation and function.
Overall, these results point to a scenario in which the restoration of the proper splicing landscape of genes associated with spinal cord development is among the key molecular events occurring upon r6-MO treatment in SMA cells. This also suggests that in SMA organoids, aberrant splicing dynamics impairs progenitor and neuron development and function, and that r6-MO-induced splicing correction thus drives and/or contributes to the rescue of their cellular and functional phenotypes.
¶ Discussion
Stem cell–based models of the human CNS provide an opportunity to unravel processes of human biology that could not otherwise be studied experimentally41–43. Cerebral organoids have been proposed as a platform to study human brain development and identify disease phenotypes42,44–46. However, fewer descriptions of spinal cord-like organoids have been reported in the literature16,47–49, and this area of research deserves further investigation in the context of MN diseases, and neurological disorders with urgent unmet therapeutic needs. Here, we leveraged the organoid technology to generate SCOs and cerebral organoids from iPSCs of healthy subjects and SMA type 1 patients to further our understanding of SMA and test innovative optimized therapies.
The advent of disease-modifying therapies for SMA has changed the scenario of clinical practice and offered new expectations to patients, caregivers, and healthcare providers. Current evidence demonstrates that early treatment is essential for clinical efficacy. Thus, increased knowledge of the prenatal and pre-symptomatic stages of the disease is crucial to optimize therapeutic strategies. Even though SMA is a genetic disorder often with onset in newborns, very few studies have analyzed the prenatal stages of the disease, when SMN function is critical8 , and no molecular data on human SMA spinal cord at single-cell resolution have been reported thus far, exploring how different cell populations are affected. Prenatal MN cell death and dysfunction might condition the onset and severity of the disease postnatally and set the therapeutic window. Still largely unexplored is whether SMN deficiency impairs early neuronal development and thereby triggers neuronal death. In this perspective, SMA organoids represent optimal substrates to begin addressing the link between key early pathological features. Here, we demonstrated that both CTRL and SMA SCOs harbor a spectrum of spinal neuronal domains recapitulating the in vivo complexity of neuronal populations within the human developing spinal cord (Fig. 1). Moreover, we showed that early differentiation programs are affected in SMA spinal organoids (Fig. 2) even before cell death becomes prominent. We identified the presence of a higher number of cells within the early developmental states in the SMA SCOs (Fig. 2). Despite the limitation of pseudotime inference based on a single time point, this analysis still offers meaningful insights into the altered developmental trajectory associated with SMA pathogenesis. These data, together with the pervasive molecular alterations observed in both progenitors as well as neuronal types at the same stage when cell death increases (2mo, Fig. 3), point towards an important developmental component in SMA pathogenesis and suggest that an aberrant developmental trajectory might negatively impact on the differentiation and survival of distinct neuronal subtypes.
While the developmental phenotype associated with SMA remained consistently detectable and statistically significant, even when analyses were performed within individual genotypes, a limitation of the SCO system is the variability in the representation of different cell populations across genotypes, and some differences in MN abundance between iPSC lines is to be acknowledged, especially in control lines. We recognize that performing analyses on iPSC lines derived directly from patients offers the advantage of working with patient-specific material, thereby encompassing broader biological variability. As a result, significant findings are more likely to be clinically relevant. On the other hand, the use of isogenic lines would allow a more precise attribution of phenotypic differences to the disease background rather than inter-individual variation, and therefore, this adds a potential limitation to our study. Nonetheless, despite these constraints, the developmental alteration emerged as a pervasive and biologically relevant phenotype. A recent parallel study modeled SMA using iPSC lines and their corresponding isogenic controls, generating SCOs containing both mesodermal and neural lineages49. Longitudinal single-cell transcriptomic analysis revealed impaired neural stem cell specification and a shift toward mesodermal and muscle progenitors, which represent developmental biases also observed in early SMA mouse embryos. These findings complement our results and aligns with the hypothesis that SMA pathogenesis is rooted in developmental processes, involving not only early fate restriction decisions but also broader neurodevelopmental defects that may contribute to later motor neuron degeneration. The developmental component of a neurodegenerative disorder such as Huntington’s disease has been recently studied50–52 suggesting that this hypothesis can be investigated also in SMA.
The observation of reduced neurite length in SMA SCOs relative to CTRL demonstrates that the 3D model can reproduce key disease features of SMA (Fig. 3). Intriguingly, early neuronal differentiation defects and apoptosis were reproduced in SMA SCOs, suggesting that concomitant defects in differentiation and increased degeneration could contribute to SMA pathogenesis.
Interestingly, when we looked at DEGs, we observed that a large fraction of them were detected in other cellular subgroups besides MNs. These data suggest that, despite defects in spinal MN function being the central feature of SMA pathology, the disease also has a broader impact. A growing body of evidence suggests that SMA is a multifactorial disease in which the interaction between different cell types and disease mechanisms progressively leads to MN dysfunction and death⁵³,⁵⁴. Magnetic resonance imaging has revealed that severe SMA patients who survive beyond 1 year of age exhibit progressive and diffuse brain lesions¹⁰. Prenatal spinal cord alterations have been reported in animal studies⁵⁴, and recently in humans⁹. A very recent study demonstrated functional alterations of the motor cortex and cerebellum in symptomatic SMA mice⁵⁵. Herein, we demonstrated that SMA cerebral organoids show impaired neuronal activity (Fig. 4). This wider impact requires further characterization and needs to be considered for the effective clinical management of SMA patients. Indeed, the generation of spontaneous and evoked activity in both SCOs and brain organoids is impaired (Fig. 4), demonstrating the biological relevance of the model and the direct impact that developmental alterations and/or plasticity events might cause on neuronal wiring. Neuronal hyperexcitability has been described in the context of SMA³⁰,⁵⁶ and ALS⁵⁷, associated with degeneration of both upper and lower MNs⁵⁸,⁵⁹. However, it is not clear how early in SMA progression this dysfunction arises and how it varies across CNS compartments. SMA SCOs showed decreased basal activity and hyperexcitability early on, likely contributing to the disease phenotypes. Furthermore, we reported an SMN-dependent deregulation of glutamate channel genes in multiple neuronal populations, which may point to intrinsic transcriptional changes in SMA neurons related to the observed hyperexcitability.
The last decade has witnessed the development of a growing number of available therapies for SMA. However, the FDA/EMAapproved treatment nusinersen60, an ASO able to increase SMN expression by splicing correction of , requires administration SMN2by periodic lumbar puncture. Permeability of the blood–brain barrier and tissue distribution of ASO delivery can be fostered by cell‑penetrating peptides (CPPs), small cationic molecules with carrier capacity for macromolecular compounds. This strategy offers improved systemic distribution, including upon intravenous injection, in several disease models35 and was proposed in the context of Duchenne muscular dystrophy61. In this current study, we tested the same conjugate in human tissue in SMA SCOs and demonstrated that the drug outperformed unconjugated MO in terms of increased SMN level and rescued SMA pathological hallmarks (Fig. 5).
We exploited deep sequencing bulk RNA-sequencing to globally analyze the altered splicing events in SMA organoids (Fig. 6). This allowed us to evaluate how splicing changes were present in different genetic backgrounds and how the SMN correction had a pervasive effect, independently of the patient-specific background, at the level of different cell types. Indeed, using single-cell RNAsequencing data as a reference, we were able to assess how these rescued targets were expressed by different cell populations in varying developmental states and to uncover important molecular events related to spinal cord development in SMA pathogenesis. Here, we identified splicing alterations associated with SMA phenotype, whose correction might contribute to the rescue of keypathological dysfunction.
This not only opens new avenues of investigation to fully dissect the therapeutic mechanisms of action on the multifaceted aspects of SMA, but also confirms these models as suitable tools to improve the current therapeutic strategies in the clinic, and even expand to more personalized medicine in the future. Altogether, our study suggests that SMN is a key molecule during prenatal spinal cord and brain development, meaning that SMA therapeutics will be most effective if delivered during the pre-symptomatic phase of the disorder, namely peri- or even prenatally. Further studies to analyze the multisystemic impact of SMN deficiency during development will be pivotal in defining the optimal therapeutic window and determining the efficacy of therapies on early developmental defects.
¶ Methods
The studies involving human samples were conducted in accordance with the ethical standards of the Declaration of Helsinki, national legislation, and institutional guidelines. Human fibroblast cell lines were obtained from Eurobiobank with informed consent, as approved by the ethical committee at Fondazione IRCCS Ca’ Granda Ospedale Maggiore Policlinico and University of Milan (0004520).
¶ iPSC reprogramming and culture
Control iPSC lines C1 and C2 were derived from fibroblasts obtained from skin biopsies reprogrammed into iPSCs using the CytoTune iPS 2.0 Kit (CytoTune-iPS Sendai 2.0 Reprogramming Kit, Invitrogen). Control line C3 was obtained from Cedars Sinai CS5NXHiCTR. Control line C4 was obtained from WiCell iPS DF 19-9-11 TH and previously used in Corti et al. 62,63. Control line C5 was previously generated from the Corti laboratory and published in Taiana et al. 64. SMA line S1 was obtained from Cedars Sinai CS77iSMA. SMA line S2 was obtained from Cedars Sinai CS32iSMA. SMA line S3 was obtained from Cedars Sinai CS83iSMA. SMA line S4 was previously generated from the Corti laboratory 65,66. SMA line S5 was previously generated from the Corti laboratory 62. All iPSC lines were derived from male donors. iPSCs were maintained in E8 medium (Essential 8™ Medium, Gibco, A1517001) at 37°C in 5% CO₂.
¶ Embryoid bodies (EBs) formation
Embryoid bodies (EBs) were generated from iPSCs cultured in E8 medium (Essential 8™ Medium [Gibco, A1517001]) at 37 °C in 5% CO₂. At 80–85% confluency, iPSC colonies were detached using Collagenase IV at 2 mg/mL (Gibco, 17104019), collected, and gently resuspended in complete EB medium (DMEM/F12 (Gibco, 11320033), KnockOut Serum Replacement (Gibco, 10828028), MEM-NEAA Solution (Gibco, 11140035), 2-mercaptoethanol 55 mM (Gibco, 21985023), GlutaMAX (Life Technologies, 35050061)) supplemented with bFGF at 4 ng/mL (Peprotech, 100-18B). Cells were transferred to non-treated tissue culture Petri dishes to promote suspension growth. EBs were maintained in suspension for up to 7 days, with medium changes (EB medium without bFGF) every other day following manufacturer’s instructions (Pub. No. MAN0013784 Rev. 1.0).
¶ Generation of cerebral organoids (CrOs)
Cerebral organoids were generated by adapting a previous protocol¹⁴. Selected iPSCs were harvested using Accutase (Life Technologies, A1110501) and approximately 9000 iPSCs were plated in each well of an ultra-low attachment 96-well plate (Corning, CLS7007) in pluripotent stem cell media containing low recombinant human FGF-basic (4 ng/mL, Peprotech, 100-18B) and Y-27632 (50 μM, ROCK inhibitor, Calbiochem, 13624S). On day 6, obtained embryoid bodies (EBs) were transferred to low adhesion 24-well plates (Corning, CLS3473) in neural induction media (NIM) containing DMEM/F12 (Gibco, 11320033), 1% N2 supplement (Gibco, 17502001), 1% GlutaMAX (Life Technologies, 35050061), 1% MEM-NEAA (Gibco, 11140035), and 1 μg/mL heparin (Sigma, H3149). On day 12, the EBs were transferred to droplets of Cultrex® Basement Membrane Matrix Type 2 (BME type 2, Trevigen, 3532-001-02) and grown in differentiation media containing a 1:1 mixture of DMEM/F12 and Neurobasal (Gibco, 21103049) with 0.5% N2 supplement, 1% B27 supplement without vitamin A (Gibco, 12587010), 2-mercaptoethanol, 0.025% insulin (Sigma, I9278), 1% GlutaMAX, and 0.5% MEM-NEAA. After 2 days, the droplets were transferred to a spinning bioreactor containing the same media except for B27 without vitamin A, which was replaced with B27 with vitamin A (Gibco, 17504044). The speed of the spinning bioreactor was gradually increased up to 45 rpm.
¶ Generation of spinal cord organoids (SCOs)
To generate SCOs, the same procedure described for human cerebral organoids was applied from day 0 to day 2. On day 2, half of the medium was changed to fresh medium containing a final concentration of 4 ng/mL bFGF (Peprotech, 100-18B), 50 μM Y-27632 (ROCK inhibitor, Calbiochem, 13624S), 3 μM CHIR 99021 (GSK3 inhibitor, Sigma-Aldrich, SML1046), 2 μM SB-431542 (Activin/BMP/TGF-β pathway inhibitor, Sigma-Aldrich, S4317), and 0.2 μM LDN-193189 (inhibitor of the bone morphogenetic protein [BMP] pathway, Stemcell Technologies, 72149). On day 4, the medium was replaced, adding the same small molecules (excluding bFGF and Y-27632). On day 6, the EBs were transferred into ultra-low attachment 24-well plates and cultured in NIM plus 100 nM retinoic acid (RA, Sigma-Aldrich, R3255). On day 12, EBs were embedded in Cultrex and cultured with SCO differentiation media (SCODM, composed of 1:1 DMEM/F12 and Neurobasal with 0.5% N2 supplement, 1% B27, 2-mercaptoethanol, 0.025% insulin (Sigma, I9278), 1% GlutaMAX, and 0.5% MEM-NEAA). 1 μM Smoothened Agonist (SAG, Calbiochem, 364590-63-6) was added to SCODM. On day 14, SCOs were transferred to spinning bioreactors and cultured with SCODM supplemented with RA and SAG. On day 28, concentrations of RA and SAG were reduced to 50%, and neurotrophic factors BDNF (Peprotech, 450-02), GDNF (Peprotech, 450-10), and IGF-1 (Sigma-Aldrich, 100-12) were added at 10 ng/mL each.
¶ Immunohistochemistry analysis
Organoids were fixed with 4% paraformaldehyde (PFA) for 15 min at room temperature (RT) and subsequently placed in 30% sucrose in 1× PBS overnight at 4 °C. The next day, they were embedded in 7.5–10% gelatin/sucrose, frozen in dry ice, stored at −80 °C overnight, and cryosectioned into 20 μm sections using a cryostat. Organoid sections were permeabilized for 1 h in 1× PBS with 0.3% Triton X-100 (Sigma) and 10% donkey or goat serum (Jackson ImmunoResearch) at RT. 2D cultures were fixed with 4% PFA at RT for 5 min and permeabilized in 1× PBS with 0.2% Triton X-100 (Sigma) and 10% donkey or goat serum (Jackson ImmunoResearch) for 1 h at RT. Primary antibody diluted in fresh permeabilization solution was added overnight at 4 °C (complete list summarized in Supplementary Data 2). The following day, secondary antibodies (AlexaFluor 488, 555, 568, 594, and 647 conjugates, 1:1000; Invitrogen) were added with DAPI (1:500; Sigma-Aldrich, D9542) in 1× PBS for 90 min at RT. DAKO mounting media (Agilent, S3023) was used to mount the coverslips. TUNEL assay was performed using a DeadEnd™ Fluorometric TUNEL System (Promega, G3250). Confocal images were obtained using a Leica SP8 white laser inverted confocal microscope (Leica) and analyzed using Fiji image-processing software.
¶ Image quantification
To evaluate the number of SOX2⁺ cells and the percentage of TUJ1-positive area, 10× mosaic images of whole SCO sections were acquired using a Leica DMi8 inverted microscope and the Leica LAS X software platform. 20× mosaic images of whole brain organoid sections were acquired using a Zeiss Axio inverted microscope and the ZEN Light software platform. At least three different sections were acquired per organoid, with a minimum of 3 organoids per cell line, resulting in n > 3 for both CTRL and SMA lines (Supplementary Data 1). In detail, to compute the number of SOX2⁺ cells, a custom-written Cell Profiler⁶⁷ pipeline was designed, and a custom-designed ImageJ/Fiji⁶⁸ image macro was applied to evaluate the proportion of TUJ1⁺ area (%). For TUNEL quantification, images were acquired using an inverted Nikon-Crest multimodal spinning-disk confocal microscope. Quantification of nuclei (DAPI) and TUNEL-positive cells was performed with an ad hoc designed analysis pipeline for thresholding and segmentation using the GA2 module in NIS-Elements v5.21 software (Nikon-Lim Instruments). Regarding neurofilament tracing, images previously acquired with a Leica SP8 white laser inverted confocal microscope (Leica) were analyzed using Fiji image-processing software. The NeuronJ plug-in was used for the tracing and analysis of neurite length; only filaments that both originated and terminated within the field of view were traced. Filaments extending beyond the field of view or those for which the origin could not be determined were excluded from analysis.
¶ Quantitative real-time PCR (qRT-PCR)
Total RNA was extracted using the ReliaPrep RNA Cell Miniprep System (Promega, Z6010). The RNA concentration was tested using Nanodrop (Thermo Fisher Scientific). Reverse transcription was performed using SuperScript IV VILO Master Mix (Thermo Fisher Scientific, 11756500). 150 ng of template total RNA were retrotranscribed. This protocol has been used to process bulk RNA samples. The expression level of candidate genes (Supplementary Data 3) was assessed by: (i) TaqMan quantitative analysis on the 7500 Real-Time PCR System and 7900HT Fast Real-Time PCR System (Applied Biosystem), GAPDH was used as a reference gene; (ii) Powertrack SYBR (Thermo Fisher Scientific) quantitative analysis on the ViiA 7 Real-Time PCR System (Thermo Fisher Scientific), ACTB was used as a reference gene.
¶ FL and Δ7 transcript analysis
Total RNA extracted from iPSCs or SCOs was retrotranscribed using the SuperScript IV VILO Master Mix (Thermo Fisher Scientific). The relative expression levels of FL and Δ7 transcripts were assessed by RFLP analysis of RT-PCR products (primers available upon request). PCR products underwent o/n digestion at 37 °C by DdeI endonuclease, followed by electrophoresis on a 2.5% agarose gel. DdeI recognizes and cuts molecules containing exon 8, allowing discrimination of SMN1 and SMN2 genomic origin of the FL and Δ7 isoforms.
¶ Electrophysiology
HD-MEA was used to record the extracellular spontaneous activity of both SCOs and cerebral organoids. The device consists of 4096 planar electrodes measuring 21 × 21 μm, covering an area of 2.67 × 2.67 mm (Biocam X with Biochip Arena, 3Brain AG, Switzerland). Organoids were gently positioned on the chip and fixed with a platinum anchor and a nylon mesh. Before and during recordings, organoids were submerged in Krebs’ solution with the following composition (mM): 120 NaCl, 2 KCl, 1.19 MgSO₄, 26 NaHCO₃, 1.18 KH₂PO₄, 11 glucose, 2 CaCl₂, oxygenated with a mix of 95% O₂/5% CO₂ to obtain pH 7.4. Organoids were recorded under control conditions for 15 min, after addition of 100 μM L-glutamic acid (glutamate, Sigma-Aldrich) for an additional 15 min, and after adding the combination of 100 μM glutamate, 10 μM gabazine (SR-95531, Abcam), and 1 μM strychnine hydrochloride (Sigma-Aldrich) for an additional 15 min. Brainwave X (3Brain AG) software was used to record the electrophysiological activity at a sampling frequency of 17 kHz. Brainwave 4 software (3Brain AG) was used to analyze the traces offline. The precise time spike detection algorithm was used to detect the spikes (parameters used: positive and negative peak, peak duration < 1 ms, refractory period > 1 ms, and detection threshold >7 times the standard deviation of the noise). Spike sorting was performed using a principal component analysis with K-means (silhouette method) considering a maximum of three clusters per electrode and three spikes per cluster. The Pakhira-Bandyopadhyay-Maulik index was used for validating clustering results⁶⁹. A final checkout was performed by the researcher by reanalyzing the signals and removing any confounders. Only channels showing stable activity during the control period (spike frequency fluctuations not exceeding 20%) were taken into consideration. The number of channels per organoid considered for the analysis was comparable between control (SCO 13.6 ± 0.6; cerebral 13.8 ± 2.1), SMA (SCO 15.2 ± 0.7; cerebral 15.4 ± 0.9), and treated SMA (SCO 12.8 ± 1.3) organoids. The percentage change in basal firing frequency was calculated by comparing the average firing frequency in the last 10 min before glutamate addition with the interval between 5 and 15 min after glutamate addition.
¶ Morpholino treatment
We used a morpholino (MO-10–34) sequence targeting the SMN2 ISS-N1 region downstream of exon 7 that was previously described by our lab³⁴. The specific MO sequence designed to target SMN2 pre-mRNA was GTAAGATTCACTTTCATAATGCTGG. The CPP used in the study is r6 (RRRRRR, D enantiomeric configuration), which was covalently conjugated to the 5′ end of the MO by our external collaborator, Dr. Hong Moulton. A scrambled MO (scr, GTAACATTGACTTTGATATTCCTGG) was used as a control for antisense specificity. We used MO alone and MO conjugated with r6 peptide (r6-MO)³⁶. As a negative control, we used a custom-made r6-MO containing the scrambled sequence. To assess biodistribution, we used a biotinylated r6-MO that was added to the culture medium as described below. All MO oligomers were synthesized by Gene Tools. We treated SMA SCOs with increasing concentrations of MO or r6-MO. The solution containing 2.4 nmol MO or r6-MO was added directly to each well and incubated for 48 h. Afterward, the culture medium was changed and fresh aliquots of 2.4 nmol MO or r6-MO were added for an additional 48 h. The medium was then replaced with fresh medium for 72 h. Lastly, the organoids were treated again with 4.8 nmol of MO or r6-MO for 48 h.
¶ Western blot analysis
Western blot analysis was performed as described previously³⁴. Briefly, samples were sonicated in lysis buffer supplemented with protease and phosphatase inhibitors (Pierce, Rockford, IL, USA) on ice for 10 min. Approximately 25 μg of protein was separated by 12% SDS-PAGE and electrophoretically transferred to a nitrocellulose membrane. The membranes were incubated with anti-SMN (1:1000, BD) and anti-β-actin (1:1000, Sigma, St. Louis, MO, USA) antibodies. After labeling with peroxidase-conjugated secondary antibodies (Life Technologies), the proteins were detected using a chemiluminescent substrate (Amersham, Pittsburgh, PA, USA). Signals were acquired using the LI-COR Odyssey 9120 imaging system. Densitometry analysis was performed using Image Studio Lite (v5.2).
¶ 2D culture of cells from dissociated organoids
SCOs were centrifuged at 300×g for 5 min, and trypsin-EDTA was added before transferring the organoids to a 37 °C water bath for 5 min. The organoids were then mechanically dissociated, and double the volume of horse serum (Euroclone, ECS0091L) was used to inactivate the trypsin before centrifugation. The supernatant was discarded, and SCO differentiation medium (SCODM) was used to resuspend the pellet. Approximately 50,000 cells were seeded in 24-well plates containing coverslips previously coated with poly-L-ornithine (Sigma-Aldrich, P3655) and laminin (Sigma-Aldrich, L2020). SCODM supplemented with RA, SAG, and growth factors at the same concentrations as used on differentiation day 28 was used for the maintenance of organoid-derived cells.
¶ Whole mount staining
Organoids were washed in 1× PBS and then fixed in 4% PFA on a spinning wheel at 4 °C overnight. The following day, five washes with 1× PBS (10 min each) were performed on the spinning wheel at RT. Organoids were permeabilized with 0.25% Triton X-100 in 1× PBS for 15 min. To prevent non-specific binding, organoids were incubated in 1× PBS with 10% FBS and 0.5% serum from the same species as the primary antibodies. Primary antibodies were applied sequentially in three rounds (after 2, 5, and 12 h) and diluted in 1× PBS with 5% FBS, 0.5% serum of the same species as the primary antibodies, and 0.1% Triton X-100. Secondary antibodies were diluted in the same solution used for primary antibodies and incubated overnight at RT on the spinning wheel. Images were acquired using a Nikon A1R MP+ multiphoton microscope by the Alembic Facility (IRCCS Ospedale San Raffaele).
SCO Cell Dissociation for Single-Cell RNA-Sequencing Analysis
Organoids were dissociated using an optimized protocol based on the Worthington Papain Dissociation System Kit (Worthington Biochemical). Single-cell suspensions were collected in ice-cold 1× PBS (calcium- and magnesium-free) with 0.04% BSA (Sigma-Aldrich) at a density of 1×10⁶ cells/mL, as counted by an automatic cell counter (Countess II, Thermo Fisher).
¶ Single-cell RNA-sequencing and downstream analysis
Sample processing.Approximately 8000 cells from each sample (prepared as described above) were loaded into one channel of the Single Cell Chip B using the Single Cell 3′ v3 reagent kit (10× Genomics) for gel bead emulsion generation in the Chromium system. Following capture and lysis, cDNA was synthesized and amplified for 14 cycles following the manufacturer’s protocol (10× Genomics). The amplified cDNA (50 ng) was then used for each sample to construct Illumina sequencing libraries. Sequencing was performed on the Illumina NextSeq 550 sequencing platform following the 10× Genomics instructions for read generation. A sequencing depth of ~45,000 reads/cell was obtained for each sample.
Data analysis.Raw sequencing data (bcl files) were converted to fastq files using the Illumina bcl2fastq tool integrated into the CellRanger (10× Genomics) suite (v = 3.0.2). The CellRanger analysis pipeline was used to generate a digital gene expression matrix starting from raw data. Reads were aligned to the human GRCh38 reference genome, annotated, and counted with gene annotations from Ensembl version 93. The CellRanger count module was used to map reads with default settings, and the sequence length was set to r1-length = 28 and r2-length = 55. At least 90,000 reads per cell were produced. For further preprocessing and analysis, we used the Scanpy⁷⁰ single-cell analysis toolkit (v = 1.9.6, pandas v = 2.2.0, and numpy v = 1.26.3). Doublets were identified and removed with Scrublet⁷¹ (v = 0.2.3). The threshold for doublet scores was automatically set by the Scrublet algorithm and was applied individually for each sample. Quality control metrics, including mitochondrial and ribosomal content, were calculated using the sc.pp.calculate_qc_metrics function, and then the object was filtered to remove outlier cells containing >10% mitochondrial transcripts and >65% ribosomal transcripts. Further, cells were filtered using a sample-specific median absolute deviation (MAD) threshold for “n_genes_by_counts”. After filtering, the data were concatenated using sc.AnnData.concatenate, annotated with sample names and genotypes. We used scVI-tools⁷² (v = 1.1.0) to mitigate batch effects, where each genotype and sample was treated as a batch. The AnnData object was first transformed by copying counts to adata.layers[“counts”] and identifying 2000 highly variable genes using sc.pp.highly_variable_genes (Seurat V3 flavor), considering the “Sample” batch key. The transformed data were prepared for scVI analysis by setting up AnnData with categorical covariates “Sample” and “genotype”, and continuous covariates “pct_counts_mt”, “pct_counts_ribo”, and “total_counts”. The scVI model was initialized with scvi.model.SCVI and trained using default parameters. The latent representation was extracted using model.get_latent_representation and stored in adata.obsm[“X_scvi”]. Dimensionality reduction was performed by constructing a K-nearest neighbor (KNN) graph with sc.pp.neighbors (using the latent representation X_scvi) and running UMAP with min_dist = 0.2. Clustering was executed at resolutions 0.25, 0.3, 0.5, 0.7, and 1.0 using the Leiden algorithm⁷³ (sc.tl.leiden), and the results were visualized with UMAP plots (sc.pl.umap) displaying cluster assignments, sample information, and genotype. After integration, the data were reverted to all genes using adata.raw.to_adata. Raw counts were normalized using sc.pp.normalize_total(adata, target_sum = None, inplace = False) and log-transformed with sc.pp.log1p, as suggested in a recent scRNA-seq data transformation benchmark study⁷⁴. The final processed data were saved for downstream analysis. Gene set scores were calculated using Scanpy’s sc.tl.score_genes function. To identify differentially expressed genes (DEGs), we applied the Wilcoxon rank-sum test on the normalized counts between all identified clusters (resolution τ = 0.7); the top 50 genes sorted by p-value and log-fold change were considered for biological interpretation.
Differential abundance testing. We performed differential abundance testing using the Python version of Milo²⁵ (v = 0.1.1). Neighborhoods were constructed with a proportion of 0.1 using milo.make_nhoods(). Neighborhood counts were computed with milo.count_nhoods() using the sample column “Sample”. Both genotypes (CTRL and SMA) were encoded as categorical variables (continuous encoding is not appropriate for genotype groups). Differential abundance testing was conducted using milo.DA_nhoods() with a design formula based on genotype. A neighborhood graph was built using milopy.utils.build_nhood_graph() and visualized with milopy.plot_nhood_graph(), highlighting the spatial false discovery rate (FDR) at 1%. Neighborhoods were annotated with cell types using milopy.utils.annotate_nhoods(), and the color palette from Leiden clustering was mapped to the neighborhoods.
Pseudo-bulk differential gene expression analysis between SCO genotypes. To test for differentially expressed genes (DEGs) between genotypes for a particular cell identity (at least 25% of cell proportion for each genotype), we leveraged PyDESeq2⁷⁵ (v = 0.4.4) and the Python implementation of decoupleR⁷⁶ (v = 1.6.0). Pseudo-bulk profiles were generated using the decoupler.get_pseudobulk() function with a minimum of 10 cells and 1000 counts per group. The pseudo-bulk data were normalized, log-transformed, and scaled, followed by principal component analysis (PCA). Associations between metadata and principal components were computed using decoupler.get_metadata_associations(), and the results were visualized with decoupler.plot_associations(). Data were subset by cell type, and differential expression analysis was performed on selected cell types. Genes were filtered by expression with a minimum count of 10 and a minimum total count of 15. The DESeq2 object was constructed with the design factor “genotype” and reference level “CTRL”. Log fold changes (LFCs) were computed, and contrasts between SMA and CTRL genotypes were extracted. DEGs were filtered by adjusted p-value (< 0.05) and absolute LFC (> 0.5). The results were then visualized as complex heatmaps and volcano plots with custom R scripts. The lists of DEGs of selected cell types were analyzed using Ingenuity Pathway Analysis (IPA; Qiagen Ingenuity Systems) to compute enrichment of canonical pathways and biological functions.
Prediction of SCO differentiation states and pseudotime analysis. We performed the prediction of developmental potential on the integrated data using CellRank⁷⁷ (v = 2.0.0) implementation of CytoTRACE⁷⁸. The data were preprocessed by ensuring availability of spliced and unspliced RNA counts, with these layers established from the primary expression matrix when missing. Moments of spliced and unspliced abundances were computed using scvelo.pp.moments(). Later, the CytoTRACE kernel from CellRank was applied to calculate the CytoTRACE score and construct a corresponding transition matrix. CytoTRACE pseudotime was derived from the computed scores to quantitatively represent cellular differentiation status. Pseudotime scores were visualized as density plots comparing different genotypes. Density distributions were estimated using Gaussian kernel density estimation (scipy.stats.gaussian_kde()) and plotted as ridgeline plots, color-coded by genotype and cell type. Visualization and figure customization were performed using the Matplotlib library in Python. To statistically compare pseudotime distributions between genotypes (CTRL vs. SMA), a two-sided Kolmogorov-Smirnov (KS) test was performed using SciPy’s ks_2samp() function. Pseudotime values for each genotype were extracted, and the KS statistic and associated p-value were computed to assess differences in distribution between groups.
Regulons inference and trajectory analysis of motoneurons lineage. To infer the co-expression modules between transcription factors (TFs) and putative target genes in MN (motoneuron) cell lineage, we used the pySCENIC (v = 0.12.1) pipeline²⁸. We performed independent pipeline runs for each SCO genotype data object with the Singularity container. At the first step of regulon inference, the pipeline relies on a machine learning model that fits the expression patterns of genes to expression patterns of TFs via the GRNBoost2⁷⁹ algorithm. For this part, we used the command line tool (pyscenic:0.12.1 arboreto_with_multiprocessing.py) with default parameters. Next, the output fits were used to predict potential regulons and direct-binding targets, which were then refined through TF motif enrichment analysis with (pyscenic:0.12.1 pyscenic ctx) and the “–max dropout” parameter. Lastly, cells were scored for the activity of each regulon in SMA and CTRL data objects, respectively, via the AUCell method⁸⁰ with (pyscenic:0.12.1 pyscenic aucell). The obtained regulon activity scores and metadata were used in secondary analysis for visualization and trajectory analysis.
We performed trajectory analysis on SCOs focusing on motoneuron lineage using Palantir⁸¹ (v = 1.3.3) and scFates⁸² (v = 1.1.1). The SCO data object was loaded, and specific clusters unrelated to the MN lineage were removed. Diffusion maps were computed to generate a multiscale diffusion space with four eigenvectors. The principal tree was constructed using scf.tl.tree() with parameters: method = “ppt”, nodes = 200, ppt_lambda = 100, ppt_sigma = sig, ppt_nsteps = 200. The root was set to the SOX2 expression using scf.tl.root() and corresponded to the pMN (presumptive motoneuron) population. Later, pseudotime was computed using scf.tl.pseudotime() with parameters: n_jobs = 20, n_map = 50, seed = 42. To explore differences in motoneuron differentiation along a shared trajectory, the data were stratified by genotype into CTRL and SMA MN groups. For each group, dendrograms were generated using scf.pl.dendrogram() and KDE plots (seaborn.kdeplot()). Next, the pySCENIC AUCell output was processed to align with the motoneuron trajectory data generated previously, and this approach was adopted from the study of Petitpré C et al.⁸³. pySCENIC AUCell output for control and SMA samples was loaded from .loom files. The AUCell matrices were aligned with the trajectory data by matching cell IDs. Regulons active in fewer than six cells were filtered out. Regulon activity was tested for association with trajectory data using scFates and GAM (scf.tl.test_association() with n_jobs = 20 and A_cut = 0.025). Pseudotime for cells was updated based on their order in trajectory analysis (adata.uns[“pseudotime_list”]), and the trajectory model was fitted using scf.tl.fit() with n_jobs = 20. The trend of specific regulon activity along trajectory segments was visualized using scf.pl.single_trend() and scf.pl.trends(). For control samples, a set of significant regulons was highlighted, and the trends of these regulons were plotted. Similar analyses were performed for SMA samples.
Identification of informative splicing gene modules. To associate splicing gene modules with clusters in the SCO object (CTRL or SMA), we subsetted the object to retain only the selected pools of splicing genes (all cells were kept). After performing scVI dimensionality reduction, we conducted Hotspot⁸⁴ (v = 1.1.1) analysis to identify gene modules by calculating autocorrelations for the genes and filtering for significant genes with an FDR < 0.05. Local correlations were computed for the significant genes using 15 parallel jobs, and gene modules were generated with a minimum gene threshold of 50 (core-only mode) and an FDR threshold of 0.05. Module scores were calculated and assigned to the dataset. Finally, module scores of splicing genes were visualized as scatter plots on UMAP coordinates using custom color palettes.
Stage mapping to reference fetal spinal cord data. To map our control organoid dataset onto a temporal developmental reference, we first processed a fetal spinal cord single-cell atlas²³ using Scanpy. After standard cell and gene filtering, the data were normalized, and 2000 highly variable genes (HVGs) were identified using a batch-aware “seurat_v3” approach. We then trained a four-layer scVI model on these HVGs to create a latent reference space. Our control organoid query data was subsequently aligned to this 2000-gene set by adding zero expression values for missing genes. Using the scArches (v = 0.6.1) package, we projected the query data onto the reference atlas via partial model retraining. The developmental stage of CTRL organoid cells was then inferred by transferring “Gestational Week” and “Trimester” labels from the atlas using a weighted k-nearest neighbor (kNN) classifier (k = 100), and we quantified the similarity between query and reference states by calculating cell presence scores.
Cell Type Mapping to Reference Fetal Spinal Cord Data. First, the raw count matrix of fetal spinal cord atlas²⁴ was loaded from a .h5ad file into an AnnData object. The raw counts were preserved in a separate layer; the data were then normalized to 10,000 total counts per cell (sc.pp.normalize_total()) and log-transformed (sc.pp.log1p()). The top 2000 highly variable genes were identified across batches using the seurat_v3 method on the raw count layer, and the dataset was subsetted to retain only these genes. To correct for batch effects associated with developmental stages, we used the scVI-tools package (v = 1.3.0). The model was constructed using the raw counts and stage annotation as the batch key. The scVI model was initialized with two hidden layers and trained to learn a latent cell representation. This latent space embedding served as the basis for semiautomatic cell annotation. To assign broad cell identities, gene module scores were calculated using marker genes adapted from ref. 24. These scores enabled classification of major tissue/cell types, including spinal cord progenitor, spinal cord neuron, sensory neuron/progenitor, mesoderm, hematopoietic cells, and erythrocytes, as visualized in ref. 24.
Reference Model Pre-training. A pre-processed and annotated fetal spinal cord dataset was used for scPoli⁸⁵ model training; scPoli is a deep generative model designed to integrate datasets from different conditions while preserving cell type identity. We first identified the top 2000 highly variable genes (HVGs) across experimental batches (stage as the batch key) using the seurat_v3 method. The scPoli model was initialized on the data subset containing only the HVGs. The model was configured with stage as the condition key and manually annotated cell types as the cell type key. The architecture was defined with a 32-dimensional latent space and a single hidden layer of 1024 nodes. A zero-inflated negative binomial loss function was used for data reconstruction. The model was trained for a maximum of 50 epochs, including 40 pre-training epochs, with an early stopping mechanism monitoring the validation prototype loss and a patience of 10 epochs. Upon training completion, the learned latent representation was extracted and stored in the original AnnData object. This integrated “X_scpoli” embedding was then used for transfer learning and downstream analysis, including k-nearest neighbor graph construction and UMAP visualization. To compare our spinal cord organoid dataset with the in vivo reference, we performed computational mapping using a pre-trained scPoli model built on the fetal spinal cord atlas. First, the query organoid dataset was loaded, and control (CTRL) sample cells were isolated for analysis. To ensure compatibility with the reference model, the query data gene set was aligned to the 2000 HVGs used for reference training. Genes present in the reference but absent from the query were added with zero-count expression values. We utilized an scArches⁸⁶ (v = 0.6.1) workflow to project the query data into the reference latent space. Mapping was performed using a partial retraining strategy (retrain = “partial”) for 30 epochs, which fine-tuned the model on the query data while keeping reference cell embeddings fixed. Following mapping, we constructed a weighted k-nearest neighbor (wKNN) graph in the shared latent space, connecting each query cell to its k = 100 nearest neighbors in the reference atlas with the HNOCA-tools package⁸⁷ (v = 0.1.1). This graph formed the basis for label transfer: reference cell type annotations were assigned to each organoid cell, yielding final labels and quantitative confidence scores. The resulting latent space coordinates and transferred annotations were then added back to the original query object for further analysis. Second, we calculated cell presence scores for primary tissue to quantify compositional similarity between the organoid samples and the fetal reference atlas. The resulting latent embedding and annotations were added to the query object for downstream visualization and analysis.
¶ Bulk RNA-seq analyses
Library construction. Libraries were prepared starting from 50 ng of total RNA derived from 9 control, 6 SMA, and 16 morpholino-treated SMA (8 r6-MO, 8 r6-MO-scrambled) organoids using the SMARTer Stranded RNA-Seq Kit (TaKaRa), following the manufacturer’s instructions. Samples underwent high-coverage paired-end 150-bp strand-specific sequencing on the Illumina NextSeq 2000 platform.
Alignment. For each sample group (9× control organoids, 6× SMA organoids, 8× SMA organoids treated with r6-MO, and 8× SMA organoids treated with r6-MO-scrambled), raw reads were mapped to the human hg38 genome and quantified using STAR v2.7.10a⁸⁸.
SMN1 and SMN2 counts. SMN1 (SMN-C) and SMN2 (SMN-T) genes share an extremely high degree of homology (>99%). Thus, to distinguish reads derived from the two genes, we counted reads mapping to exon 7, where a single nucleotide difference enables unambiguous discrimination between SMN1 and SMN2. This verification was performed using the IGV tool. Counts mapping to other regions of the genes were excluded from this analysis.
Differential gene expression analysis. Differential gene expression analysis was performed in R using the edgeR package (v4.0.2) with the estimateDisp, glmFit, and glmLRT functions. Genes with counts per million (cpm) < 0.05 in at least 6 samples were filtered out.
Gene ontology differential expressed genes. Gene ontology of differential expressed genes between CTRL and SMA organoids was done using Ingenuity Pathway Analysis. Terms from “Canonical pathways” and “diseases and functions” were filtered.
Differential splicing analysis. Differential splicing analysis between samples was determined using rMATS-turbo v4.3.0⁸⁹, a tool that identifies 5 basic types of alternative splicing (AS) patterns: skipped exons (SE), mutually exclusive exons (MXE), alternative 5′ splice sites (A5SS), alternative 3′ splice sites (A3SS), and retained introns (RI). Significant events were characterized by an FDR < 0.05 and an absolute Inclusion Level Difference > 0.05. Only the reads mapping to exon-exon junctions were used for the analyses. Sashimi plots of events of interest were created using rmats2sashimiplot v2.0.4 (https://github.com/Xinglab/rmats2sashimiplot).
Gene ontology of splicing events. Differential splicing events from SMA vs. CTRL and SMA r6-MO vs. SMA r6-MO-Scrambled were compared. Events sharing (i) the same starting position and the same ending position and (ii) with opposite Inclusion Level Difference were called as “common events”. To annotate gene function, gene ontology was performed using Metascape90. Downstream processing of splicing and gene expression data were done in R v4.1.0 using custom scripts.
¶ Statistical analysis
Continuous variables were reported as mean ± SD. Comparisons between groups, as well as between baseline and post-intervention or time points within a group, were assessed using unpaired and paired two-sided Student’s t-tests, respectively. One-way or two-way ANOVA was used for comparisons among groups, with Tukey HSD or Sidak’s post-hoc tests applied when the null hypothesis of the omnibus test was rejected. All analyses were performed using GraphPad Prism v8.0, with a significance level set to 0.05.
¶ Reporting summary
Further information on research design is available in the Nature Portfolio Reporting Summary linked to this article.
¶ Data availability
All data are available in the main text or the supplementary materials. Source data are provided with this paper. Read-level data from scRNAseq have been deposited at GSE290980 while count-level data and metadata from bulk RNA-seq have been deposited at GSE290979. Source data are provided with this paper.
¶ References
- Kolb, S. J. et al. Natural history of infantile-onset spinal muscular atrophy. Ann. Neurol. 82, 883–891 (2017).
- Faravelli, I., Nizzardo, M., Comi, G. P. & Corti, S. Spinal muscular atrophy–recent therapeutic advances for an old challenge. Nat. Rev. Neurol. 11, 351–359 (2015).
- Lorson, C. L., Hahnen, E., Androphy, E. J. & Wirth, B. A single nucleotide in the SMN gene regulates splicing and is responsible for spinal muscular atrophy. Proc. Natl. Acad. Sci. USA 96, 6307–6311 (1999).
- Parente, V. & Corti, S. Advances in spinal muscular atrophy therapeutics. Ther. Adv. Neurol. Disord. 11, 1756285618754501 (2018).
- Mercuri, E., Pera, M. C., Scoto, M., Finkel, R. & Muntoni, F. Spinal muscular atrophy - insights and challenges in the treatment era. Nat. Rev. Neurol. 16, 706–715 (2020).
- Mercuri, E., Sumner, C. J., Muntoni, F., Darras, B. T. & Finkel, R. S. Spinal muscular atrophy. Nat. Rev. Dis. Prim. 8, 1–16 (2022).
- Soler-Botija, C., Ferrer, I., Gich, I., Baiget, M. & Tizzano, E. F. Neuronal death is enhanced and begins during foetal development in type I spinal muscular atrophy spinal cord. Brain 125, 1624–1634 (2002).
- Ramos, D. M. et al. Age-dependent SMN expression in diseaserelevant tissue and implications for SMA treatment. J. Clin. Invest. 129, 4817–4831 (2019).
- Kong, L. et al. Impaired prenatal motor axon development necessitates early therapeutic intervention in severe SMA. Sci. Transl. Med. 13, eabb6871 (2021).
- Mendonça, R. H. et al. Severe brain involvement in 5q spinal muscular atrophy type 0. Ann. Neurol. 86, 458–462 (2019).
- Faravelli, I., Costamagna, G., Tamanini, S. & Corti, S. Back to the origins: human brain organoids to investigate neurodegeneration. Brain Res. 1727, 146561 (2020).
- Tiziano, F. D. & Tizzano, E. F. 25 years of the SMN genes: the Copernican revolution of spinal muscular atrophy. Acta Myol. 39, 336–344 (2020).
- Tizzano, E. F. et al. Outcomes for patients in the RESTORE registry with spinal muscular atrophy and four or more SMN2 gene copies treated with onasemnogene abeparvovec. Eur. J. Paediatr. Neurol. 53, 18–24 (2024).
- Lancaster, M. A. et al. Cerebral organoids model human brain development and microcephaly. Nature 501, 373–379 (2013).
- Velasco, S. et al. Individual brain organoids reproducibly form cell diversity of the human cerebral cortex. Nature 570, 523–527 (2019).
- Andersen, J. et al. Generation of functional human 3D cortico-motor assembloids. Cell 183, 1913–1929.e26 (2020).
- Ma, X. R. et al. TDP-43 represses cryptic exon inclusion in the FTD–ALS gene UNC13A. Nature 603, 124–130 (2022).
- Sagner, A. & Briscoe, J. Establishing neuronal diversity in the spinal cord: a time and a place. Development 146, dev182154 (2019).
- Lupo, G., Harris, W. A. & Lewis, K. E. Mechanisms of ventral patterning in the vertebrate nervous system. Nat. Rev. Neurosci. 7, 103–114 (2006).
- Amoroso, M. W. et al. Accelerated high-yield generation of limbinnervating motor neurons from human stem cells. J. Neurosci. 33,574–586 (2013).
- Du, Z.-W. et al. Generation and expansion of highly pure motor neuron progenitors from human pluripotent stem cells. Nat. Commun. 6, 6626 (2015).
- Rizzo, F. et al. Key role of SMN/SYNCRIP and RNA-Motif 7 in spinal muscular atrophy: RNA-Seq and motif analysis of human motor neurons. Brain 142, 276–294 (2019).
- Zhang, Q. et al. Single-cell analysis reveals dynamic changes of neural cells in developing human spinal cord. EMBO Rep. 22, e52728 (2021).
- Rayon, T., Maizels, R. J., Barrington, C. & Briscoe, J. Single-cell transcriptome profiling of the human developing spinal cord reveals a conserved genetic programme with human-specific features. Development 148, dev199711 (2021).
- Dann, E., Henderson, N. C., Teichmann, S. A., Morgan, M. D. & Marioni, J. C. Differential abundance testing on single-cell data using k-nearest neighbor graphs. Nat. Biotechnol. 40, 245–253 (2022).
- Sagner, A. et al. A shared transcriptional code orchestrates temporal patterning of the central nervous system. PLoS Biol. 19, e3001450 (2021).
- Van de Sande, B. et al. A scalable SCENIC workflow for single-cell gene regulatory network analysis. Nat. Protoc. 15, 2247–2276 (2020).
- Meng, H. et al. Loss of Parkinson’s disease-associated protein CHCHD2 affects mitochondrial crista structure and destabilizes cytochrome c. Nat. Commun. 8, 15500 (2017).
- Kee, T. R. et al. Mitochondrial CHCHD2: disease-associated mutations, physiological functions, and current animal models. Front. Aging Neurosci. 13, 660843 (2021).
- Arumugam, S., Garcera, A., Soler, R. M. & Tabares, L. Smndeficiency increases the intrinsic excitability of motoneurons. Front. Cell Neurosci. 11, 269 (2017).
- Quinlan, K. A. et al. Hyperexcitability precedes motoneuron loss in the Smn2B/- mouse model of spinal muscular atrophy. J. Neurophysiol. 122, 1297–1311 (2019).
- Brunet, A., Stuart-Lopez, G., Burg, T., Scekic-Zahirovic, J. & Rouaux, C. Cortical circuit dysfunction as a potential driver of amyotrophic lateral sclerosis. Front. Neurosci. 14, 363 (2020).
- Sibilla, S. & Ballerini, L. GABAergic and glycinergic interneuron expression during spinal cord development: dynamic interplay between inhibition and excitation in the control of ventral network outputs. Prog. Neurobiol. 89, 46–60 (2009).
- Ramirez, A. et al. Investigation of new morpholino oligomers to increase survival motor neuron protein levels in spinal muscular atrophy. Int. J. Mol. Sci. 19, 167 (2018).
- Moulton, H. M. & Moulton, J. D. Morpholinos and their peptide conjugates: therapeutic promise and challenge for Duchenne muscular dystrophy. Biochim. Biophys. Acta 1798, 2296–2303 (2010).
- Bersani, M. et al. Cell-penetrating peptide-conjugated Morpholino rescues SMA in a symptomatic preclinical model. Mol. Ther. 30, 1288–1299 (2022).
- Gubitz, A. K., Feng, W. & Dreyfuss, G. The SMN complex. Exp. Cell Res. 296, 51–56 (2004).
- Yoo, H. et al. ATP-dependent chromatin remodeler CHD9 controls the proliferation of embryonic stem cells in a cell culture conditiondependent manner. Biology 9, 428 (2020).
- Guo, W. et al. HDAC6 inhibition reverses axonal transport defects in motor neurons derived from FUS-ALS patients. Nat. Commun. 8, 861 (2017).
- Chen, S. et al. Histone deacetylase 6 delays motor neuron degeneration by ameliorating the autophagic flux defect in a transgenic mouse model of amyotrophic lateral sclerosis. Neurosci. Bull. 31, 459–468 (2015).
- Mancinelli, S. & Lodato, S. Decoding neuronal diversity in the developing cerebral cortex: from single cells to functional networks. Curr. Opin. Neurobiol. 53, 146–155 (2018).
- Velasco, S., Paulsen, B. & Arlotta, P. 3D brain organoids: studying brain development and disease outside the embryo. Annu. Rev. Neurosci. 43, 375–389 (2020).
- Tambalo, M. & Lodato, S. Brain organoids: human 3D models to investigate neuronal circuits assembly, function and dysfunction. Brain Res. 1746, 147028 (2020).
- Paulsen, B. et al. Autism genes converge on asynchronous development of shared neuron classes. Nature 602, 268–273 (2022).
- Antón-Bolaños, N. et al. Brain chimeroids reveal individual susceptibility to neurotoxic triggers. Nature 631, 142–149 (2024).
- Mancinelli, S., Bariselli, S. & Lodato, S. The emergence of electrical activity in human brain organoids. Stem Cell Rep. 20, 102632 (2025).
- Ogura, T., Sakaguchi, H., Miyamoto, S. & Takahashi, J. Threedimensional induction of dorsal, intermediate and ventral spinal cord tissues from human pluripotent stem cells. Development 145, dev162214 (2018).
- Faustino Martins, J.-M. et al. Self-organizing 3D human trunk neuromuscular organoids. Cell Stem Cell 26, 172–186.e6 (2020).
- Grass, T. et al. Isogenic patient-derived organoids reveal early neurodevelopmental defects in spinal muscular atrophy initiation. Cell Rep. Med 5, 101659 (2024).
- Galimberti, M. et al. Huntington’s disease cellular phenotypes are rescued non-cell autonomously by healthy cells in mosaic telencephalic organoids. Nat. Commun. 15, 6534 (2024). ment. Science 369, 787–793 (2020).
- Galgoczi, S. et al. Huntingtin CAG expansion impairs germ layer patterning in synthetic human 2D gastruloids through polarity defects. Development 148, dev199513 (2021).
- Faravelli, I. & Corti, S. Spinal muscular atrophy - challenges in the therapeutic era. Nat. Rev. Neurol. 16, 655–656 (2020).
- Motyl, A. A. L. et al. Pre-natal manifestation of systemic developmental abnormalities in spinal muscular atrophy. Hum. Mol. Genet. 29, 2674–2683 (2020).
- Tharaneetharan, A. et al. Functional abnormalities of cerebellum and motor cortex in spinal muscular atrophy mice. Neuroscience 452, 78–97 (2021).
- Simon, C. M. et al. A stem cell model of the motor circuit uncouples motor neuron death from hyperexcitability induced by SMN deficiency. Cell Rep. 16, 1416–1430 (2016).
- Wainger, B. J. et al. Intrinsic membrane hyperexcitability of amyotrophic lateral sclerosis patient-derived motor neurons. Cell Rep. 7, 1–11 (2014).
- Burg, T. et al. Absence of subcerebral projection neurons is beneficial in a mouse model of amyotrophic lateral sclerosis. Ann. Neurol. 88, 688–702 (2020).
- Marques, C., Burg, T., Scekic-Zahirovic, J., Fischer, M. & Rouaux, C. Upper and lower motor neuron degenerations are somatotopically related and temporally ordered in the Sod1 mouse model of amyotrophic lateral sclerosis. Brain Sci. 11, 369 (2021).
- Finkel, R. S. et al. Nusinersen versus sham control in infantileonset spinal muscular atrophy. N. Engl. J. Med. 377, 1723–1732 (2017).
- Duan, D., Goemans, N., Takeda, S., Mercuri, E. & Aartsma-Rus, A. Duchenne muscular dystrophy. Nat. Rev. Dis. Prim. 7, 1–19 (2021).
- Corti, S. et al. Genetic correction of human induced pluripotent stem cells from patients with spinal muscular atrophy. Sci. Transl. Med. 4, 165ra162 (2012).
- Hensel, N. et al. Impairment of the neurotrophic signaling hub B-Raf contributes to motoneuron degeneration in spinal muscular atrophy. Proc. Natl. Acad. Sci. USA 118, e2007785118 (2021).
- Taiana, M. et al. Molecular analysis of SMARD1 patient-derived cells demonstrates that nonsense-mediated mRNA decay is impaired. J. Neurol. Neurosurg. Psychiatry 93, 908–910 (2022).
- Ronchi, D. et al. Novel splice-site mutation in SMN1 associated with a very severe SMA-I phenotype. J. Mol. Neurosci. 56, 212–215 (2015).
- Pagliari, E. et al. Targeting STMN2 for neuroprotection and neuromuscular recovery in Spinal Muscular Atrophy: evidence from in vitro and in vivo SMA models. Cell. Mol. Life Sci. 82, 29 (2024).
- Carpenter, A. E. et al. CellProfiler: image analysis software for identifying and quantifying cell phenotypes. Genome Biol. 7, R100 (2006).
- Schindelin, J. et al. Fiji: an open-source platform for biologicalimage analysis. Nat. Methods 9, 676–682 (2012).
- Monteverdi, A., Di Domenico, D., D’Angelo, E. & Mapelli, L. Anisotropy and frequency dependence of signal propagation in the cerebellar circuit revealed by high-density multielectrode array recordings. Biomedicines 11, 1475 (2023).
- Wolf, F. A., Angerer, P. & Theis, F. J. SCANPY: large-scale single-cell gene expression data analysis. Genome Biol. 19, 15 (2018).
- Wolock, S. L., Lopez, R. & Klein, A. M. Scrublet: computational identification of cell doublets in single-cell transcriptomic data. Cell Syst. 8, 281–291.e9 (2019).
- Gayoso, A. et al. A Python library for probabilistic analysis of singlecell omics data. Nat. Biotechnol. 40, 163–166 (2022).
- Traag, V. A., Waltman, L. & van Eck, N. J. From Louvain to Leiden: guaranteeing well-connected communities. Sci. Rep. 9, 5233 (2019).
- Ahlmann-Eltze, C. & Huber, W. Comparison of transformations for single-cell RNA-seq data. Nat. Methods 20, 665–672 (2023).
- Muzellec, B., Teleńczuk, M., Cabeli, V. & Andreux, M. PyDESeq2: a Python package for bulk RNA-seq differential expression analysis. Bioinformatics 39, btad547 (2023).
- Badia-i-Mompel, P. et al. decoupleR: ensemble of computational methods to infer biological activities from omics data. Bioinforma. Adv. 2, vbac016 (2022).
- Lange, M. et al. CellRank for directed single-cell fate mapping. Nat. Methods 19, 159–170 (2022).
- Gulati, G. S. et al. Single-cell transcriptional diversity is a hallmark of developmental potential. Science 367, 405–411 (2020).
- Moerman, T. et al. GRNBoost2 and Arboreto: efficient and scalable inference of gene regulatory networks. Bioinformatics 35, 2159–2161 (2019).
- AUCell. Bioconductor http://bioconductor.org/packages/AUCell/.
- Setty, M. et al. Characterization of cell fate probabilities in singlecell data with Palantir. Nat. Biotechnol. 37, 451–460 (2019).
- Faure, A. J. et al. Mapping the energetic and allosteric landscapes of protein binding domains. Nature 604, 175–183 (2022).
- Petitpré, C. et al. Single-cell RNA-sequencing analysis of the developing mouse inner ear identifies molecular logic of auditory neuron diversification. Nat. Commun. 13, 3878 (2022).
- DeTomaso, D. & Yosef, N. Hotspot identifies informative gene modules across modalities of single-cell genomics. Cell Syst. 12, 446–456.e9 (2021).
- De Donno, C. et al. Population-level integration of single-cell datasets enables multi-scale analysis across samples. Nat. Methods 20, 1683–1692 (2023).
- Lotfollahi, M. et al. Mapping single-cell data to reference atlases by transfer learning. Nat. Biotechnol. 40, 121–130 (2022).
- He, Z. et al. An integrated transcriptomic cell atlas of human neural organoids. Nature 635, 690–698 (2024).
- Dobin, A. et al. STAR: ultrafast universal RNA-seq aligner. Bioinformatics 29, 15–21 (2013).
- Shen, S. et al. rMATS: robust and flexible detection of differential alternative splicing from replicate RNA-Seq data. Proc. Natl. Acad. Sci. USA 111, E5593–E5601 (2014).
- Zhou, Y. et al. Metascape provides a biologist-oriented resource for the analysis of systems-level datasets. Nat. Commun. 10, 1523 (2019).
¶ Acknowledgements
The authors thank the Associazione Centro Dino Ferrari for support, and the Humanitas Genomic Unit (HUGE) and Humanitas Bioinformatic Unit for technical support with single‑cell sequencing experiments and analysis. We acknowledge Teresa Rayon (Babraham Institute, Cambridge, UK) for sharing count data of human fetal pMN and MN cell populations, and Hynek Wichterle (Motor Neuron Center, Columbia University, New York, NY) for sharing the HB9 antibody. We acknowledge Dario Ronchi for valuable comments and Stefania Sempreboni for technical support. We acknowledge Professor Hong Moulton for morpholino‑peptide conjugation.
We also acknowledge the following funding sources:
Italian Ministry of Health grant RF‑2018‑12366357 (S.C.)
Italian Ministry of Health grant RF‑2016‑02362317 (G.C.)
Italian Ministry of Health, Fondazione IRCCS Ca’ Granda Ospedale Maggiore Policlinico, Ricerca Corrente 2026 (230) (G.C. and S.C.)
Italian Ministry of Health PNRR‑POC‑2023‑12377653 (S.C.)
Telethon Foundation grant GGP14025 (M.N.)
Italian Ministry of Health 5×1000 Ricerca Sanitaria (S.L.)
Italian Ministry of Health grant RF‑2018‑12365280 (S.L.)
Cariplo Giovani 2019‑1785 (S.L.)
Fondazione Umberto Veronesi (M.T.)
ERC Starting Grant IMPACT 101043003 (S.L.)
Ricerca Finalizzata grant GR‑2019‑12368561 (S.L.)
This work was supported by #NEXTGENERATIONEU (NGEU) and funded by the Ministry of University and Research (MUR), National Recovery and Resilience Plan (NRRP), project MNESYS (PE0000006) — A Multiscale integrated approach to the study of the nervous system in health and disease (DN. 1553 11.10.2022) to E.P. and E.D. The Department of Pathophysiology and Transplantation, University of Milan, is funded by the Italian Ministry of Education and Research (MUR): Dipartimenti di Eccellenza Program 2023 to 2027.
¶ Author contributions
S.C., M.N., S.L., I.F., M.T., and P.R. conceived and designed the research project. M.N., P.R., M.R., G.F., A.D.A., and L.C. performed experiments and collected data regarding iPSCs generation and characterization. P.R., I.F., and A.D.A. generated and characterized spinal cord organoids. F.B. helped generating and characterizing spinal cord organoids. M.T., P.R., and I.F. generated and characterized brain organoids. S.M. and M.T. performed image acquisition and S.M., M.T., and P.R. performed image quantification. L.M. and E.D. conducted MEA recording and analyses with the help of E.P., and C.C. imaged and quantified TUNEL analyses together with P.R. I.F. and P.R. performed statistical analyses on aggregated data for SOX2 and TUJ1 counts. C.P., S.M., and M.T. performed single-cell RNA-seq experiments and P.K. and I.S. performed the relative computational analyses. M.M. and E.M.P. analyzed bulk RNA-seq and splicing data. G.C. and S.P. contributed to data discussion and supervision of I.F. and P.R. I.F., P.R., M.T., S.L., and S.C. wrote the manuscript with the critical contribution of all the authors. S.L. and S.C. contributed equally to this work. All authors critically reviewed and approved the final version of the manuscript.
Competing interests The authors declare no competing interests.
Additional information
Supplementary information The online version contains supplementary material available at
https://doi.org/10.1038/s41467-025-67725-1.
Correspondence and requests for materials should be addressed to Simona Lodato or Stefania Corti.
Peer review information Nature Communications thanks Yoshiho Ikeuchi and the other, anonymous, reviewers for their contribution to the peer review of this work. A peer review file is available.
Reprints and permissions information is available at http://www.nature.com/reprints
Publisher’s note Springer Nature remains neutral with regard to jurisdictional claims in published maps and institutional affiliations.
Open Access This article is licensed under a Creative Commons Attribution-NonCommercial-NoDerivatives 4.0 International License, which permits any non-commercial use, sharing, distribution and reproduction in any medium or format, as long as you give appropriate credit to the original author(s) and the source, provide a link to the Creative Commons licence, and indicate if you modified the licensed material. You do not have permission under this licence to share adapted material derived from this article or parts of it. The images or other third party material in this article are included in the article’s Creative Commons licence, unless indicated otherwise in a credit line to the material. If material is not included in the article’s Creative Commons licence and your intended use is not permitted by statutory regulation or exceeds the permitted use, you will need to obtain permission directly from the copyright holder. To view a copy of this licence, visit http:// creativecommons.org/licenses/by-nc-nd/4.0/.
The Author(s) 2025