¶ Cell Reports Methods
¶ Human neuromuscular organoids mimic cancerinduced muscle cachexia
¶ Graphical abstract
¶ Authors
Pietro Chiolerio, Beatrice Auletta, Camilla Pezzini, …, Marco Sandri, Roberta Sartori, Anna Urciuolo
¶ Correspondence
roberta.sartori@unipd.it (R.S.), anna.urciuolo@unipd.it (A.U.)
¶ In brief
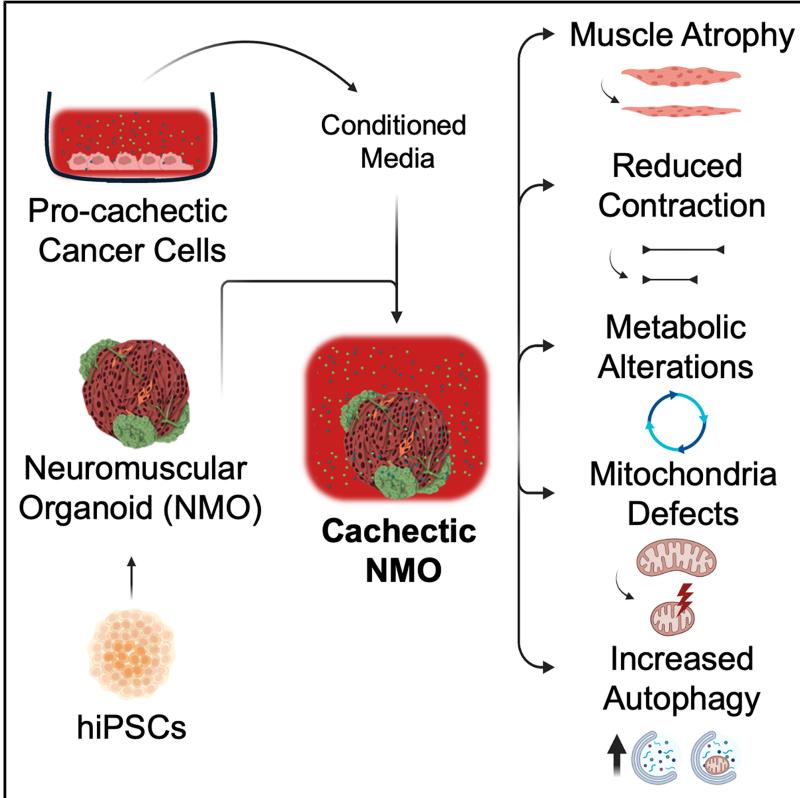
Chiolerio et al. introduce neuromuscular organoids derived from human-induced pluripotent stem cells as an innovative in vitro platform to model cancer-induced muscle wasting. The organoids recapitulate key features of muscle cachexia, providing a multicellular, physiologically relevant human model to investigate underlying mechanisms and develop potential therapeutics.
¶ Highlights
• hiPSC-derived NMOs mature and respond to genetically induced muscle atrophy
• NMOs mimic cachectic muscle morphology and function under pro-cachectic factors
• Cachectic NMOs show cancer cachexia metabolic, mitochondrial, and molecular features
• NMOs offer a platform to study mechanisms and test potential cachexia therapies
¶ Human neuromuscular organoids mimic cancer-induced muscle cachexia
Pietro Chiolerio,1,2,13 Beatrice Auletta,1,2,3,13 Camilla Pezzini,4,5 Luigi Sartore,1,2 Giorgia Gregolon,1,2 Onelia Gagliano,3,5 Cecilia Laterza,4,5 Valeria Roxana Balmaceda Valdez,4,5 Davide Cacchiarelli,6,7,8 Camilla Luni,9 Carlo Viscomi,4,5 Melanie Planque,10 Sarah-Maria Fendt,11,12 Marco Sandri,4,5 Roberta Sartori,4,5,14, * and Anna Urciuolo1,2,14,15, *
1 Department of Molecular Medicine, University of Padova, Via G. Colombo 3, 35131 Padova, Italy
2 Neuromuscular Engineering Lab, Istituto di Ricerca Pediatrica, Citta` Della Speranza, Corso Stati Uniti 4/F, 35127 Padova, Italy
3 Department of Industrial Engineering, University of Padova, Via Gradenigo 6/a, 35131 Padova, Italy
4 Department of Biomedical Sciences, University of Padova, Via Ugo Bassi 58/B, 35131 Padova, Italy
5 Veneto Institute of Molecular Medicine, Via Orus 2, 35129 Padova, Italy
6 Telethon Institute of Genetics and Medicine (TIGEM), Armenise/Harvard Laboratory of Integrative Genomics, Via Campi Flegrei 34, 80078 Pozzuoli, Italy
7 Department of Translational Medicine, University of Naples ‘‘Federico II’’, Naples, Italy
8 Genomics and Experimental Medicine Program, Scuola Superiore Meridionale (SSM, School of Advanced Studies), Naples, Italy
9 Department of Civil, Chemical, Environmental and Materials Engineering (DICAM), University of Bologna, Via Terracini 28, 40131 Bologna, Italy
10 Spatial Metabolomics Expertise Center, VIB Center for Cancer Biology, VIB, Leuven, Belgium
11 Laboratory of Cellular Metabolism and Metabolic Regulation, VIB Center for Cancer Biology, VIB, Leuven, Belgium
12 Laboratory of Cellular Metabolism and Metabolic Regulation, Department of Oncology, KU Leuven and Leuven Cancer Institute (LKI), Leuven, Belgium
13 These authors contributed equally
14 These authors contributed equally
15 Lead contact
* Correspondence: roberta.sartori@unipd.it (R.S.), anna.urciuolo@unipd.it (A.U.)
https://doi.org/10.1016/j.crmeth.2026.101331
MOTIVATION The study of mechanisms behind cancer-induced muscle cachexia is a significant challenge. Currently available in vivo and in vitro models are limited and do not allow the study of cachexia in a context that is relevant to patients. We therefore sought to develop a multicellular, three-dimensional (3D) in vitro model derived from human cells that recapitulates the phenotypes observed in a cachectic muscle, including impairment of muscle contraction and cellular and molecular alterations.
¶ SUMMARY
Cancer cachexia, a devastating metabolic wasting syndrome affecting up to 80% of solid cancer patients, remains incurable despite advances in tumor biology understanding. This study introduces neuromuscular organoids (NMOs) derived from human-induced pluripotent stem cells (hiPSCs) as a platform to investigate cancer-driven muscle cachexia. We found that NMOs respond well to atrophic stimuli and replicate the key features of cancer cachexia when treated with conditioned media derived from cachexia-inducing cancer cells. Specifically, cachectic NMOs showed muscle mass loss, impairment of muscle contraction, alteration of intracellular calcium homeostasis, appearance of mitochondrial dysfunction with a metabolic shift, and enhancement of autophagy. Based on these results, we propose NMOs derived from hiPSCs as an in vitro tool for investigating human muscle cachexia, with potential future avenues of patient-specific modeling and therapeutic screening.
¶ INTRODUCTION
Despite last decade’s key improvements in understanding tumor biology, cancer cachexia, a metabolic syndrome causing weight loss and tissue wasting, remains an incurable condition. It affects 80% of patients with solid cancers1–4 and accounts for up to 30% of cancer deaths.2,5 Though considered a late-stage event, many patients already experience weight loss at diagnosis.2,5 The loss of skeletal muscle mass and strength is a relevant clinical event in cancer cachexia and predicts poor outcomes.1,6 Nutritional supplementation cannot reverse cachexia, and no effective treatment currently exists.1,2
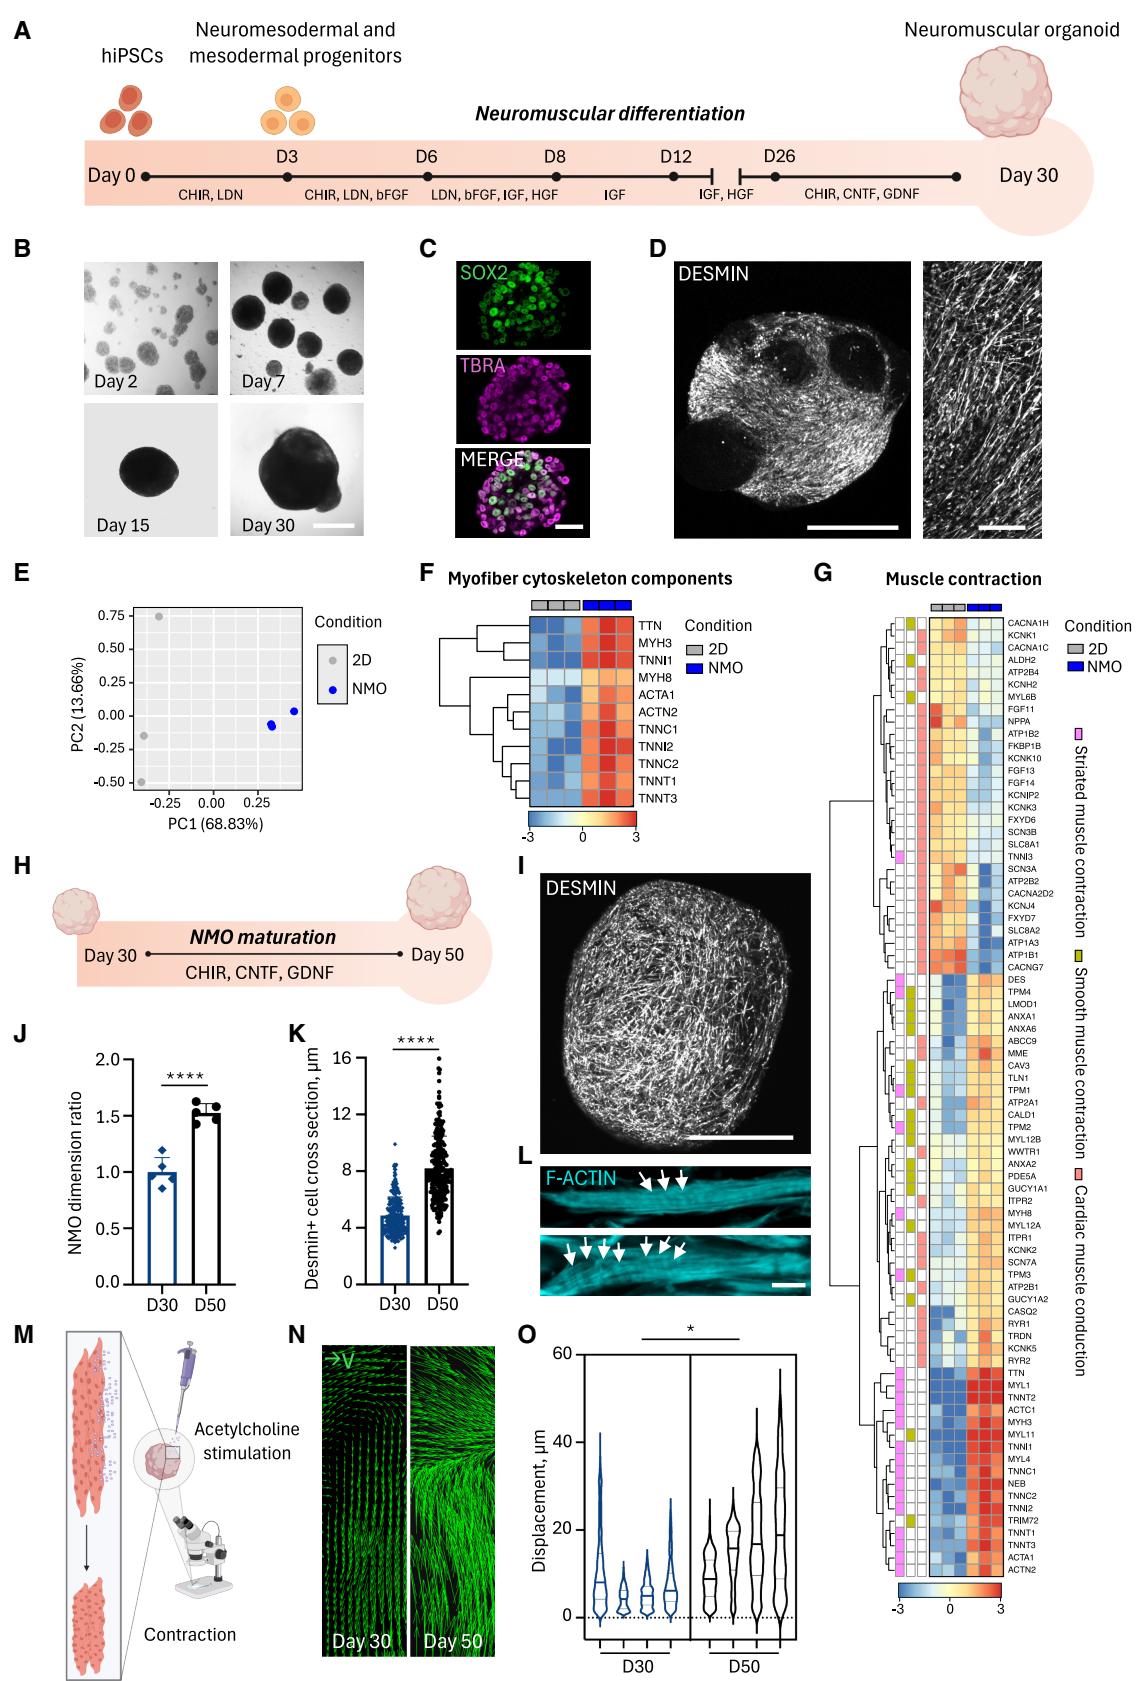
Figure 1. NMOs derived from hiPSCs show functional muscle improvement after 50 days of differentiation
(A) Schematic representation of the differentiation protocol used to obtain hiPSC-derived NMOs up to day 30; key medium change time points are indicated.
(B) Representative bright-field images showing morphological progression at days (D) 2, 7, 15, and 30. Scale bar, 500 μm.
© Confocal immunofluorescence showing SOX2 and TBRA expression in progenitor cells at day 2. Scale bar, 30 μm.
(D) zstack confocal images of 30-day NMOs stained for desmin (white). Scale bar, 750 μm (left) and 200 μm (right).
(E) PCA of 2D versus NMO samples, each dot representing one sample. Extended data reported in Data S1.
(F and G) Hierarchical clustering with heatmap visualization of DEGs related to myofiber cytoskeletal components (F) and to Reactome Muscle Contraction (G). Extended data reported in Data S1.
(H) Schematic representation of NMO maturation from 30-days to 50-days.
(I) z stack confocal image of 50-day NMO stained for desmin (white). Scale bar, 750 μm.
(J) Organoid area ratio between 30-day (D30) and 50-day (D50) NMOs. Data are shown as mean ± SD of 5 independent NMOs per condition. Unequal variance Student’s t test; ****p < 0.0001.
(K) Quantification of desmin+ cross-sections. Data are shown as mean ± SD of ≥3 images of 8 NMOs (240 myotubes per condition). Unequal variance Student’s t test; ****p < 0.0001).
(L) F-actin staining showing sarcomeric organization at D50 (arrowheads). Scale bar, 5 μm.
(M) Schematic representation of ACh-induced contractility test.
(N) Representative vector maps of maximum displacements of D30 and D50 NMOs upon ACh stimulation. The regions of interest shown have identical dimension.
(O) Violin plot of maximum displacement of D30) and D50 NMOs upon ACh stimulation. Each violin represents the mean of maximum displacement sizes in a single NMO (4 NMOs per condition; ≥650 events/NMO). Nested two tail t test; *p = 0.0222).
See also Data S1, S2, and Video S1.
Studies in murine models show that cancer cachexia is driven by increased muscle protein breakdown via ubiquitin-proteasome (UPS) and autophagy-lysosome systems.7–9 However, it remains unclear what initiates cachexia in patients, why some cancers cause it while others do not, and why some precachectic patients progress to overt cachexia.1 Cancer-induced secreted systemic factors, including those transported into extracellular vesicles,10 can trigger and sustain muscle wasting1,4 by impairing host metabolism,11 inducing muscle catabolism and inhibiting protein synthesis.2,4 Importantly, preserving muscle mass in tumor-bearing mice prolongs survival independently on tumor growth,12 highlighting skeletal muscle as key therapeutic target for counteracting cachexia onset.
Developing effective therapeutical strategies for cancerdriven muscle cachexia in patients requires addressing fundamental unanswered questions. Current investigation methods are limited by the complexity to directly study these mechanisms in patients and by species-specific differences when using animal models.13,14
Advances in pluripotent stem cell and organoid technologies15 enable generating 3D skeletal muscle models from humaninduced pluripotent stem cells (hiPSCs), including patient-specific organoids that reproduce skeletal muscle structure and function.16–26 Organoids containing functional human neuronal and muscle compartments (hereafter referred to as neuromuscular organoids [NMOs]) have been used to mimic conditions like myasthenia gravis,26 amyotrophic lateral sclerosis,20,23 and Duchenne muscular dystrophy.16 Despite hiPSC origin, myotubes in NMOs reach high maturity levels, probably due to 3D organization coupled with the multicellular complexity and trophic factors released by other cell types.16–26
Here, we propose hiPSC-derived self-assembled NMOs as an in vitro tool to study metabolic changes and muscle remodeling/ plasticity in cachectic muscles. We showed that in NMOs myotubes respond to genetically induced atrophic stimuli. When treated with conditioned media (CM) from cachexia-inducing (but not with non-cachexia-inducing) cancer cells, NMOs reproduced key features of cachectic muscles like muscle mass loss, impaired contraction, intracellular calcium dysregulation, mitochondrial dysfunction, and increased autophagy. These findings suggest that NMOs offer an innovative in vitro human muscle model for investigating cachexia. This approach opens new avenues for unraveling the cachexia pathogenic mechanisms, potentially in a personalized manner, and for evaluating therapeutic interventions.
¶ RESULTS
¶ NMOs recapitulate a functional skeletal muscle
To generate NMOs, hiPSCs were seeded as single cells onto Matrigel droplets and directly differentiated into self-assembled spheroids, according to published differentiation protocol16,19 (Figures 1A and 1B). Two days after seeding and before the differentiation, hiPSCs expressed pluripotency markers like octamer-binding transcription factor 4 (OCT4), homeobox protein NANOG, and SRY-box transcription factor 2 (SOX2; Figures S1A and S1B). Two days after the beginning of the differentiation, the cells lost OCT4 and NANOG expression (Figures S1C and S1D), but co-expressed the neuromesodermal progenitor key determinant transcriptional factors SOX2 and mesoderm-induction T-box transcription factor brachyury (TBRA; i.e., TBRA+ SOX2+ ), or only the mesodermal progenitor marker TBRA16,19,27–32 (i.e., TBRA+ SOX2− ; Figures 1C and S1D). After 30 days of differentiation, NMOs showed clusters of neuronal cells and an extensive area of elongated, desminpositive muscular cells (Figures 1D and S1E). To assess terminally differentiated myogenic cells in NMOs 30 days after differentiation, we analyzed their transcriptional profiles compared to an in vitro model in which the neuromuscular differentiation was performed in two-dimensional (2D) conditions.16 Principal component analysis (PCA) of transcriptomic data highlighted distinct separation of 2D and NMO samples (Figure 1E and Data S1). Both the samples expressed myofibers/skeletal muscle contraction genes, but NMOs upregulated genes related to myofiber cytoskeleton components and skeletal muscle contraction, but not cardiac muscle conduction, compared to 2D samples (Reactome datasets; Figures 1F and 1G; Data S1), confirming improved skeletal muscle differentiation in the 3D system.
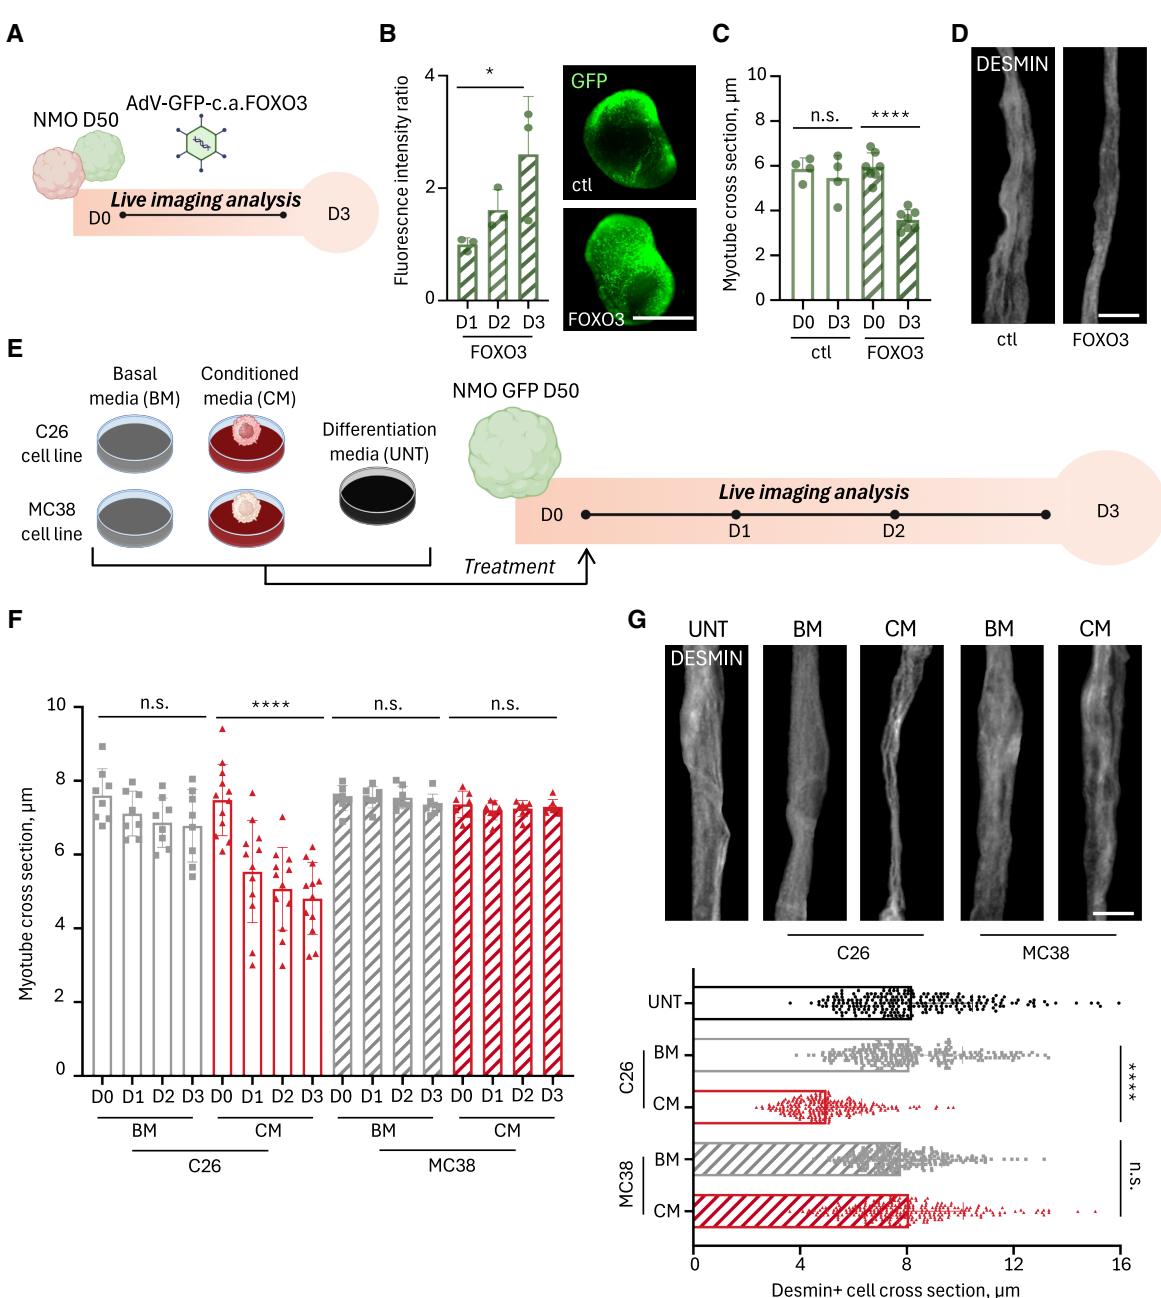
Figure 2. NMOs respond with muscle atrophy to genetic and soluble cachectic stimuli
(A) Schematic timeline showing treatment of 50-day NMOs derived from hiPSCs or GFP+ hiPSCs with AdV-GFP-c.a.FOXO3 or control AdV-GFP. (B) Left, GFP fluorescence intensity ratio at days 1, 2, and 3 (D1–D3) post-infection in NMOs derived from hiPSCs. Data are shown as mean ± SD of ≥3 images per NMO; each dot represents a single NMO. Ordinary one-way ANOVA; *p = 0.0477. Right, representative stereomicroscope images of NMOs infected with AdVGFP (top) and AdV-GFP-c.a.FOXO3 (bottom) at D3. Scale bar, 1 mm.
© Quantification of GFP+ myotube cross-sections before (D0) and after 3 days (D3) of infection with AdV-GFP-c.a.FOXO3 or control virus. Data are shown as mean ± SD of average myotube diameters per NMO (≥20 cross-sections, 3 images/NMO, and ≥4 NMOs per condition). Ordinary one-way ANOVA; ****p < 0.0001, see also Data S2.
(D) Representative immunofluorescence images of desmin+ (gray) myotubes in NMOs 3 days after infection with AdV-GFP-c.a.FOXO3 or control virus. Masks highlight single myotubes. Scale bar, 7 μm.
(E) Schematic of 50-day GFP+ NMO treatments with basal media (BM) and CM from C26 (cachectic) and MC38 (non-cachectic) murine colon cancer cell lines. UNT (untreated) NMOs cultured in differentiation medium were used as control. Treatments lasted 3 days (D50–D53), with time-course imaging when indicated.
(F) Quantification of GFP+ myotube diameters before (D0) and during the 3 days of treatments (D1–D3) with C26- or MC38-CM/BM. Data are shown as mean ± SD of ≥7 NMOs per condition (≥20 cross-sections and 3 images/NMO). Ordinary one-way ANOVA; ****p < 0.0001, see also Data S2. The C26-BM/CM quantifications are compared to UNT quantifications in Figure S2E.
(G) Upper: representative immunofluorescence images of desmin+ (gray) myotubes in GFP+ NMOs treated with C26- and MC38-CM/BM or UNT. Masks highlight single fibers. Scale bar, 7 μm. Lower: quantification of desmin+ cross-sections. Data are shown as mean ± SD of ≥3 images/NMO (8 NMOs/condition, and 240 myotubes/condition). Ordinary one-way ANOVA; ****p < 0.0001, see also Data S2.
Based on findings that longer time of culture improves organoids maturation,20,23,25,26 we extended NMO culture to 50 days of differentiation (Figures 1H, 1I, and S1F). Compared to 30-day NMOs, 50-day NMOs had significantly increased size (Figure 1J), muscle compartment area (Figure S1G), and myotube cross-sections (Figure 1K), with presence of sarcomeric structures (Figures 1L and S1H), suggesting an improved maturation of the skeletal muscle. In accordance with previous studies16,19 and the previous analysis (Figures S1E and S1F), the presence of neurons in 50-day NMOs was confirmed by the gene expression of TUBB3 and MAP2 (Figure S1I and Data S2), neuronal functional activity (Figure S1J and Video S1), and detection of juxtaposed pre- and post-synaptic elements of the NMJ (Figure S1K). Finally, to confirm that the morphometric differences between 30-day and 50-day NMOs could be reflected at functional level, we performed functional analysis of the skeletal muscle. We treated NMOs with acetylcholine (ACh) to stimulate myotube contraction (Figure 1M; Video S1). Imaging analysis by particle velocimetry analysis (PIVlab)16,19 showed that 50-day NMOs contracted more than 30-day NMOs, as depicted by vector maps, mean maximum displacement (Figures 1N, 1O, S1L, S1M, and S1N), and displacement spatial distribution (Figures S1L, S1M, and S1N).
.gif)
Video S1. Functional activity of untreated D30 and D50 NMOs and treated D50 NMOs, Related to Figures 1, 3, S1 and S3
D50 NMO neural functionality was assessed by (MEA) analysis, while live imaging contraction of NMOs after acetylcholine (Ach) administration was revealed via live imaging analysis.
Together these data demonstrate that 50-day NMOs mimic functional human skeletal muscle in vitro, suggesting their potential application to studying muscle plasticity and pathophysiology.
¶ NMOs are genetically manipulable and respond to cachectic stimuli
Aiming to develop a mature skeletal muscle model for examining muscular responses in cachectic conditions, we focused on the muscle compartment in 50-day NMOs. We first investigated whether NMO skeletal muscles responded properly to wellknown atrophic stimuli,4 by overexpressing constitutively active (c.a.) forkhead box O3 transcription factor (FOXO333) via Adenovirus (AdV) infection (Figure 2A). We optimized adenovirus doses and timing for NMO infection, using empty viruses (AdV-ctl) as negative control. Both AdV-ctl and AdV c.a.FOXO3 drove GFP expression,33 confirming successful infection by increased GFP over time (Figures 2B and S2A). With the aim to evaluate morphometric parameters of the myotubes during the time of treatments via live imaging, we also included GFP+ -hiPSCs19 to generate GFP-NMOs (Figure S2B). Remarkably, c.a.FOXO3 overexpression significantly reduced myotube size compared to AdV-ctl in treated NMOs (Figures 2C, 2D, and S2C; Data S2), mimicking FOXO3-dependent adult skeletal muscle atrophy.33 These results support the use of D50 NMOs as an in vitro model for studying skeletal muscle adaptations to atrophic stimuli, as those expected to be observed in a context of muscle cachexia.
To test this hypothesis, we exposed NMOs for 3 days to CM from cachexia-inducing C26 colon cancer cell lines34,35 or noncachexia-inducing MC38 colon cancer cells36,37 (Figure 2E). NMOs kept in optimal differentiation media (untreated, UNT) or treated with the cancer cells growing medium (basal medium, BM) were used as controls (Figure 2E). We did not observe macroscopic differences among organoids before and after the treatments (Figure S2D). However, C26-CM treatment significantly reduced myotube size over time compared to MC38-CM, BM, and UNT controls (Figures 2F and S2E; Data S2). Importantly, C26-CM-mediated atrophic phenotype was observed in NMOs generated from two different hiPSC lines (Figure S2F; Data S2). We further quantified myotube cross-sections in C26-CM treated NMOs via desmin+ immunofluorescence imaging analysis after 3 days of treatments, corroborating live imaging data (Figures 2G, S2G, and S2H; Data S2). C26-CM also increased cell death events (Figure S2I; Data S2), and decreased the total muscle area in cachectic NMOs (Figure S2J; Data S2). Lack of atrophy in NMOs treated with non-cachexiainducing36,37 MC38-CM indicated that the C26-CM phenotype was related to its cachexia-inducing secretome, not to tumor secretome per se.
Altogether, these data show that hiPSC-derived NMOs properly react to atrophic/pro-cachectic stimuli, suggesting their utility for studying in vitro human skeletal muscle physiopathology in cancer-cachexia.
¶ NMOs display functional impairment upon C26 CM treatment
Since NMOs contracted upon ACh administration (Figures 1N and 1O), we tested the functional effects of C26-CM treatment (Figure 3A). While ACh-induced contraction in all samples (Video S1), C26-CM treatment significantly reduced NMO contraction compared to controls, shown by vector maps, decreased mean maximum displacements (Figures 3B, 3C, and 3D; Data S2), increased percentage of small (<5 μm) and reduced percentage of large (>15 μm) displacement events (Figures 3E and S3A; Data S2). Polar chart also revealed altered contraction coordination in C26-CM treated NMOs, as shown by evaluating displacement magnitude and direction simultaneously (Figures 3F and S3B). We next monitored calcium homeostasis, critical for muscle contraction,38 in myotubes of UNT, C26-BM and C26-CM treated non-GFP expressing NMOs loaded with Fluo-4 calcium dye during ACh stimulation. Quantification of calcium flux upon ACh-induced contraction by Fluo-4 live imaging revealed altered calcium handling, confirming functional impairment in cachectic organoids (Figures 3G, 3H, and S3C; Data S2).
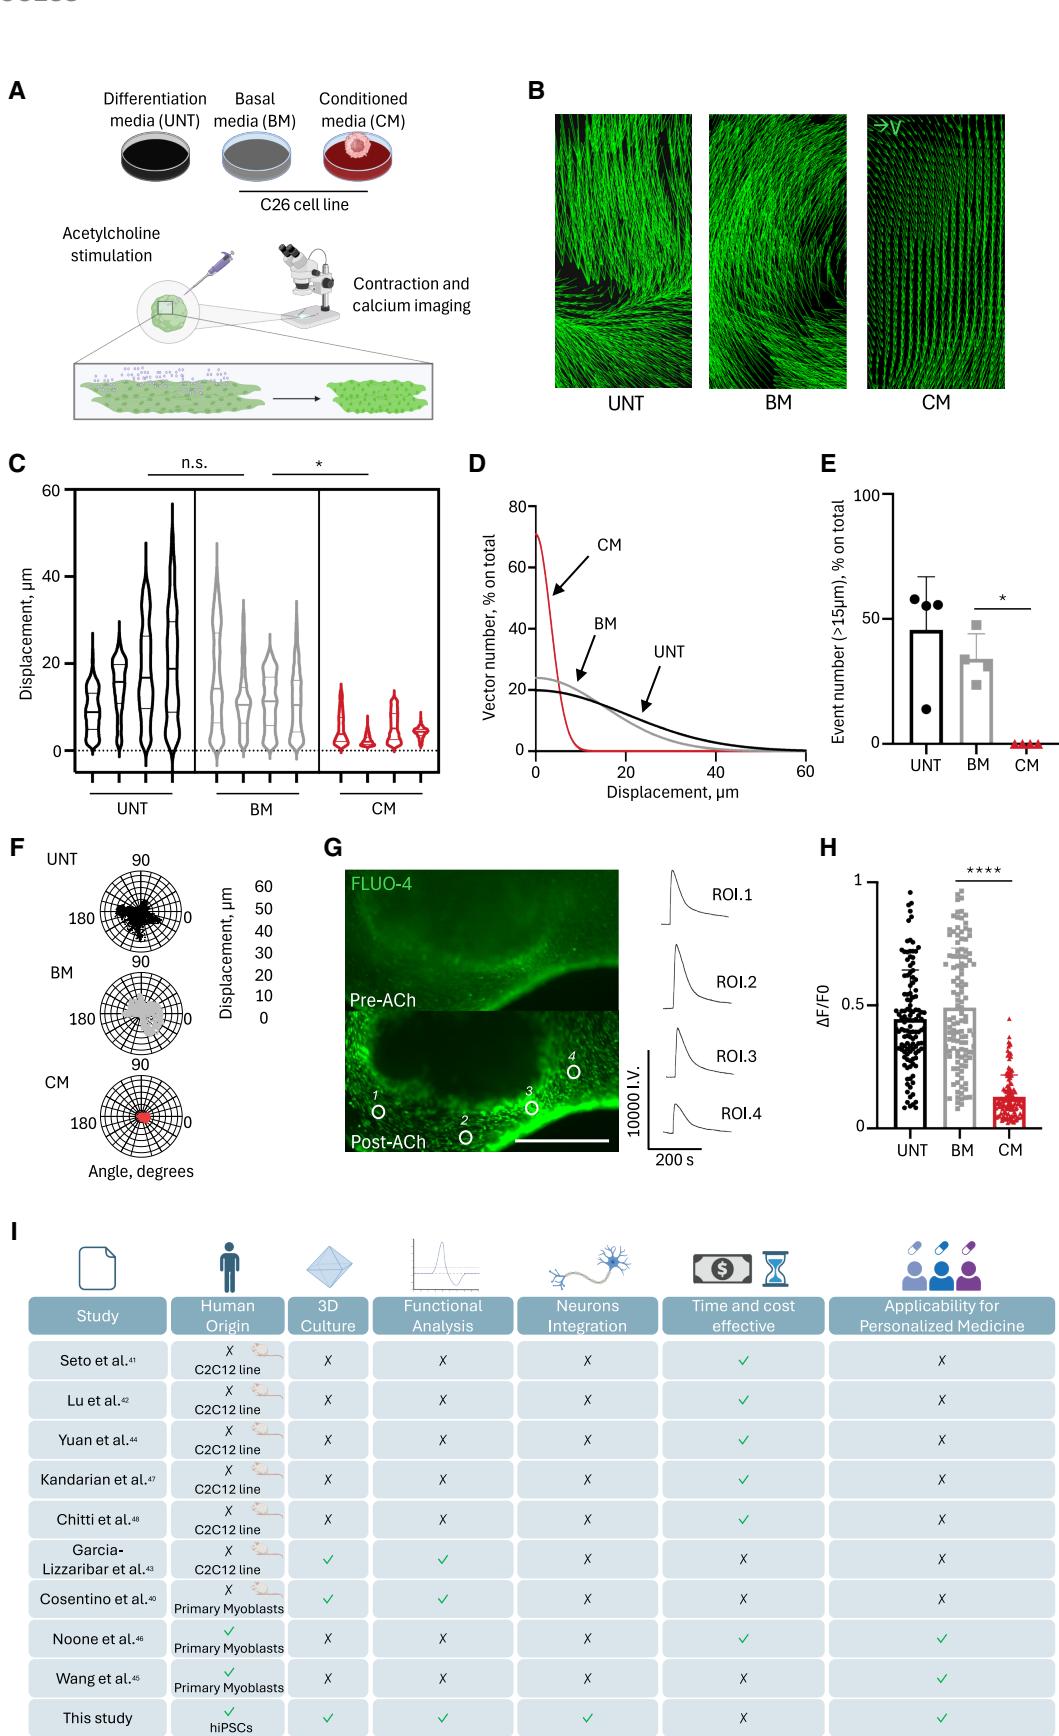
Figure 3. Cachectic NMOs show reduced muscle functionality
(A) Schematic illustration of the strategy used to test muscle functionality of GFP+ NMOs via direct ACh stimulation following C26-derived BM and CM treatments. UNT condition was included as control.
(B) Representative vector maps of ACh-induced displacements recorded during contraction of GFP+ NMOs after C26-BM/CM treatments and untreated (UNT) condition. Identical region of interest areas were considered among the samples.
© Violin plot showing maximum ACh-induced displacements in GFP+ NMOs after C26-BM/CM treatments and in UNT NMOs. Each violin represents the mean of maximum displacement size in a single NMO (4 NMOs per condition; ≥655 events/NMO). Nested one-way ANOVA; *p = 0.0173, see also Data S2.
(D) Gaussian interpolation of displacement frequency distributions (0–60 μm and 5 μm bins) in GFP+ NMOs UNT or treated with C26-BM/CM upon ACh stimulation.
(E) Frequency distribution of displacements >15 μm in GFP+ NMOs after C26-derived BM/CM treatments and in UNT samples. Data are shown as mean ± SD of 4 NMOs/condition and each dot indicates a single NMO. Ordinary one-way ANOVA; **p = 0.0011; *p = 0.0124, see also Data S2.
(F) Representative polar charts of maximum displacement (μm) and directionality (degrees) of GFP+ NMOs upon ACh stimulation after C26 BM/CM treatments and in UNT samples.
(G) Left: single live imaging frames (Fluo-4) of GFP+ NMO before and after ACh stimulation. Scale bar, 500 μm. Right: representative traces showing calcium transient amplitudes across independent ROIs.
(H) Quantification of calcium peak amplitudes (ΔF/F0) from Fluo-4 imaging in GFP+ NMOs after C26-derived BM/CM treatments and in UNT NMOs. Data are shown as mean ± SD of 120 measurements from 4 NMOs/condition. Ordinary one-way ANOVA; ****p < 0.0001, see also Data S2.
(I) Comparative scheme summarizing NMOs and other in vitro models of cancer-induced muscle cachexia, highlighting relative advantages and limitations (green ticks = present; black crosses = absent).
See also Data S2 and Video S1.
Altogether, these data proved that NMOs model human skeletal muscle (dys)functionality upon exposure to cachectic secreted factors. Despite higher costs and longer cell culture time, when evaluating key criteria for modeling and studying cancer-induced muscle cachexia in vitro, such as species of origin, spatial organization, functional analysis capability, neuronal integration, and potential for personalized medicine applications, our NMO platform meets all these requirements, when compared to currently available in vitro models39–47 (Figure 3I).
¶ NMOs treated with C26 CM showed metabolic alterations and mitochondrial dysfunction
Since disrupted energy metabolism,48–50 altered mitochondria morphology and function51–53 and increased autophagy54,55 are critical aspects of cachexia, we monitored these features in NMOs. Spatial metabolomics revealed enrichment of TCA cycle intermediates (e.g., citrate/isocitrate and malate) in C26-CM treated cachectic NMOs compared to controls (Figures 4A, 4B, and S4A; Data S3), supporting bioenergetics impairment. Next, we investigated mitochondrial morphology and function. Electron microscopy revealed elongated mitochondria with regular cristae in control NMOs (i.e., UNT and C26-BM), while cachectic NMOs showed small, fragmented, and electron dense mitochondria in which cristae were difficult to recognize (Figure 4C). Imaging analysis of immunofluorescence co-staining for the mitochondrial import receptor subunit (TOM20) and for myosins confirmed increased mitochondrial fragmentation in cachectic myotubes, as quantified by mitochondria analyzer plugin56 (Figures 4D, S4B, and S4C; Data S2). Analysis of oxygen flux by using Oroboros O2k in single organoids showed that mitochondria respiration normalized for DNA-mitochondria content was reduced under basal condition and upon complex I/II substrate administration in cachectic NMOs (Figures 4E, 4F, S4D, and S4E; Data S2). This was also associated with decreased mitochondria content and TOM20 fluorescence intensity in myotubes, when compared to UNT and C26-BM samples (Figures S4E and S4F; Data S2).
Because fragmented and decreased mitochondrial content and atrophy can result from increase autophagy,54,55 we monitored this proteolytic system. Increased lysosomal associated membrane protein 1 (LAMP1)/TOM20 co-localization in C26- CM myotubes suggested elevated mitophagy (Figures 4G and S4G; Data S2), as also suggested by electron microscopy showing mitochondria within vesicles in cachectic NMOs (Figure 4H). Cachectic myotubes also had significantly more puncta of autophagic markers sequestosome 1 (p62) or microtubule-associated protein 1 light chain 3 beta (LC3B),4,54,55 compared to controls, indicating increased autophagy (Figures 4I and 4J; Data S2).
Altogether, these data showed that NMOs recapitulate key features characterizing cancer cachexia-induced muscle wasting, including myofiber atrophy, decreased contraction, mitochondrial dysfunction, and increased autophagy. Consequently, NMOs represent a human skeletal muscle in vitro model for investigating pathogenetic hypotheses and therapeutic approaches relevant to cachectic patients.
¶ DISCUSSION
Cancer cachexia, characterized by muscle loss, with or without fat loss, severely impacts quality of life, reduces chemotherapy response, and decreases overall survival, but lacks effective therapies,2,14,50,57–59 partly due to limitations of animal models in recapitulating human pathophysiology.13,60 There is a critical need for 3D in vitro human models to study muscle cachexia mechanisms and develop translational approaches,13,60 and to minimize the use of animals.39 NMOs have been reported to mimic human skeletal muscle in health and disease,16,18–21,23,25,26 but no studies until now used NMOs to model cancer-induced muscle cachexia.
We introduce hiPSC-derived NMOs as a 3D in vitro model of human skeletal muscle to investigate cancer-driven muscle cachexia.
The hiPSC-derived NMOs demonstrated a functional skeletal muscle compartment. The 3D structure promoted muscle maturation compared to 2D cultures.61,62 Moreover, D50 NMOs showed increased myotube size and muscle contraction upon ACh stimulation, when compared to D30 NMOs, indicating progressive maturation over time.20,23,25,26 The multicellular complexity of NMOs, including neuronal components, provides a physiologically relevant environment better recapitulating key homeostatic muscle responses.16,18–21,23,25,26
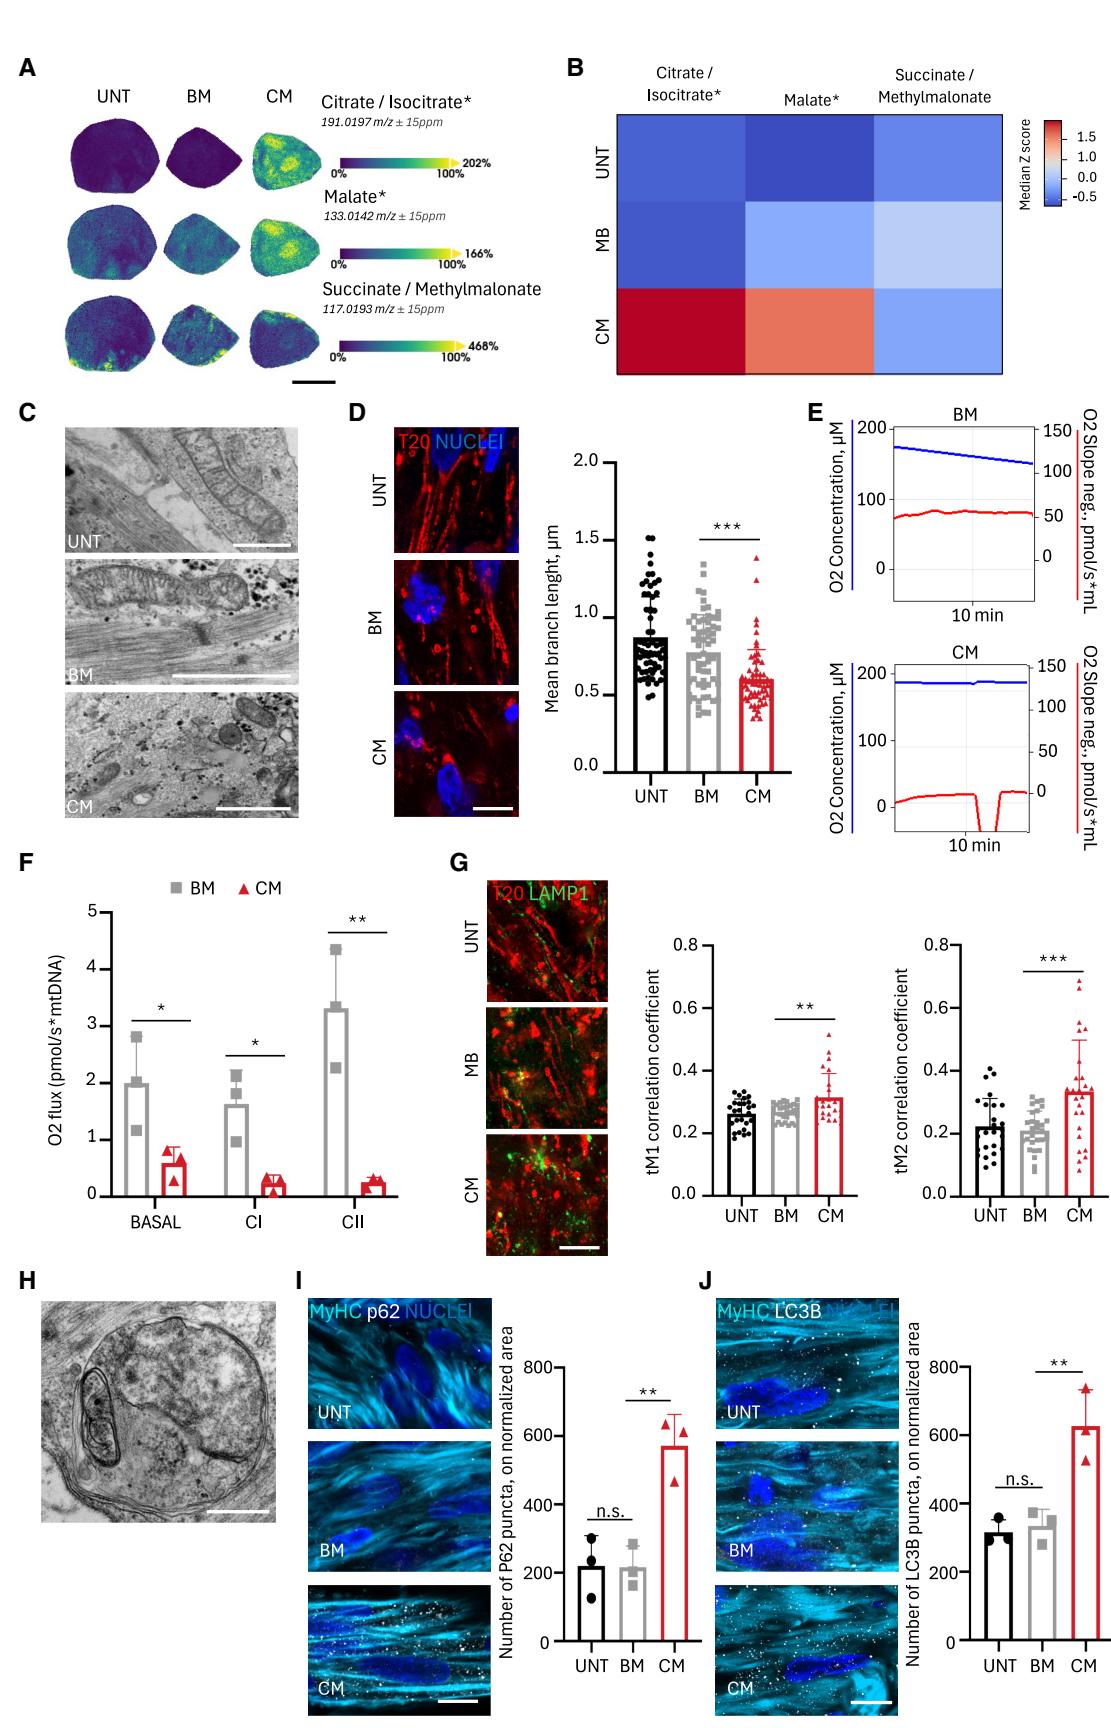
Figure 4. Cachectic NMOs display molecular and mitochondrial alterations typical of muscle cachexia
(A) Spatial metabolomic maps showing the distribution of TCA-associated metabolites in NMO sections after C26-derived BM and CM treatments. UNT condition was included as control. Scale bar, 500 μm. Extended data reported in Data S3.
(B) Heatmap quantification of TCA-related metabolites in NMO after C26-derived BM/CM treatments and in UNT NMOs. Extended data reported in Data S3. © Representative electron microscopy images showing mitochondrial morphology in NMOs after C26 BM/CM treatments and UNT. Scale bars, 1 μm. (D) Left: confocal immunofluorescence image showing TOM20 (T20) in the myotubes of NMOs after C26 BM/CM treatments and in UNT NMOs. Scale bars, 8.5 μm. Right: quantification of mitochondrial branch length within myotubes. Representative images of co-staining with MyHC+ to identify myotubes are reported in Figure S2B. Data are shown as mean ± SD of ≥10 images from 3 NMOs/condition. Ordinary one-way ANOVA; ****p < 0.0001, see also Data S2. (E) Representative Oroboros trace showing O2 concentration and consumption rate during basal respiration in NMOs after C26 BM/CM treatments. (F) Specific O2 flux measurements in NMOs exposed to BM and CM. Complex I and II respiration evaluated under substrate-specific conditions. Data are mean ± SD of three independent experiments (n = 3). Unequal variance Student’s t test: *p < 0.05, *p < 0.01; see also Data S2.
(G) Left: confocal immunofluorescence of TOM20 (T20) and LAMP1 in NMOs after C26 BM/CM treatments and in UNT NMOs. Scale bars, 8.5 μm. Quantification of colocalization coefficient tMCC1 on T20 (middle) and tMCC2 on LAMP1 (right). Data are shown as mean ± SD of ≥8 images from 3 NMOs/condition. One way ANOVA; middle, **p = 0.0049; right, ***p = 0.0003), see also Data S2.
(H) Electron microscopy showing mitochondria within vesicles in NMOs treated with C26 CM. Scale bars, 500 nm.
(I) Left: confocal immunofluorescence showing MyHC (cyan) and p62 (gray) in NMOs after C26 BM/CM treatments and UNT. Scale bars, 7.5 μm. Right: quantification of p62 puncta within MyHC+ ROIs. Data are shown as mean ± SD of ≥ 8 images for 3 NMOs/condition. One way ANOVA; **p = 0.0042, see also Data S2.
(J) Left: confocal immunofluorescence showing MyHC (cyan) and LC3B (gray) in NMOs after C26 BM/CM treatments and UNT. Scale bars, 7.5 μm. Right: quantification of LC3B puncta within MyHC+ ROIs (3 NMOs/condition). Data are shown as mean ± SD of ≥ 8 images for 3 NMOs/condition. One way ANOVA; **p = 0.0055, see also Data S2.
See also Data S2 and S3.
NMOs responded as expected to atrophic stimuli previously tested in adult murine muscle,31 confirming their ability to model dynamic pathology-related catabolic states. Crucially, when treated with CM from cachexia-inducing but not from noncachexia-inducing cancer cells, NMOs displayed all hallmarks of muscle wasting in cachexia such as reductions of muscle mass and contraction, alterations of intracellular calcium homeostasis, appearance of mitochondrial fragmentation and dysfunction, and increased autophagy.48–50,54,55,63 Particularly noteworthy is the ability of NMOs to capture the complex interplay between increased autophagy and mitochondrial dysfunction in cachectic muscle, mirroring findings from in vivo cancer cachexia studies.54,55 This includes increased autophagy markers (p62 and LC3B), evidence of mitophagy (LAMP1 and TOM20 co-localization), and altered mitochondrial morphology/function upon treatment with cachexia-inducing cancer cell media. This suggests that our model could be particularly useful for investigating the role of specific pathways involved in muscle wasting, potentially leading to the discovery of new therapeutic targets. Indeed, the genetic manipulability of NMOs enables studying gain and loss of function approaches, opening possibilities not only for mechanistic studies but also for targeted interventions to counteract muscle wasting.
Since muscle weakness is a key clinical event in patients during cancer growth,2 the functional defects and presence of a neuronal component make NMOs particularly relevant for modeling neuromuscular cross-talk in cachexia37 and evaluating therapeutics. Compared to other hiPSC-derived NMOs,20,21,23,25,26 NMOs generated in this study offer an operator-friendly, time/cost-effective approach without the requirement of pre-differentiation steps allowing expansion of the NMOs in the first stages of differentiation. It would be valuable to investigate whether NMO derived with other protocols could replicate the feature observed in our platform, thus opening a broad opportunity for the scientific community to study muscle cachexia.
While the NMO replicates many features of cancer cachexia, it is important to acknowledge its limitations in fully recapitulating the complex systemic interactions present in a living organism. Future studies should focus on integrating NMOs with other relevant cell types/organoids to create a more comprehensive in vitro model capturing the inter-organ cross-talks involved in cachexia etiopathogenesis.
In conclusion, our hiPSC-derived NMO platform represents a significant advance for cancer cachexia research. It offers a promising human muscle model for investigating cachexia mechanisms and for developing/testing potential therapeutics, with the ability to study these processes in a patient-specific manner. As this model is further refined and expanded, we anticipate that it will play a crucial role in overcoming limitations of murine models to improve our understanding and treatment of this devastating muscle-wasting condition for cancer patients.
¶ Limitations of the study
Incomplete NMO differentiation and maturation could affect modeling of specific cachexia phenotypes. As an in vitro model, NMOs lack contributions from other organ systems, tumor microenvironment, and patient-specific signal heterogeneity that may influence cachexia pathogenesis.
¶ RESOURCE AVAILABILITY
¶ Lead contact
Requests for further information and resources should be directed to and will be fulfilled by the lead contact, Anna Urciuolo (anna.urciuolo@unipd.it).
¶ Materials availability
This study did not generate new unique reagents.
¶ Data and code availability
• Bulk RNA sequencing (RNA-seq) data are available at NCBI Gene Expression Omnibus (GEO: GSE226477). 2D samples (GSM7076294– GSM7076296) and NMO samples (GSM7076297–GSM7076299).
• Bioinformatic analysis has been performed with publicly available tools according to developers’ instructions.
• Any additional information required to reanalyze the data reported in this paper is available from the lead contact upon request.
¶ ACKNOWLEDGMENTS
We thank Prof. Nicola Elvassore for support with hiPSCs. This work was supported by Bando Direzione Scientifica IRP Citta` della Speranza (code 21/05), by Integrated Budget for Departmental Research from Dept of Molecular Medicine (BIRD2022) and by AIRC under MFAG 2023 (ID: 29118), and by Panciera Foundation to A.U.; by Integrated Budget for Departmental Research from Dept of Biomedical Sciences, University of Padua (BIRD 2023) to R.S. O.G. is supported by ERC-2023-STG OriSha (no. 101117759). C. Laterza is supported by ERC-2022-STG COnNect (no. 101077714). D.C. is funded by the Fondazione Telethon Core grant, the Armenise Harvard Foundation Career Development Award, and by the Italian Ministry of Health (Piano Operativo Salute Traiettoria 3, T3-AN-09, ‘‘Genomed’’; Ricerca Finalizzata 2021, ‘‘genOMICA’’; MCNT2 2023, ‘‘EUCARDIS’’), the Italian Ministry of University and Research and European Union (Next Generation EU - MUR-PRIN-2022 CUP 2022T7XP29, Project PNC 0000001 D3-4-Health). A.U., M.S. and C.V. are supported by the Progamme Project Telethon/Cariparo VIMM (ID: GSP24003). M.S. was supported by Next Generation EU, in the context of the National Recovery and Resilience Plan, Project CN00000041, CUP C93C22002780006, Spoke n. 4 ‘‘Metabolic and cardiovascular diseases,’’ and AIRC-IG (ID: 23257 and 30366). S.-M.F. acknowledges funding from Stichting Tegen Kanker (STK), FWO, and KU Leuven. Schematic illustrations in the graphical abstract (license #CE28ZKZ5M3) and Figures 1A, 1H, 1M, 2A, 2E, 3A, 3I, S2A, and S2B (license #HZ28ZKYR0Y) were created with BioRender.com.
¶ AUTHOR CONTRIBUTIONS
A.U. and R.S. designed the study and contributed equally; P.C. and B.A. performed differentiation experiments and all the analysis; C.P. contributed for media preparation from cancer cells and data interpretation; L.S. contributed to RNA-seq analysis, quantification of muscle contraction, and in graphical representation; G.G. contributed to calcium analysis and mitochondria morphology quantifications; O.G. performed cell reprogramming; C. Laterza generated GFP-hiPSCs; D.C. performed RNA-seq; C. Luni performed bulk RNA-seq data analysis and interpretation; B.A. contributed to spatial metabolic experiments; M.P. performed spatial metabolic experiments, metabolomic analysis, and data interpretation; V.R.B.V. performed Oroboros analysis; C.V., S.-M.F., and M.S. critically contributed to data interpretation. All the authors contributed to the revision of the manuscript. A.U. supervised the organoid production, characterization, and analysis upon treatments; A.U. and R.S. analyzed and interpreted the data, wrote the manuscript, and supervised the project.
¶ DECLARATION OF INTERESTS
The authors declare no competing interests.
¶ STAR★METHODS
Detailed methods are provided in the online version of this paper and include the following:
• KEY RESOURCES TABLE
• EXPERIMENTAL MODEL AND STUDY PARTICIPANT DETAILS
○ Human induced pluripotent stem cell derivation and culture
○ Differentiation and culture of hiPSCs
○ Culture of murine colon adenocarcinoma cell lines
• METHOD DETAILS
○ Treatment of NMO with C26 and MC38 conditioned media
○ Immunofluorescence analysis and image preparation
○ Live imaging analysis for contraction and calcium dynamics
○ Multi electrode array (MEA) assay
○ Live and dead analysis
○ AdV infection
○ RNA purification and RT-qPCR
○ Bulk sequencing analysis
○ Spatial metabolomics analysis
○ High-resolution respirometry
• QUANTIFICATION AND STATISTICAL ANALYSIS
¶ SUPPLEMENTAL INFORMATION
Supplemental information can be found online at https://doi.org/10.1016/j.
crmeth.2026.101331.
Received: October 1, 2025
Revised: November 13, 2025
Accepted: January 22, 2026
Published: February 17, 2026
¶ REFERENCES
- Fearon, K., Strasser, F., Anker, S.D., Bosaeus, I., Bruera, E., Fainsinger, R.L., Jatoi, A., Loprinzi, C., MacDonald, N., Mantovani, G., et al. (2011). Definition and classification of cancer cachexia: An international consensus. Lancet Oncol. 12, 489–495. https://doi.org/10.1016/S1470- 2045(10)70218-7.
- Baracos, V.E., Martin, L., Korc, M., Guttridge, D.C., and Fearon, K.C.H. (2018). Cancer-associated cachexia. Nat. Rev. Dis. Primers 4, 17105. https://doi.org/10.1038/nrdp.2017.105.
- Martin, A., and Freyssenet, D. (2021). Phenotypic features of cancer cachexia-related loss of skeletal muscle mass and function: lessons from human and animal studies. J. Cachexia Sarcopenia Muscle 12, 252–273. https://doi.org/10.1002/jcsm.12678.
- Sartori, R., Romanello, V., and Sandri, M. (2021). Mechanisms of muscle atrophy and hypertrophy: implications in health and disease. Nat. Commun. 12, 330. https://doi.org/10.1038/s41467-020-20123-1.
- von Haehling, S., Morley, J.E., and Anker, S.D. (2010). An overview of sarcopenia: facts and numbers on prevalence and clinical impact. J. Cachexia Sarcopenia Muscle 1, 129–133. https://doi.org/10.1007/ s13539-010-0014-2.
- Wesseltoft-Rao, N., Hjermstad, M.J., Ikdahl, T., Dajani, O., Ulven, S.M., Iversen, P.O., and Bye, A. (2015). Comparing two classifications of cancer cachexia and their association with survival in patients with unresected pancreatic cancer. Nutr. Cancer 67, 472–480. https://doi.org/10.1080/ 01635581.2015.1004728.
- Sandri, M. (2016). Protein breakdown in cancer cachexia. Semin. Cell Dev. Biol. 54, 11–19. https://doi.org/10.1016/j.semcdb.2015.11.002.
- Mitch, W.E., and Goldberg, A.L. (1996). Mechanisms of Muscle Wasting — The Role of the Ubiquitin–Proteasome Pathway. N. Engl. J. Med. 335, 1897–1905. https://doi.org/10.1056/nejm199612193352507.
- Cohen, S., Nathan, J.A., and Goldberg, A.L. (2015). Muscle wasting in disease: Molecular mechanisms and promising therapies. Nat. Rev. Drug Discov. 14, 58–74. https://doi.org/10.1038/nrd4467.
- Marceca, G.P., Londhe, P., and Calore, F. (2020). Management of Cancer Cachexia: Attempting to Develop New Pharmacological Agents for New Effective Therapeutic Options. Front. Oncol. 10, 298. https://doi.org/10. 3389/fonc.2020.00298.
- Wyart, E., Carra` , G., Angelino, E., Penna, F., and Porporato, P.E. (2025). Systemic metabolic crosstalk as driver of cancer cachexia. Trends Endocrinol. Metab. xx, 1–12. https://doi.org/10.1016/j.tem.2024.12.005.
- Zhou, X., Wang, J.L., Lu, J., Song, Y., Kwak, K.S., Jiao, Q., Rosenfeld, R., Chen, Q., Boone, T., Simonet, W.S., et al. (2010). Reversal of cancer cachexia and muscle wasting by ActRIIB antagonism leads to prolonged survival. Cell 142, 531–543. https://doi.org/10.1016/j.cell.2010.07.011.
- Baracos, V.E. (2018). Bridging the gap: Are animal models consistent with clinical cancer cachexia? Nat. Rev. Clin. Oncol. 15, 197–198. https://doi. org/10.1038/nrclinonc.2018.14.
- Argile´ s, J.M., Busquets, S., Stemmler, B., and Lo´ pez-Soriano, F.J. (2014). Cancer cachexia: Understanding the molecular basis. Nat. Rev. Cancer 14. https://doi.org/10.1038/nrc3829.
- Kim, J., Koo, B.K., and Knoblich, J.A. (2020). Human organoids: model systems for human biology and medicine. Nat. Rev. Mol. Cell Biol. 21, 571–584. https://doi.org/10.1038/s41580-020-0259-3.
- Auletta, B., Chiolerio, P., Cecconi, G., Rossi, L., Sartore, L., Cecchinato, F., Barbato, G., Lauroja, A., Maghin, E., Easler, M., et al. (2025). Tissue-engineered neuromuscular organoids. Commun. Biol. 8, 1074. https://doi. org/10.1038/s42003-025-08484-z.
- Urzi, A., Lahmann, I., Nguyen, L.V.N., Rost, B.R., Garcı´a-Pe´ rez, A., Lelievre, N., Merritt-Garza, M.E., Phan, H.C., Bassell, G.J., Rossoll, W., et al. (2023). Efficient generation of a self-organizing neuromuscular junction model from human pluripotent stem cells. Nat. Commun. 14, 8043. https://doi.org/10.1038/s41467-023-43781-3.
- Shin, M.K., Bang, J.S., Lee, J.E., Tran, H.D., Park, G., Lee, D.R., and Jo, J. (2022). Generation of Skeletal Muscle Organoids from Human Pluripotent Stem Cells to Model Myogenesis and Muscle Regeneration. Int. J. Mol. Sci. 23, 5108. https://doi.org/10.3390/ijms23095108.
- Rossi, L., Auletta, B., Sartore, L., La Placa, M., Cecconi, G., Chiolerio, P., Maghin, E., Angiolillo, S., Carraro, E., Gagliano, O., et al. (2025). Engineering Assembloids to Mimic Graft-Host Skeletal Muscle Interaction. Adv. Healthc. Mater. 14, e2404111. https://doi.org/10.1002/adhm.202404111.
- Pereira, J.D., DuBreuil, D.M., Devlin, A.C., Held, A., Sapir, Y., Berezovski, E., Hawrot, J., Dorfman, K., Chander, V., and Wainger, B.J. (2021). Human sensorimotor organoids derived from healthy and amyotrophic lateral sclerosis stem cells form neuromuscular junctions. Nat. Commun. 12, 4744. https://doi.org/10.1038/s41467-021-24776-4.
- Yin, Y., Zhou, W., Zhu, J., Chen, Z., Jiang, L., Zhuang, X., Chen, J., Wei, J., Lu, X., Liu, Y., et al. (2025). Generation of self-organized neuromusculoskeletal tri-tissue organoids from human pluripotent stem cells. Cell Stem Cell 32, 157–171.e8. https://doi.org/10.1016/j.stem.2024.11.005.
- Maffioletti, S.M., Gerli, M.F.M., Ragazzi, M., Dastidar, S., Benedetti, S., Loperfido, M., Vandendriessche, T., Chuah, M.K., and Tedesco, F.S. (2015). Efficient derivation and inducible differentiation of expandable skeletal myogenic cells from human ES and patient-specific iPS cells. Nat. Protoc. 10, 941–958. https://doi.org/10.1038/nprot.2015.057.
- Gao, C., Shi, Q., Pan, X., Chen, J., Zhang, Y., Lang, J., Wen, S., Liu, X., Cheng, T.L., and Lei, K. (2024). Neuromuscular organoids model spinal neuromuscular pathologies in C9orf72 amyotrophic lateral sclerosis. Cell Rep. 43, 113892. https://doi.org/10.1016/j.celrep.2024.113892.
- Chal, J., Tanoury, Z.A., Hestin, M., Gobert, B., Aivio, S., Hick, A., Cherrier, T., Nesmith, A.P., Parker, K.K., and Pourquie´ , O. (2016). Generation of human muscle fibers and satellite-like cells from human pluripotent stem cells in vitro. Nat. Protoc. 11, 1833. https://doi.org/10.1038/nprot. 2016-110.
- Mavrommatis, L., Jeong, H.W., Kindler, U., Gomez-Giro, G., Kienitz, M.C., Stehling, M., Psathaki, O.E., Zeuschner, D., Bixel, M.G., Han, D., et al. (2023). Human skeletal muscle organoids model fetal myogenesis and sustain uncommitted PAX7 myogenic progenitors. eLife 12, RP87081. https://doi.org/10.7554/eLife.87081.
- Faustino Martins, J.M., Fischer, C., Urzi, A., Vidal, R., Kunz, S., Ruffault, P.L., Kabuss, L., Hube, I., Gazzerro, E., Birchmeier, C., et al. (2020). Self-Organizing 3D Human Trunk Neuromuscular Organoids. Cell Stem Cell 26, 172–186.e6. https://doi.org/10.1016/j.stem.2019.12.007.
- Sambasivan, R., and Steventon, B. (2020). Neuromesodermal Progenitors: A Basis for Robust Axial Patterning in Development and Evolution. Front. Cell Dev. Biol. 8, 607516–607519. https://doi.org/10.3389/fcell. 2020.607516.
- Henrique, D., Abranches, E., Verrier, L., and Storey, K.G. (2015). Neuromesodermal progenitors and the making of the spinal cord. Dev 142, 2864– 2875. https://doi.org/10.1242/dev.119768.
- Guibentif, C., Griffiths, J.A., Imaz-Rosshandler, I., Ghazanfar, S., Nichols, J., Wilson, V., Go¨ ttgens, B., and Marioni, J.C. (2021). Diverse Routes toward Early Somites in the Mouse Embryo. Dev. Cell 56, 141–153.e6. https://doi.org/10.1016/j.devcel.2020.11.013.
- Gouti, M., Delile, J., Stamataki, D., Wymeersch, F.J., Huang, Y., Kleinjung, J., Wilson, V., and Briscoe, J. (2017). A Gene Regulatory Network Balances Neural and Mesoderm Specification during Vertebrate Trunk Development. Dev. Cell 41, 243–261.e7. https://doi.org/10.1016/j.devcel.2017. 04.002.
- Edri, S., Hayward, P., Baillie-Johnson, P., Steventon, B.J., and Martinez Arias, A. (2019). An epiblast stem cell-derived multipotent progenitor population for axial extension. Dev 146, dev168187. https://doi.org/10.1242/ dev.168187.
- Edri, S., Hayward, P., Jawaid, W., and Martinez Arias, A. (2019). Neuromesodermal progenitors (NMPs): A comparative study between pluripotent stem cells and embryo-derived populations. Dev 146, dev180190. https://doi.org/10.1242/dev.180190.
- Sandri, M., Sandri, C., Gilbert, A., Skurk, C., Calabria, E., Picard, A., Walsh, K., Schiaffino, S., Lecker, S.H., and Goldberg, A.L. (2004). Foxo Transcription Factors Induce the Atrophy-Related Ubiquitin Ligase Atrogin-1 and Cause Skeletal Muscle Atrophy. Cell 117, 399–412. https://doi.org/10. 1016/S0092-8674(04)00400-3.
- Zhang, W., Sun, W., Gu, X., Miao, C., Feng, L., Shen, Q., Liu, X., and Zhang, X. (2022). GDF-15 in tumor-derived exosomes promotes muscle atrophy via Bcl-2/caspase-3 pathway. Cell Death Discov. 8, 162. https:// doi.org/10.1038/s41420-022-00972-z.
- Schmidt, M., Poser, C., and von Maltzahn, J. (2020). Wnt7a Counteracts Cancer Cachexia. Mol. Ther. Oncolytics 16, 134–146. https://doi.org/10. 1016/j.omto.2019.12.011.
- Rohm, M., Scha¨ fer, M., Laurent, V., U¨ stu¨ nel, B.E., Niopek, K., Algire, C., Hautzinger, O., Sijmonsma, T.P., Zota, A., Medrikova, D., et al. (2016). An AMP-activated protein kinase-stabilizing peptide ameliorates adipose tissue wasting in cancer cachexia in mice. Nat. Med. 22, 1120–1130. https://doi.org/10.1038/nm.4171.
- Sartori, R., Hagg, A., Zampieri, S., Armani, A., Winbanks, C.E., Viana, L.R., Haidar, M., Watt, K.I., Qian, H., Pezzini, C., et al. (2021). Perturbed BMP signaling and denervation promote muscle wasting in cancer cachexia. Sci. Transl. Med. 13, eaay9592. https://doi.org/10.1126/scitranslmed. aay9592.
- Rall, J.A. (2022). Discovery of the regulatory role of calcium ion in muscle contraction and relaxation: Setsuro Ebashi and the international emergence of Japanese muscle research. Adv. Physiol. Educ. 46, 481–490. https://doi.org/10.1152/ADVAN.00108.2022.
- Cosentino, M., Forcina, L., Zouhair, M., Apa, L., Genovese, D., Boccia, C., Rizzuto, E., and Musaro` , A. (2023). Modelling three-dimensional cancerassociated cachexia and therapy: The molecular basis and therapeutic potential of interleukin-6 transignalling blockade. J. Cachexia Sarcopenia Muscle 14, 2550–2568. https://doi.org/10.1002/jcsm.13329.
- Seto, D.N., Kandarian, S.C., and Jackman, R.W. (2015). A key role for leukemia inhibitory factor in C26 cancer cachexia. J. Biol. Chem. 290, 19976– 19986. https://doi.org/10.1074/jbc.M115.638411.
- Lu, S., Li, Y., Shen, Q., Zhang, W., Gu, X., Ma, M., Li, Y., Zhang, L., Liu, X., and Zhang, X. (2021). Carnosol and its analogues attenuate muscle atrophy and fat lipolysis induced by cancer cachexia. J. Cachexia Sarcopenia Muscle 12, 779–795. https://doi.org/10.1002/jcsm.12710.
- Garcı´a-Lizarribar, A., Villasante, A., Lopez-Martin, J.A., Flandez, M., SolerVa´ zquez, M.C., Serra, D., Herrero, L., Sagrera, A., Efeyan, A., and Samitier, J. (2023). 3D bioprinted functional skeletal muscle models have potential applications for studies of muscle wasting in cancer cachexia. Biomater. Adv. 150. https://doi.org/10.1016/j.bioadv.2023.213426.
- Yuan, L., Han, J., Meng, Q., Xi, Q., Zhuang, Q., Jiang, Y., Han, Y., Zhang, B., Fang, J., and Wu, G. (2015). Muscle-specific E3 ubiquitin ligases are involved in muscle atrophy of cancer cachexia: An in vitro and in vivo study. Oncol. Rep. 33, 2261–2268. https://doi.org/10.3892/or.2015.3845.
- Wang, R., Kumar, B., Bhat-Nakshatri, P., Khatpe, A.S., Murphy, M.P., Wanczyk, K.E., Simpson, E., Chen, D., Gao, H., Liu, Y., et al. (2023). A human skeletal muscle stem/myotube model reveals multiple signaling targets of cancer secretome in skeletal muscle. iScience 26, 106541. https://doi.org/10.1016/j.isci.2023.106541.
- Noone, J., Rooney, M.F., Karavyraki, M., Yates, A., O’Sullivan, S.E., and Porter, R.K. (2023). Cancer-Cachexia-Induced Human Skeletal Muscle Myotube Degeneration Is Prevented via Cannabinoid Receptor 2 Agonism In Vitro. Pharmaceuticals 16, 1580. https://doi.org/10.3390/ph16111580.
- Kandarian, S.C., Nosacka, R.L., Delitto, A.E., Judge, A.R., Judge, S.M., Ganey, J.D., Moreira, J.D., and Jackman, R.W. (2018). Tumour-derived leukaemia inhibitory factor is a major driver of cancer cachexia and morbidity in C26 tumour-bearing mice. J. Cachexia Sarcopenia Muscle 9, 1109–1120. https://doi.org/10.1002/jcsm.12346.
- Chitti, S.V., Kang, T., Fonseka, P., Marzan, A.L., Stewart, S., Shahi, S., Bramich, K., Ang, C.S., Pathan, M., Gummadi, S., and Mathivanan, S. (2023). Proteomic analysis of the small extracellular vesicles and soluble secretory proteins from cachexia inducing and non-inducing cancer cells. Proteomics 23, e2100314. https://doi.org/10.1002/pmic.202100314.
- Pin, F., Barreto, R., Couch, M.E., Bonetto, A., and O’Connell, T.M. (2019). Cachexia induced by cancer and chemotherapy yield distinct perturbations to energy metabolism. J. Cachexia Sarcopenia Muscle 10, 140–154. https://doi.org/10.1002/jcsm.12360.
- Sun, N., Krauss, T., Seeliger, C., Kunzke, T., Sto¨ ckl, B., Feuchtinger, A., Zhang, C., Voss, A., Heisz, S., Prokopchuk, O., et al. (2024). Inter-organ cross-talk in human cancer cachexia revealed by spatial metabolomics. Metabolism 161, 156034. https://doi.org/10.1016/j.metabol.2024. 156034.
- Fonseca, G.W.P.d., Farkas, J., Dora, E., von Haehling, S., and Lainscak, M. (2020). Cancer cachexia and related metabolic dysfunction. Int. J. Mol. Sci. 21, 2321. https://doi.org/10.3390/ijms21072321.
- Beltra` , M., Pin, F., Ballaro` , R., Costelli, P., and Penna, F. (2021). Mitochondrial dysfunction in cancer cachexia: Impact on muscle health and regeneration. Cells 10, 1–18. https://doi.org/10.3390/cells10113150.
- Kubat, G.B., Bouhamida, E., Ulger, O., Turkel, I., Pedriali, G., Ramaccini, D., Ekinci, O., Ozerklig, B., Atalay, O., Patergnani, S., et al. (2023). Mitochondrial dysfunction and skeletal muscle atrophy: Causes, mechanisms, and treatment strategies. Mitochondrion 72, 33–58. https://doi.org/10. 1016/j.mito.2023.07.003.
- van der Ende, M., Grefte, S., Plas, R., Meijerink, J., Witkamp, R.F., Keijer, J., and van Norren, K. (2018). Mitochondrial dynamics in cancer-induced cachexia. Biochim. Biophys. Acta. Rev. Cancer 1870, 137–150. https:// doi.org/10.1016/j.bbcan.2018.07.008.
- Aversa, Z., Pin, F., Lucia, S., Penna, F., Verzaro, R., Fazi, M., Colasante, G., Tirone, A., Rossi Fanelli, F., Ramaccini, C., et al. (2016). Autophagy is induced in the skeletal muscle of cachectic cancer patients. Sci. Rep. 6, 30340. https://doi.org/10.1038/srep30340.
- Penna, F., Ballaro` , R., Martinez-Cristobal, P., Sala, D., Sebastian, D., Busquets, S., Muscaritoli, M., Argile´ s, J.M., Costelli, P., and Zorzano, A. (2019). Autophagy Exacerbates Muscle Wasting in Cancer Cachexia and Impairs Mitochondrial Function. J. Mol. Biol. 431, 2674–2686. https:// doi.org/10.1016/j.jmb.2019.05.032.
- Hemel, I.M.G.M., Engelen, B.P.H., Luber, N., and Gerards, M. (2021). A hitchhiker’s guide to mitochondrial quantification. Mitochondrion 59, 216–224. https://doi.org/10.1016/j.mito.2021.06.005.
- Biswas, A.K., and Acharyya, S. (2020). Cancer-Associated Cachexia: A Systemic Consequence of Cancer Progression. Annu. Rev. Cancer Biol. 4, 391–411. https://doi.org/10.1146/annurev-cancerbio-030419-033642.
- Law, M.L. (2022). Cancer cachexia: Pathophysiology and association with cancer-related pain. Front. Pain Res. 3, 971295. https://doi.org/10.3389/ fpain.2022.971295.
- Waning, D.L., and Guise, T.A. (2015). Cancer-associated muscle weakness: What’s bone got to do with it? BoneKEy Rep. 4, 691. https://doi. org/10.1038/bonekey.2015.59.
- Penna, F., Busquets, S., and Argile´ s, J.M. (2016). Experimental cancer cachexia: Evolving strategies for getting closer to the human scenario. Semin. Cell Dev. Biol. 54. https://doi.org/10.1016/j.semcdb.2015.09.002.
- Jalal, S., Dastidar, S., and Tedesco, F.S. (2021). Advanced models of human skeletal muscle differentiation, development and disease: Threedimensional cultures, organoids and beyond. Curr. Opin. Cell Biol. 73, 92–104. https://doi.org/10.1016/j.ceb.2021.06.004.
- Iberite, F., Gruppioni, E., and Ricotti, L. (2022). Skeletal muscle differentiation of human iPSCs meets bioengineering strategies: perspectives and challenges. NPJ Regen. Med. 7, 23–30. https://doi.org/10.1038/s41536- 022-00216-9.
- Beltra` , M., Po¨ lla¨ nen, N., Fornelli, C., Tonttila, K., Hsu, M.Y., Zampieri, S., Moletta, L., Corra` , S., Porporato, P.E., Kivela¨ , R., et al. (2023). NAD+ repletion with niacin counteracts cancer cachexia. Nat Comms 14, 1849. https://doi.org/10.1038/s41467-023-37595-6.
- Schindelin, J., Arganda-Carreras, I., Frise, E., Kaynig, V., Longair, M., Pietzsch, T., Preibisch, S., Rueden, C., Saalfeld, S., Schmid, B., et al. (2012). Fiji: an open-source platform for biological-image analysis. Nat Methods 9, 676–682. https://doi.org/10.1038/nmeth.2019.
- Thielicke, W., and Stamhuis, E.J. (2014). PIVlab – Towards User-friendly, Affordable and Accurate Digital Particle Image Velocimetry in MATLAB. J. Open. Res. Soft. 2, e30. https://doi.org/10.5334/jors.bl.
- Gagliano, O., Luni, C., Qin, W., Bertin, E., Torchio, E., Galvanin, S., Urciuolo, A., and Elvassore, N. (2019). Microfluidic reprogramming to pluripotency of human somatic cells. Nat. Protoc. 14, 722–737. https://doi.org/ 10.1038/s41596-018-0108-4.
- Maccione, A., Gandolfo, M., Massobrio, P., Novellino, A., Martinoia, S., and Chiappalone, M. (2009). A novel algorithm for precise identification of spikes in extracellularly recorded neuronal signals. J. Neurosci. Methods 177, 241–249. https://doi.org/10.1016/j.jneumeth.2008.09.026.
- Xiong, Y., Soumillon, M., Wu, J., Hansen, J., Hu, B., Van Hasselt, J.G.C., Jayaraman, G., Lim, R., Bouhaddou, M., Ornelas, L., et al. (2017). A Comparison of mRNA Sequencing with Random Primed and 3′ -Directed Libraries. Sci. Rep. 7, 14626. https://doi.org/10.1038/s41598-017-14892-x.
- Anders, S., Pyl, P.T., and Huber, W. (2015). HTSeq-A Python framework to work with high-throughput sequencing data. Bioinformatics 31, 166–169. https://doi.org/10.1093/bioinformatics/btu638.
- Dobin, A., Davis, C.A., Schlesinger, F., Drenkow, J., Zaleski, C., Jha, S., Batut, P., Chaisson, M., and Gingeras, T.R. (2013). STAR: Ultrafast universal RNA-seq aligner. Bioinformatics 29, 15–21. https://doi.org/10.1093/ bioinformatics/bts635.
- Huber, W., Carey, V.J., Gentleman, R., Anders, S., Carlson, M., Carvalho, B.S., Bravo, H.C., Davis, S., Gatto, L., Girke, T., et al. (2015). Orchestrating high-throughput genomic analysis with Bioconductor. Nat. Methods 12, 115–121. https://doi.org/10.1038/nmeth.3252.
- Love, M.I., Huber, W., and Anders, S. (2014). Moderated estimation of fold change and dispersion for RNA-seq data with DESeq2. Genome Biol. 15, 550. https://doi.org/10.1186/s13059-014-0550-8.
¶ STAR★METHODS
¶ KEY RESOURCES TABLE
| REAGENT or RESOURCE | SOURCE | IDENTIFIER |
| Antibodies | ||
| Rabbit anti-NANOG (D73G4) XP | CellSignaling | Cat# 4903; RRID: AB_10559205 |
| Mouse anti-OCT4 (C30A3) | Cell Signaling | Cat# 2840; RRID: AB_2167691 |
| Rabbit anti-SOX2 | Milipore | Cat# AB5603; RRID: AB_2286686 |
| Goat anti-T/Bra | R&D System | Cat# AF2085; RRID: AB_2200235 |
| Rabbit anti-Desmin | Abcam | Cat# AB15200; RRID: AB_301744 |
| Mouse anti-β tubulin Il/Tuj1 | Biolegend | Cat# MMS-435P; RRID: AB_2313773 |
| Mouse anti-Myosin Heavy Chain | DSHB | Cat# MF-20; RRID: AB_2147781 |
| Rabbit anti-62 | Sigma Aldrich | Cat# P0067; RRID: AB_1841064 |
| Rabbit anti-C3 | Sigma Aldrich | Cat# L7543; RRID: AB_796155 |
| Rabbit anti-TOM20 (D8T4N) | Cel Signaling | Cat# mAb#42406; RRID: AB_2687663 |
| Rat anti-LAMP1 | DHSB | Cat# 1D4B; RRID: AB_2134500 |
| Chemicals,peptides,and recombinant proteins | ||
| StemMACS iPS-Brew XF | Miltenyi Biotec | Cat# 130-104-368 |
| DMEM 1× | Thermo Fisher | Cat# 41966029 |
| RPMI 1640 | Thermo Fisher | Cat# 11875093 |
| DMEM F-12 | Thermo Fisher | Cat# 11320074 |
| MiR05 | Oroboros Instruments | Cat# 60101-01 |
| Penilin-Streptomycin | Thermo Fisher | Cat# 15140122 |
| MEM Non-Essential Amino Acids | Thermo Fisher | Cat# 11140035 |
| Insulin-Transferring-Selenium | Thermo Fisher | Cat# 41400045 |
| 2-Mercaptoethanol | Thermo Fisher | Cat# 31350010 |
| KSR | Thermo Fisher | Cat# 10828028 |
| Matrigel | Corming | Cat# 354230 |
| TrypLE | Thermo Fisher | Cat# 12563029 |
| EDTA | Thermo Fisher | Cat# AM9260G |
| L-Glutamine | Thermo Fisher | Cat# 25030081 |
| FBS | Thermo Fisher | Cat# A5256701 |
| Sodium pyruvate | Thermo Fisher | Cat# 11360070 |
| Y-27632 | Miltenyi Biotec | Cat# 130-106-538 |
| CHIR 99021 | Bio-Techne | Cat# 4423/10 |
| LDN-193189 | Miltenyi Biotec | Cat# 130-103-925 |
| FGF-b/FGF-2 | ImmunoTools | Cat# 11343625 |
| IGF-1 | Miltenyi Biotec | Cat# 130-093-886 |
| HGF | ImmunoTools | Cat# 11343413 |
| CNTF | PeproTech | Cat# 450-13 |
| GDNF | PeproTech | Cat# 450-10 |
| Acetylcholine | Sigma Aldrich | Cat# A6625 |
| Fluo-4 | Thermo Fisher | Cat# F14201 |
| Pluronic F-127 | Thermo Fisher | Cat# P3000MP |
| Hoechst | Thermo Fisher | Cat# 33342 |
| ADP | Sigma Aldrich | Cat# 01897 |
| Digitonin | Sigma Aldrich | Cat# 300410 |
| Pyruvate | Sigma Aldrich | Cat# P2256 |
| REAGENT or RESOURCE | SOURCE | IDENTIFIER |
| Malate | Sigma Aldrich | Cat# M1000 |
| Succinate | Sigma Aldrich | Cat# S2378 |
| Rotenone | Sigma Aldrich | Cat# R8875 |
| CCCP | Sigma Aldrich | Cat# C2759 |
| Antimycin A | Sigma Aldrich | Cat# A8674 |
| OCT | Sakura | Cat# 4583 |
| Alexa 647 Conjugate α-bungarotoxin | Thermo Fisher | Cat# B35450 |
| Alexa 647 Conjugate biotinylated phalloidin | Thermo Fisher | Cat# A22287 |
| Critical commercial assays | ||
| RNA Extraction RNeasy Kit | QIAGEN | Cat# 74034 |
| High-capacity cDNA RT Kit | Thermo Fisher | Cat# 4368814 |
| RNASEOUT Recomb. RNASE Inhib. | Thermo Fisher | Cat# 10777019 |
| Powrup SYBR Master Mix | Thermo Fisher | Cat# A25776 |
| Live-dead cellviability kit | Sigma Aldrich | Cat# CBA415 |
| Deposited data | ||
| Bulk RNA-seq data (already published) | GEO: GSE226477 | https://www.ncbi.nlm.nih.gov/geo/query/ acc.cgi?acc=GSE226477 |
| Experimental models: Cellines | ||
| BJ15 cl44 | Elvassore N. Lab | DOl: https://doi.0rg/10.1002/adhm.202404111 |
| BJ15 cl21 | Elvassore N. Lab | DOl: https://doi.0rg/10.1038/s42003-025-08484-z |
| MC38 | Marigo I. Lab | DOl: https://doi.0rg/10.1038/s41422-019-0224-x |
| C26 | Costelli P. Lab | DOI: https:/doi.org/10.3390/cancers13133285 |
| Oligonucleotides | ||
| Primers used for qPCR | This study | Data S2 |
| Software and algorithms | ||
| Fij | Schindelin et al.64 | https://imagej.net/Fiji |
| GraphPad Prism | GraphPad | https://www.graphpad.com/scientific-software/prism/ |
| PIViab | Thielicke and Stamhuis65 | https://www.pivlab.de |
| Other | ||
| Biofloat 96-well plate | Sarstedt | Cat. No.: 83.3925.400 |
¶ EXPERIMENTAL MODEL AND STUDY PARTICIPANT DETAILS
¶ Human induced pluripotent stem cell derivation and culture
All human iPSCs lines in this study (wild-type or constitutively expressing GFP) were published16,19 and derived from foreskin fibroblast cell lines (BJ; male) by reprogramming in microfluidics.66 Human iPSCs were cultured in feeder free conditions on 0.5% Matrigel (MRF, Corning) coated cell culture plates (6-multiwell, Sarstedt) in StemMACS iPS-Brew XF (Miltenyi Biotec) with 1% penicillin/streptomycin (P/S; Gibco-Fisher Scientific), at 37◦C and 5% CO2 in cell incubator. All cell lines were tested negative for mycoplasma and maintained below passage 30 before their use for differentiation. For GFP+ -hiPSCs, cells at passage 12 were transduced with a lentiviral vector encoding for GFP and Puromycin resistance under the control of PGK promoter19
¶ Differentiation and culture of hiPSCs
The 2D differentiation protocol and sample characterization were previously reported.16 For NMO generation, we adapted the hiPSC differentiation neuromuscular protocol of previous studies.16,19 More in detail, Matrigel droplets were dispensed on a sterile glass coverslip (Vetrotecnica) forming 1 cm2 droplets placed into 24-multiwell plates (Sarstedt). Droplets were incubated at 37◦C for 20 min in cell incubator to allow Matrigel polymerization. Two days before differentiation (Day − 2) hiPSCs were enzymatically dissociated as single cells using TryplE Select (Gibco). Cells (40,000) were resuspended in 50 μL of StemMACS iPS-Brew XF supplemented with 10 μM StemMACS Y27632 and were plated on top of Matrigel droplets and incubated for 90 min at 37◦C and 5% CO2 prior to further media supplementation. One day before differentiation (day − 1), media was changed, and cells were cultured in StemMACS iPS-Brew XF. The differentiation protocol started at day 0 and was adapted from literature studies that use small molecules and growth factors,24 according to our published protocols.16,19 Of note the cell density (cell number per cm2 ) used was identical among the different cell culture setups. Briefly, from day 0 to day 2 the media was switched to a Dulbecco’s Modified Eagle Medium/Nutrient Mixture F-12 (DMEM F-12, Gibco) basal medium, supplemented with Insulin-Transferrin-Selenium (ITS, Gibco), 1% Pen-Strep (Gibco), 3 μM WNT agonist CHIRON99021 (Miltenyi Biotec) and 0.5 μM BMP antagonist LDN193189 (Miltenyi Biotec). From day 3 to day 5, 20 ng/mL fibroblast growth factor 2 (FGF-2, Immunotools) was supplemented to the media. At day 6 spheroids were mechanically detached from Matrigel droplets and expanded by embedding 4–6 of them into a Matrigel drop. Starting from day 6, medium was changed to DMEM F-12, supplemented with 15% KnockoutTM Serum Replacement (KSR, Gibco), 10 ng/mL hepatocyte growth factor (HGF, ImmunoTools), 2 ng/mL insulin-like growth factor 1 (IGF-1, Miltenyi Biotec), 20 ng/mL FGF-2 and 0.5 μM LDN193189. From day 8 to day 11 of differentiation cells were cultured in DMEM F-12 supplemented with 15% KSR and 2 ng/mL IGF-1. From Day 12, the previous media was modified by including 10 ng/mL HGF and 2 ng/mL IGF-1. From Day 18 NMOs were transferred into ultra-low adhesion 96-well plates, where they were maintained on an orbital shaker in the incubator. From Day 22, NMOs were cultured in myogenic secondary differentiation media (optimal NMO differentiation media, UNT), composed of DMEM F-12 supplemented with 2% KSR, 1× ITS, 1% P/S, 1 μM CHIRON99021, 10 ng/mL ciliary neurotrophic factor (CNTF; PeproTech), and 10 ng/mL glial cell line-derived neurotrophic factor (GDNF; PeproTech) until day 50.
¶ Culture of murine colon adenocarcinoma cell lines
We used both mouse colon-26 (C26) colorectal cancer cell line, derived form a colon adenocarcinoma induced in BALB/c mice, and colon-38 (MC38) colorectal cancer cell line, originating from a colon adenocarcinoma in a C57BL/6 mouse. C26 cells were cultured in high-glucose DMEM (Gibco) supplemented with 10% fetal bovine serum (FBS, Gibco), 1% Penicillin/Streptomycin (100 U/mL penicillin, 0.1 mg/mL streptomycin). MC38 cells were cultured in RPMI 1640 medium (Gibco) supplemented with 10% FBS, 1% Penicillin/ Streptomycin, 2 mM L-glutamine, 1 mM sodium pyruvate, and 0.1 mM MEM NEAA. Cells were maintained at 37◦C in a humidified atmosphere with 5% CO2. All experiments were performed using low-passage cells.
¶ METHOD DETAILS
¶ Treatment of NMO with C26 and MC38 conditioned media
For conditioned media collection, C26 cells or MC38 were seeded and cultured until they reached ∼90% confluence. The medium was then replaced with serum-free DMEM for C26 cells or serum-free RPMI 1640 for MC38 cells, both containing antibiotics and glutamine, and cells were cultured for an additional 24 h. Conditioned medium was then collected, centrifuged at 4,500 rpm for 15 min at 4◦C, filtered through a 0.22 μm filter and administered to NMOs. From day 50, NMOs were cultured in 200 μL of either conditioned media (C26-CM, MC38-CM) or basal media (C26-BM, MC38-BM) or optimal NMO differentiation media (UNT). Basal media were represented by the usual growing media for C26 or MC38 (without cell culture). Treatments were carried out for 72 h, until day53 of organoid culture. Throughout the treatment period, GFP-positive NMOs were monitored using an LSM800 inverted confocal microscope (Zeiss) to track morphological and fluorescence changes over time.
¶ Immunofluorescence analysis and image preparation
Organoids were fixed for 1 h with 4% PFA at room temperature and washed with PBS for 5 min. Samples were analyzed in whole mount or were included in OCT (Sakura) and cryo-sectioned into 30 μm slices. Samples were blocked at room temperature in 1% BSA, 0.5% Triton X-100 (Sigma) in 1× PBS solution (PBST) for 2 h. Primary antibodies were diluted in 1% BSA PBST solution and incubated for 48 h (whole mount) or overnight (cryo-sections), at 4◦C under agitation. Samples were then washed 3 times for 30 min in 1× PBST solution on an agitation plate for whole mount staining and incubated for 48 h at 4◦C (whole mount) or 2 h at room temperature (cryo-sections) with secondary antibodies and then washed twice with 1× PBS for 30 min. Nuclei were counterstained with 10 μg/mL Hoechst (Thermo Fisher). Images were acquired using LSM800 inverted confocal microscope (Zeiss). We used ImageJ for brightness and contrast adjustments and channel merging of the images.
¶ Live imaging analysis for contraction and calcium dynamics
All the analysis in live imaging were performed using Leica M205 FCA stereomicroscope equipped with PLANAP0 1.0× objective, with an acquisition rate of 16 frames per second, according to published protocols.16,19 When indicated, samples were stimulated with acetylcholine (ACh) neurotransmitter at the final working concentration of 10 μM.
For calcium experiments, samples were treated with Fluo-4-AM (Invitrogen) following the instructions and literature .16,19 Briefly, after PBS wash, samples were incubated with 20 μM Fluo-4-AM, 5 μL/mL PluronicTM F-127 (Thermo Fisher Scientific), and 12.5 μL/mL sulfinpyrazone (Sigma-Aldrich) in serum-free cell medium for 30 min at 37◦C and 5% CO2. Samples were then accurately washed with myogenic secondary differentiation media without KSR and subjected to live imaging analysis.
¶ Multi electrode array (MEA) assay
Extracellular recordings were conducted using CorePlateTM 6W 38/60 using BioCAM DupleX (3Brain, AG.) with a 14.44 mm2 active area. The electrodes, measuring 25 μm in length and spaced 60 μm (pitch) in a 64 × 64 grid, facilitating the recording of instantaneous extracellular voltage signals. D50 NMOs were loaded into the chambers for single NMO analysis. Signals were measured in acute mode and spontaneous electrical activity was recorded for 2 min under stable conditions (37◦C, 5% CO2). Data were collected at a sampling rate of 20 kHz and stored for offline analysis. Spike detection was performed with the Precise Timing Spike Detection (PTSD) algorithm67 at a differential threshold set to 8 times the standard deviation.
¶ Live and dead analysis
For live and dead experiments, NMOs were treated with Live Dead Cell Viability Assay Kit for 3D and 2D cell culture (Millipore) following the protocol instruction. Briefly, samples were incubated with 0.4 μL/mL, 1.6 μL/mL Propidium iodide, in 1:1 cell culture medium and PBS solution for 60 min at 37◦C and 5% CO2. Samples were then accurately washed with myogenic secondary differentiation media and subjected to live imaging analysis. Live imaging was performed as previously described in whole mount samples.
¶ AdV infection
The AdV-c.a.FoxO3 was previously used and validated in vivo. 33 Each NMO was treated with 107 vg of AdV-c.a.FoxO3 or AdV-GFP (used as negative control) added to the culture media.
¶ RNA purification and RT-qPCR
Total cell RNA was isolated and purified using RNeasy Plus Mini Kit (Qiagen) according to the manufacturer’s instructions and previous studies.16,19 Briefly, NMOs were harvested by direct lysis in the cell culture well and further processed according to the protocol. Extracted RNA quality and concentration were assessed with Nanodrop (Thermo Scientific). Complementary DNA (cDNA) of D30 and D50 NMOs were obtained using High-Capacity cDNA Reverse Transcription Kit (Applied Biosystems) in a dedicated thermocycler (Mastercycler ×50a, Eppendorf). Expression of neural markers was quantified by using a QuantStudioTM 5 Real-Time PCR (Thermo Scientific) and Platinum SYBR Green SuperMix kit components (Invitrogen, 11733-038) according to the manufacturer’s instructions. All the primers used are listed in Data S2.
¶ Bulk sequencing analysis
Total RNA was quantified using the Qubit 4.0 fluorometric Assay (Thermo Fisher Scientific). Libraries were prepared from 125 ng of total RNA using the NEGEDIA Digital mRNA-seq research grade sequencing service (Next Generation Diagnostic srl)68 which included library preparation, quality assessment and sequencing on a NovaSeq 6000 sequencing system using a single-end, 100 cycle strategy (Illumina Inc.). The raw data were analyzed by Next Generation Diagnostic srl proprietary NEGEDIA Digital mRNAseq pipeline (v2.0) which involves a cleaning step by quality filtering and trimming, alignment to the reference genome and counting by gene.69,70
¶ Spatial metabolomics analysis
NMOs were collected and embedded in 2–3% carboxymethyl cellulose before being frozen (isopentane bath in liquid nitrogen) and stored in a sealed container at − 80◦C. Cryosections of 10 μm thickness were cut, mounted onto conductive IntelliSlides (Bruker Daltonics, Bremen, Germany), and dried in a vacuum desiccator at room temperature for 30 min prior to matrix application. The 1,5-diaminonaphthalene hydrochloride matrix was prepared as previously described (Liu et al., 2014): 39.5 mg of 1,5-DAN was dissolved in 500 μL of 1 M HCl and 4 mL of distilled water, followed by the addition of 4.5 mL of ethanol after sonication.
An HTX M5-SprayerTM (HTX Technologies) was used at a flow rate of 0.08 mL/min, a spray nozzle temperature of 70◦C, and a spray nozzle velocity of 1300 mm/min. MALDI-MSI was performed on a timsTOF fleX MALDI-2 mass spectrometer (Bruker Daltonics, Bremen, Germany) in negative mode within an m/z range of 70–850, using a spatial resolution of 10 μm and a laser frequency of 10 kHz. On-line calibration using several metabolites and matrix peaks m/z ratios was conducted, and external calibration was performed using red phosphorus.
¶ High-resolution respirometry
Oxygen flux of BM and CM organoids were measured using the NextGen-O2k (Oroboros Instruments, Innsbruck, Austria) and recorded using DatLab 8.0 (Oroboros Instruments). The O2 signal was monitored by a polarographic oxygen sensor (POS) over time and the O2 consumption of NMOs were plotted continuously. The polarographic oxygen sensor (POS) of the 2-mL O2k-chambers were calibrated daily (air calibration) at experimental temperature of 37◦C. All experiments were performed in mitochondrial respiration medium MiR05. After the addition of the NMO into the 0.5 mL chambers, 1.25 mM ADP was added and permeabilization was done with 0.1 μg digitonin. 1.25 mM pyruvate and 0.5 mM malate were added, followed by 2.5 mM succinate. Respiration linked to CI was blocked with 0.125 μM rotenone and the electron transfer capacity was assessed by titration with the uncoupler carbonyl cyanide 4-(trifluoromethoxy)phenylhydrazone (CCCP) (0.25 μM/step). Respiration was fully inhibited by the addition of 0.25 μM Antimycin A. For all traces, only the steady state of oxygen flux was selected, excluding unavoidable titration artifacts by chemical additions or intermittent re-oxygenations of the incubation medium. Oxygen consumption data were normalized to copy numbers of mtDNA.
¶ QUANTIFICATION AND STATISTICAL ANALYSIS
Quantifications of cell type percentage and proportion of muscular compartment were performed according to literature.16,19 For NMO area quantification we applied ‘‘Find Edges’’ function on ImageJ and then we segmented the NMOs using the freehand selection tool followed by ‘‘Measure’’ function. To quantify the number of NANOG+ OCT4+ , NANOG− OCT4− , TBRA+ SOX2+ , TBRA+ SOX2− and TBRA− SOX2+ , the Cell Counter tool of ImageJ software (Fiji, v.2.14.0/1.54 f) was used. The number of positive cells for each staining was expressed as pecentage on the total number of nuclei counted in each field. For myotube thickness quantifications, the analysis was performed by using the function ‘‘measure’’ of ImageJ by Fiji software. We performed quantification before and during treatments using live imaging analysis of GFP+ NMOs. Specifically, 6 to 13 independent biological replicates (NMO) were analyzed considering the mean of 3 cross-sections per ech NMO quantified along each cell that showed elongated morphology typical of myotubes, for a total of at least 160 cells analyzed per time point of each experimental condition. The quantification of myotube cross-section was also performed at the end of the experiment (72 h post treatment) on wholemount desmin-stained organoids. Here, 8 independent biological replicates (NMO) per each condition were analyzed, considering at least 30 myotubes per each NMOs, for a total of ≥240 myotubes analyzed per each experimental condition. Each myotube cross-section quantification was calculated as the mean of 3 cross-section measurements performed along each single myotube length. Representative images of desmin+ cells were obtained by isolating single myotubes through ‘‘Find Edges’’ function on ImageJ, followed by background removal ‘‘Clear Outside’’. For muscle area quantification and propidium iodide positive area quantifications, we used ‘‘Threshold’’ function to select the positive area followed by ‘‘Measure’’ function of ImageJ. To quantify fluorescence intensity, background fluorescence was estimated by selecting three ROIs in regions that did not display any detectable fluorescence signal. The ‘‘Measure’’ tool of ImageJ was used to obtain the mean fluorescence intensity from each ROI, which were then averaged to define the background fluorescence level for the corresponding image. The quantifications of the fluorescence intensity reported were calculated by subtracting the background value to the mean fluorescence intensity of each image. For mitochondria morphology analysis, at least 8 images per biological replicate were acquired and analyzed through the plugin ‘‘Mitochondria analyzer’’ of ImageJ. For colocalization analysis at least 8 images per biological replicate were acquired and analyzed through the plugin ‘‘Colocalization threshold’’ of ImageJ. For TOM20 skeleton images we applied ‘‘Skeletonize’’ plugin of ImageJ to generate the mask. For the quantification of P62 and LC3b puncta, we considered at least 8 images per biological replicate, analyzed through the plugin ‘‘Particle analyze’’ after ‘‘Threshold’’ function selection on ImageJ.
For quantitative real-time PCR, target Ct values of gene expression were normalized to that of the housekeeping genes GAPDH or TUBB3. Data are shown as relative fold change of gene expression in respect to D30 NMO samples applying the 2− ΔΔCT method. Bioinformatic analysis was performed in R v. 4.3.3 with Bioconductor v. 3.71 Genes were annotated using R package org.Hs.e.g.,.db v. 3.18. Genes were filtered out if not having at least 2 replicates from the same culture condition with at least 2 raw counts. Raw counts were subsequently normalized and expressed as counts per million (CPM) using R package DESeq2 v. 1.42.72 Log2 scale CPM data were obtained adding a unit pseudo-count to avoid infinite values. PCA was performed by R stats package function prcomp by singular value decomposition (SVD) after centering. Differentially expressed genes (DEGs) were computed using DESeq2 starting from raw count data, using a p value, after correction by the Benjamini Hochberg method, lower than 0.01. Hierarchical clustering with heatmap visualization was performed using R package pheatmap v. 1.0.12, using Euclidean distance. Indicated gene sets were obtained from Reactome database (https://reactome.org/).
For calcium ΔF/F0 calculation, ≥30 ROIs per sample with a size of 20 μm2 were selected to identify baseline (before neurotransmitter stimulation, F0) and maximum (after neurotransmitter stimulation, Fpeak) fluorescence intensity values, according to literature.16,19 Briefly, we used max and mean functions of MATLAB 2021 software (MathWorks) on outputted LAS X.csv files. ΔF/F0 was calculated considering ΔF as Fpeak - F0, with Fpeak as maximum fluorescence intensity measured upon neurotransmitter stimulation and F0 as baseline. For calcium transient analysis, 4 representative ROIs used for calcium ΔF/F0 calculation were selected. ROI fluorescence intensity variations were analyzed using LAS X Leica software and MATLAB 2021 software (MathWorks) according with literature.16,19
For vector map generation and displacement measurements, a graphical user interface (GUI) based particle image velocimetry software (PIVlab) version 3.07 was used according with literature.16,19 Briefly, selected pairs of frames acquired during live imaging analysis were cross correlated to yield vectorial maps and local displacement. In particular, maximum displacement was quantified by cross-correlating pairs of frames acquired before contraction and at the maximum displacement of NMOs. Polar charts showing the relation between displacement and direction of vectors for each sample were built from a custom-made R (v. 4.3.1) script using package ggplot2 v. 3.5.1. All mentioned MATLAB algorithms have source code available in MATLAB documentation, GraphPad Prism v.6, ImageJ plugins licensed under open-source GNU GPL v.3 license. All scripts and custom code are available upon request to the authors.
Mass spectrometry images were acquired using FlexImaging 7.0 software (Bruker). Data were analyzed using SCiLS Lab 2025b (Bruker) with a mass accuracy of ±15 ppm, without denoising, and applying root-mean-square normalization. Spectral data and regions of interest were exported to MetaboScape 2025 (Bruker), and m/z ratios were annotated with the MetaboScape custom database using a mass accuracy of ±10 ppm. Statistical boxplots between experimental conditions and heatmaps were then created using a shinyapps.
For MtDNA quantification, total DNA was extracted, and mitochondria DNA (mtDNA) copy numbers content was analyzed by SYBR Green real-time PCR. Samples were adjusted for nuclear DNA (nDNA) content. Relative mDNA content was determined using a comparative method (2ΔΔCT). Oligos for mtDNA were designed on MT-ND4 and oligos for B2M were used to normalize to the nuclear genome. All the primers used are listed in Data S2.
All statistical analyses were performed with GraphPad prism 6. We expressed data as mean ± SD of multiple biological replicates (as indicated in the figure legends). We determined statistical significance by unequal variance Student’s t test, one-way analysis of variance (ANOVA), two tail Nested t test, and Tukey’s multiple comparison test are shown figure legends and in Data S2. A p value of less than 0.05 was considered statistically significant.
¶ Supplemental information
¶ Human neuromuscular organoids mimic
¶ cancer-induced muscle cachexia
Pietro Chiolerio, Beatrice Auletta, Camilla Pezzini, Luigi Sartore, Giorgia Gregolon, Onelia Gagliano, Cecilia Laterza, Valeria Roxana Balmaceda Valdez, Davide Cacchiarelli, Camilla Luni, Carlo Viscomi, Melanie Planque, Sarah-Maria Fendt, Marco Sandri, Roberta Sartori, and Anna Urciuolo
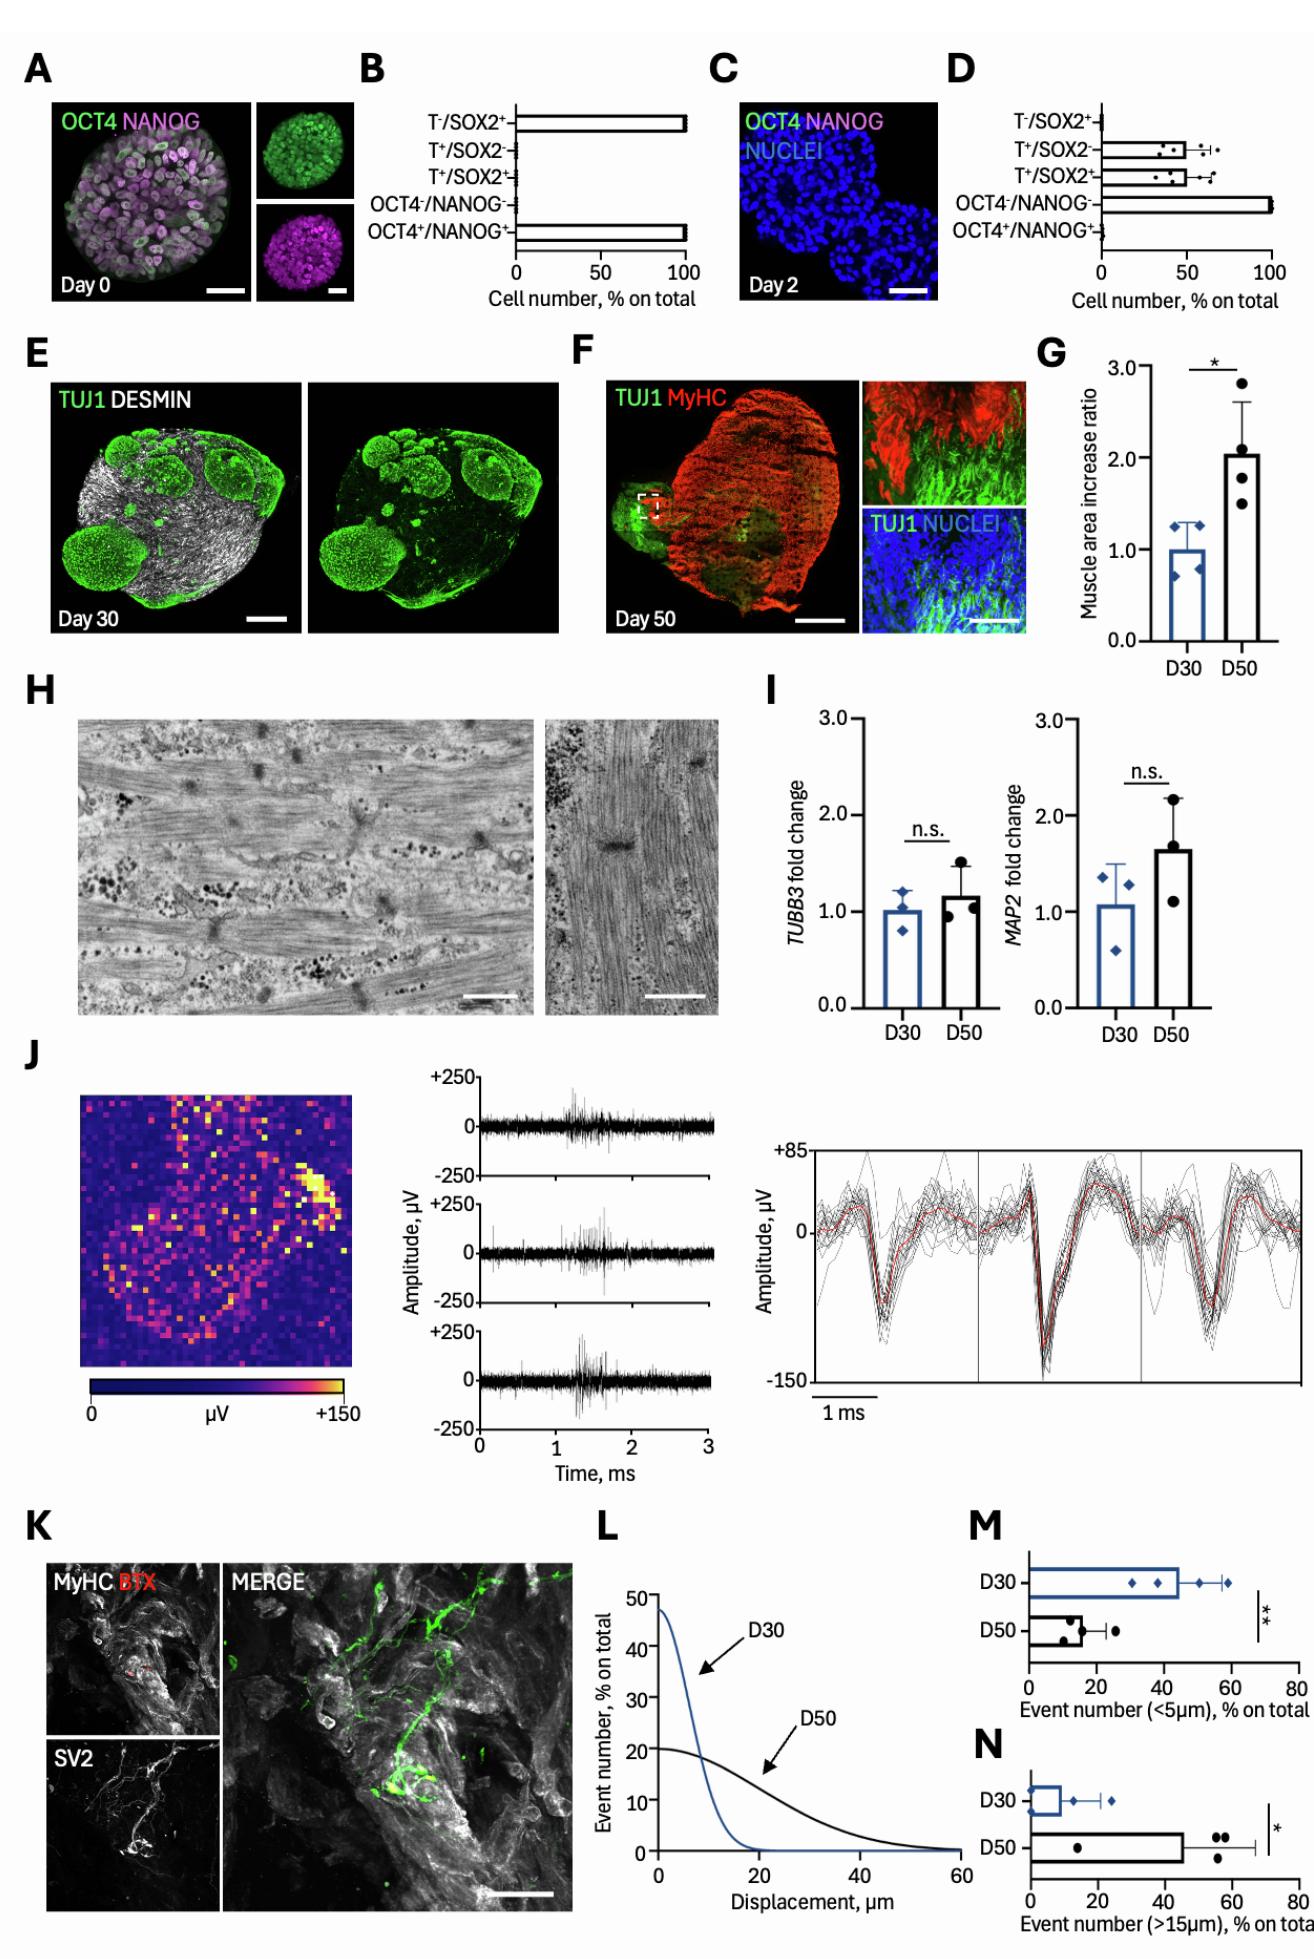
Figure S1. Characterization of the NMOs reported in Figure 1. A. Representative confocal immunofluorescence image showing pluripotent cells (co-expressing OCT4 and NANOG) at day 0 from hiPSC differentiation. Scale bars, 40 μm. B. Quantification of T- /SOX2+, T+/SOX2- , T+/SOX2+, NANOG-OCT4- , NANOG+OCT4+ identified at day 0 from hiPSC differentiation. Quantification is expressed as percentage of positive cells on total nuclei and data are shown as mean ± SD of ≥ 5 independent replicates. C Representative confocal immunofluorescence image for OCT4 and NANOG after 2 days from hiPSC differentiation. Scale bar, 40 μm. D. Quantification of T- /SOX2+, T+/SOX2- , T+/SOX2+, NANOG-OCT4- , NANOG+OCT4+ identified after 2 days from hiPSC differentiation. Quantification was expressed as percentage of positive cells on total nuclei and data are shown as mean ± SD of 6 independent replicates. E. Representative Z-stack confocal immunofluorescence images of NMOs after 30 days of differentiation stained in whole mount for TUJ-1 (green) and desmin (grey). The image showing only desmin staining is reported in Figure 1D. Scale bar, 320 μm. F. Representative Z-stack confocal immunofluorescence images of NMOs after 50 days of differentiation stained in cross section for TUJ-1 (green) and MyHC (red). Scale bars, 600 μm (left panel) and 85 μm (right panel). G. Quantification of muscle positive area (μm2) in day-30 (D30) and day-50 (D50) NMOs. Data are shown as mean ± SD of 4 independent replicates. Statistical significance was determined using unequal variance Student’s t test; *p = 0.0168. H. Representative electron microscopy images showing sarcomeric structures in D50 NMO sections. Scale bar, 500 nm. I. TUBB3 and MAP2 gene expression day-30 (D30) and day-50 (D50) NMOs. Data are normalized to GAPDH and TUBB3 gene expression, respectively, and displayed as fold change of D50 over D30 NMOs. Data are shown as mean ± SD of 3 independent biological replicates. Unequal variance Student’s t test was used; n.s. not significant. Mean CT values and relative standard deviation are listed in Data S2. J. Left, representative activity map of mean voltage amplitude in day-50 NMOs during 3Brain multi-electrode array (MEA) system under basal conditions. Amplitude intensity is color-coded according to the voltage scale (µV). See also Video S1. Centre, representative spike events in D50 NMO during 3Brain multi-electrode array (MEA) system basal activity recording. Each trace corresponds to the raw signal from a single electrode. Right, representative spike waveform from individual electrodes. Each plot shows the spike amplitude (µV) over the time (ms) from 3 individual electrodes; the red line indicates the averaged waveform. K. Representative Zstack confocal immunofluorescence images of NMOs after 50 days of differentiation stained for MyHC (grey), SV2 (left: grey, right: green) and α-bungarotoxin (BTX, red). Scale bar, 20 µm. L. Gaussian interpolation of frequency distribution of displacement events recorded upon ACh-stimulation within the ranges of 5 μm from 0 μm to a maximum of 60 μm in day-30 (D30, blue line) and day-50 (D50, black line) GFP+ NMOs. M. AChinduced displacement vectors frequency distribution in the range of 0-5 μm in D30 and D50 NMOs. Data are shown as mean ± SD of 4 NMOs/condition, and each dot indicates a single NMO. Statistical significance was determined using unequal variance Student’s t test; **p = 0.0073. N. ACh-induced displacement vectors frequency distribution in the range of >15 μm in D30 and D50 NMOs. Data are shown as mean ± SD of 4 NMOs/condition, and each dot indicates a single NMO. Statistical significance was determined using unequal variance Student’s t test; *p = 0.0234.
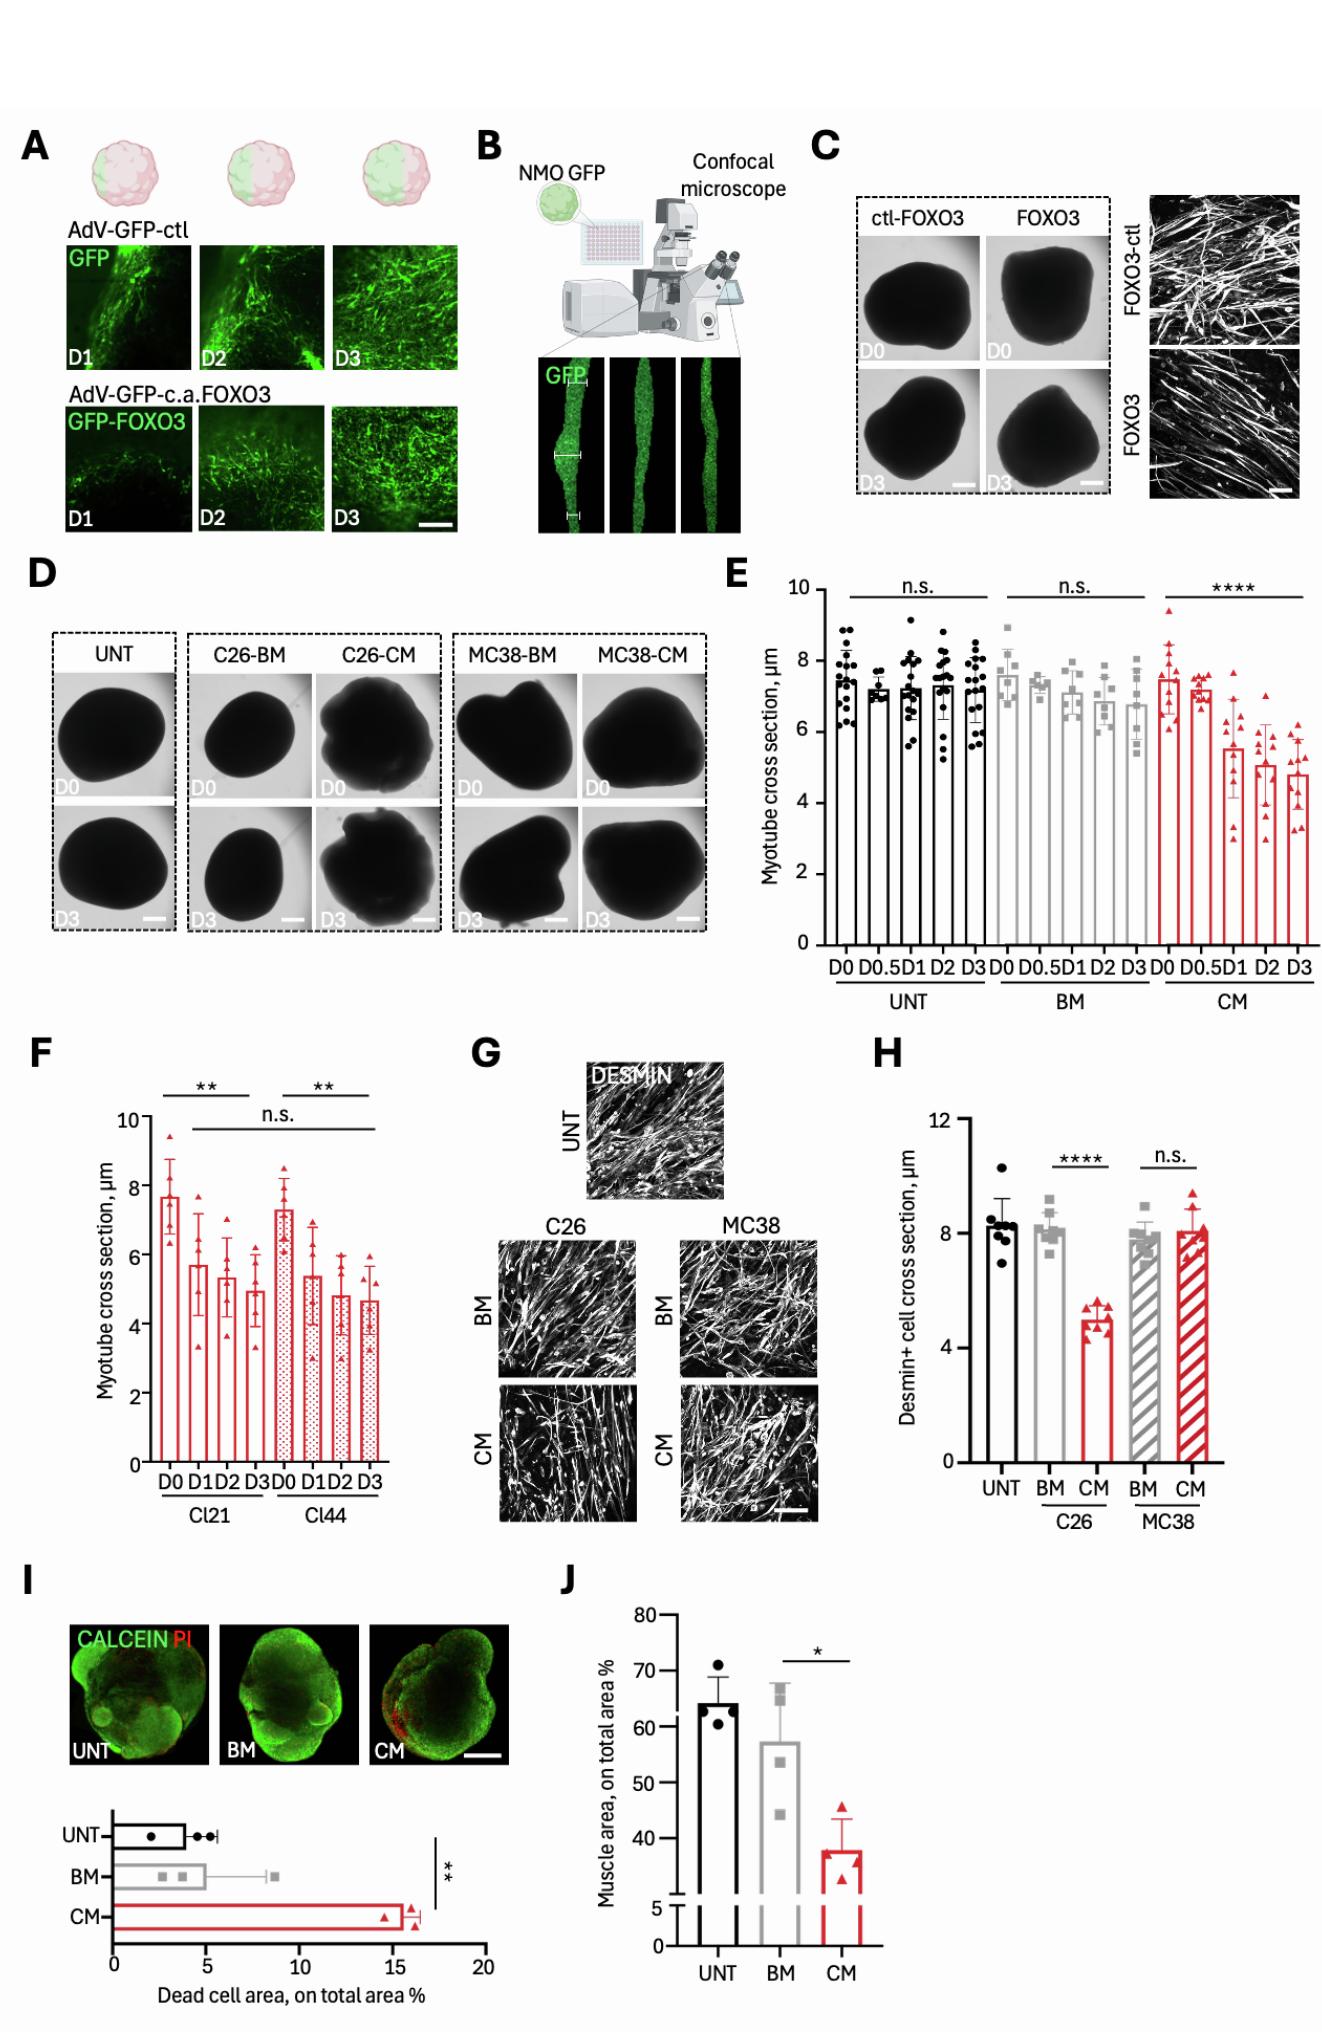
Figure S2. Characterization of the UNT, BM-C26, CM-C26, BM-MC38, CM-MC38 NMOs reported in Figure 2. A. Representative confocal images of AdV-GFP and AdV-GFP-c.a. FOXO3 treated NMOs after 1, 2 and 3 days (D1, D2 and D3) from infection. Scale bar, 200 µm. B. Schematic illustration showing the strategy used to quantify GFP+ myotubes cross-section in treated NMOs and controls during time-course live imaging analysis. C. Left, representative bright field (BF) images showing morphological appearance of NMOs before (D0) and upon 72h (D3) from AdV-GFP-ctl (ctl-FOXO3) and AdV-GFP-c.a. FOXO3 (FOXO3) treatments. Scale bars, 500 μm. Right, representative Z-stack confocal immunofluorescence images of D3 ctl-FOXO3 and D3 FOXO3 treated NMOs stained for desmin (grey). Scale bar, 50 µm. D. Representative bright field images showing morphological appearance of NMOs before (D0) and upon 72h (D3) C26- and MC38- BM and CM treatment. As control, experiments were performed in parallel in UNT condition. Scale bars, 500 μm. E. Quantification of GFP+ myotubes cross sections before (D0) and 12h (D0.5), 24h (D1), 48h (D2) and 72h (D3) after C26-BM and CM treatment (reported in Figure 2F) compared to the UNT condition. Data are shown as mean ± SD of the average myotube cross-sectional diameters per NMO at each time point. Each dot represents the mean value obtained from a single NMO, for which ≥ 20 myotube cross-sections were quantified and averaged. Measurements were performed for 3 images per each NMO. A total of ≥ 6 independent NMOs were analyzed per each condition. Statistical significance was determined using Ordinary One-way ANOVA; ***p < 0.0001. Statistical results are reported in Data S2. F. Quantification of GFP+ myotubes cross sections before (D0) and 24h (D1), 48h (D2) and 72h (D3) after C26-CM treatment in NMOs produced from two different clones (cl21 and cl44) of BJ-derived hiPSCs. Each dot represents the mean value obtained from a single NMO, for which ≥ 20 myotube cross-sections were quantified and averaged. Data reported here are also included in the samples group analyzed in Figure 2F. Measurements were performed for 3 images per each NMO. A total of ≥ 6 independent NMOs were analyzed per each condition. Statistical significance was determined using Ordinary One-way ANOVA; cl21, **p = 0.0015, cl44, **p = 0.0051. Statistical results are reported in Data S2. G. Representative Z-stack confocal immunofluorescence images for desmin (grey) of UNT NMOs and NMOs treated for 72h with C26- and MC38-BM/CM NMOs. Scale bar, 75 µm. H. Quantification of desmin+ myotubes cross sections in GFP+ day50 NMOs upon 72h of treatment with C26 and MC38-derived BM and CM. As control, the analysis was performed in parallel in UNT condition. Data are shown as mean ± SD of 240 myotube cross-sections per each condition, measured on ≥ 3 images per NMO considering 8 independent NMOs analyzed per each condition. Data are generated from the samples analyzed in Figure 2G. Statistical significance was determined using Ordinary One-way ANOVA; ****p < 0.0001. Statistical results are reported in Data S2. I. Representative confocal images of calcein and propidium iodide (PI) staining (upper panel), and quantification of dead cell area (propidium iodide positive area, lower panel) of NMOs upon 72h of treatment with C26-derived BM and CM. As control, the analysis was performed in parallel in UNT condition. Scale bar, 500 μm. Data are shown as mean ± SD of 3 independent NMOs analyzed per each condition. Statistical significance was determined using Ordinary One-way ANOVA; **p = 0.0023. Statistical results are reported in Data S2. J. Quantification of muscle area of NMOs upon 72h of treatment with C26-derived BM and CM. As control, the analysis was performed in parallel in UNT condition. Data are shown as mean ± SD of 2 whole mount images per NMO considering 4 independent NMOs analyzed per each condition. Statistical significance was determined using Ordinary One-way ANOVA; *p = 0.0116. Statistical results are reported in Data S2.
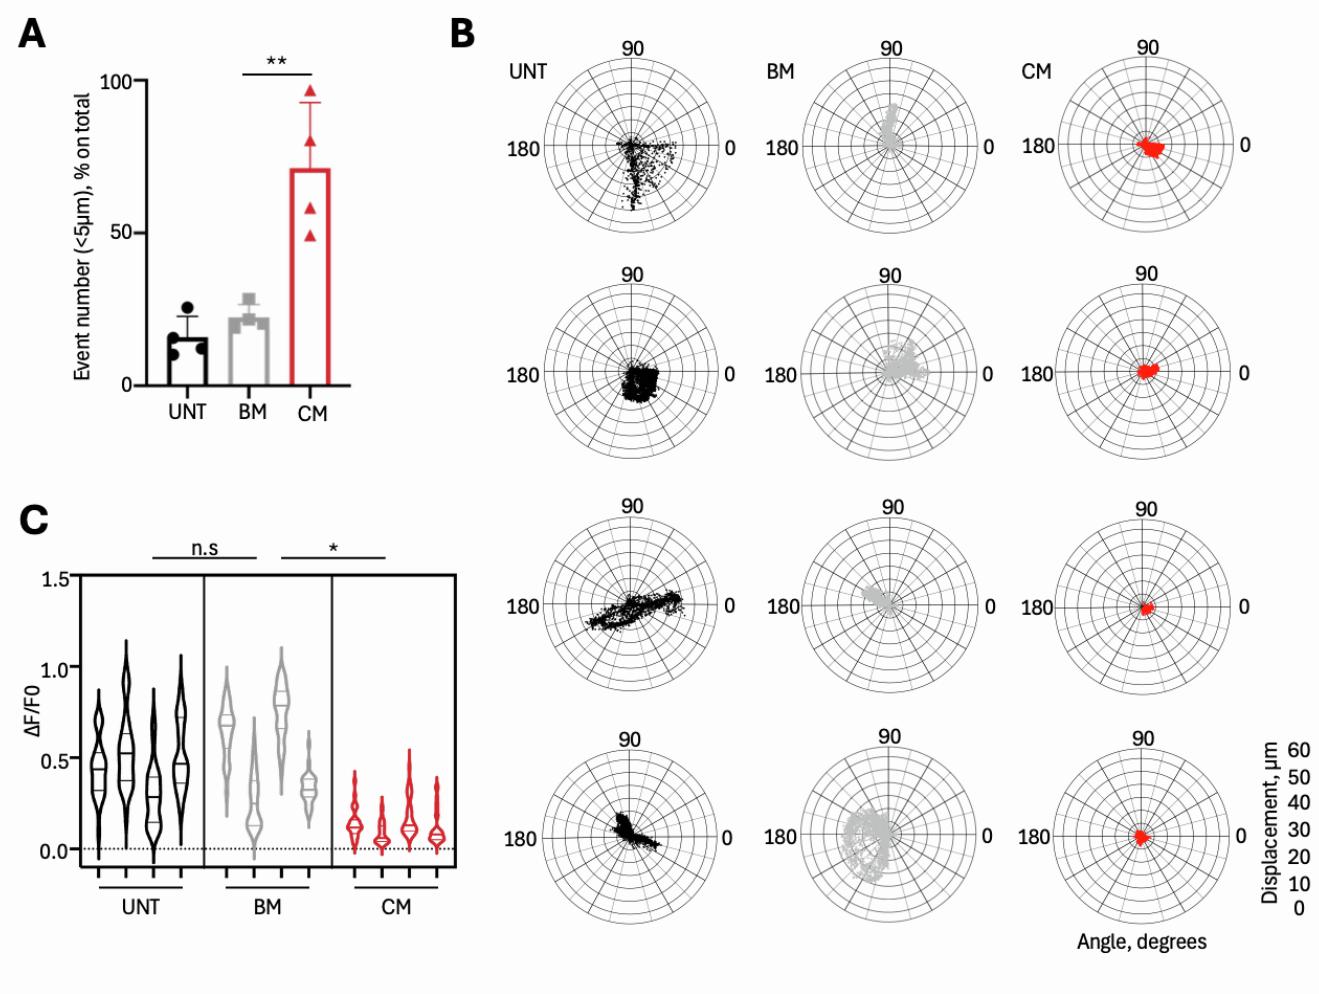
Figure S3. Characterization of UNT, BM-C26, CM-C26, NMOs reported in Figure 3. A. ACh-induced displacement vectors frequency distribution in the range of 1-5 μm in GFP+ day-53 NMOs 72h after C26- derived BM and CM treatment upon stimulation with ACh. As additional control, UNT condition was analyzed. Data are shown as mean ± SD of 4 NMOs/condition, and each dot indicates a single NMO. Statistical significance was determined using Ordinary One-way ANOVA; **p = 0.0014. Statistical results are reported in Data S2. B. Representative polar charts showing quantification of the maximum displacement (μm) and of the displacement directionality (angle, degree) obtained with PIVlab analysis of GFP+ D53 NMOs 72h after C26-derived BM and CM treatment upon stimulation with ACh. As additional control, UNT condition was analyzed. Single NMOs related to data reported in Figure 3F are shown. C. Violin plot showing quantification of calcium peak amplitude (ΔF/F0) detected with Fluo-4 live imaging analysis of GFP+ day-53 NMOs 72h after C26-derived BM and CM treatment compared to UNT condition upon stimulation with ACh. Data are generated from the samples analyzed in Figure 3H. Each violin represents the mean of the calcium spikes (n=30) of single NMOs (4 NMOs/condition). Statistical significance was determined using nested one-way ANOVA; *p = 0.0188. Statistical results are reported in Data S2.
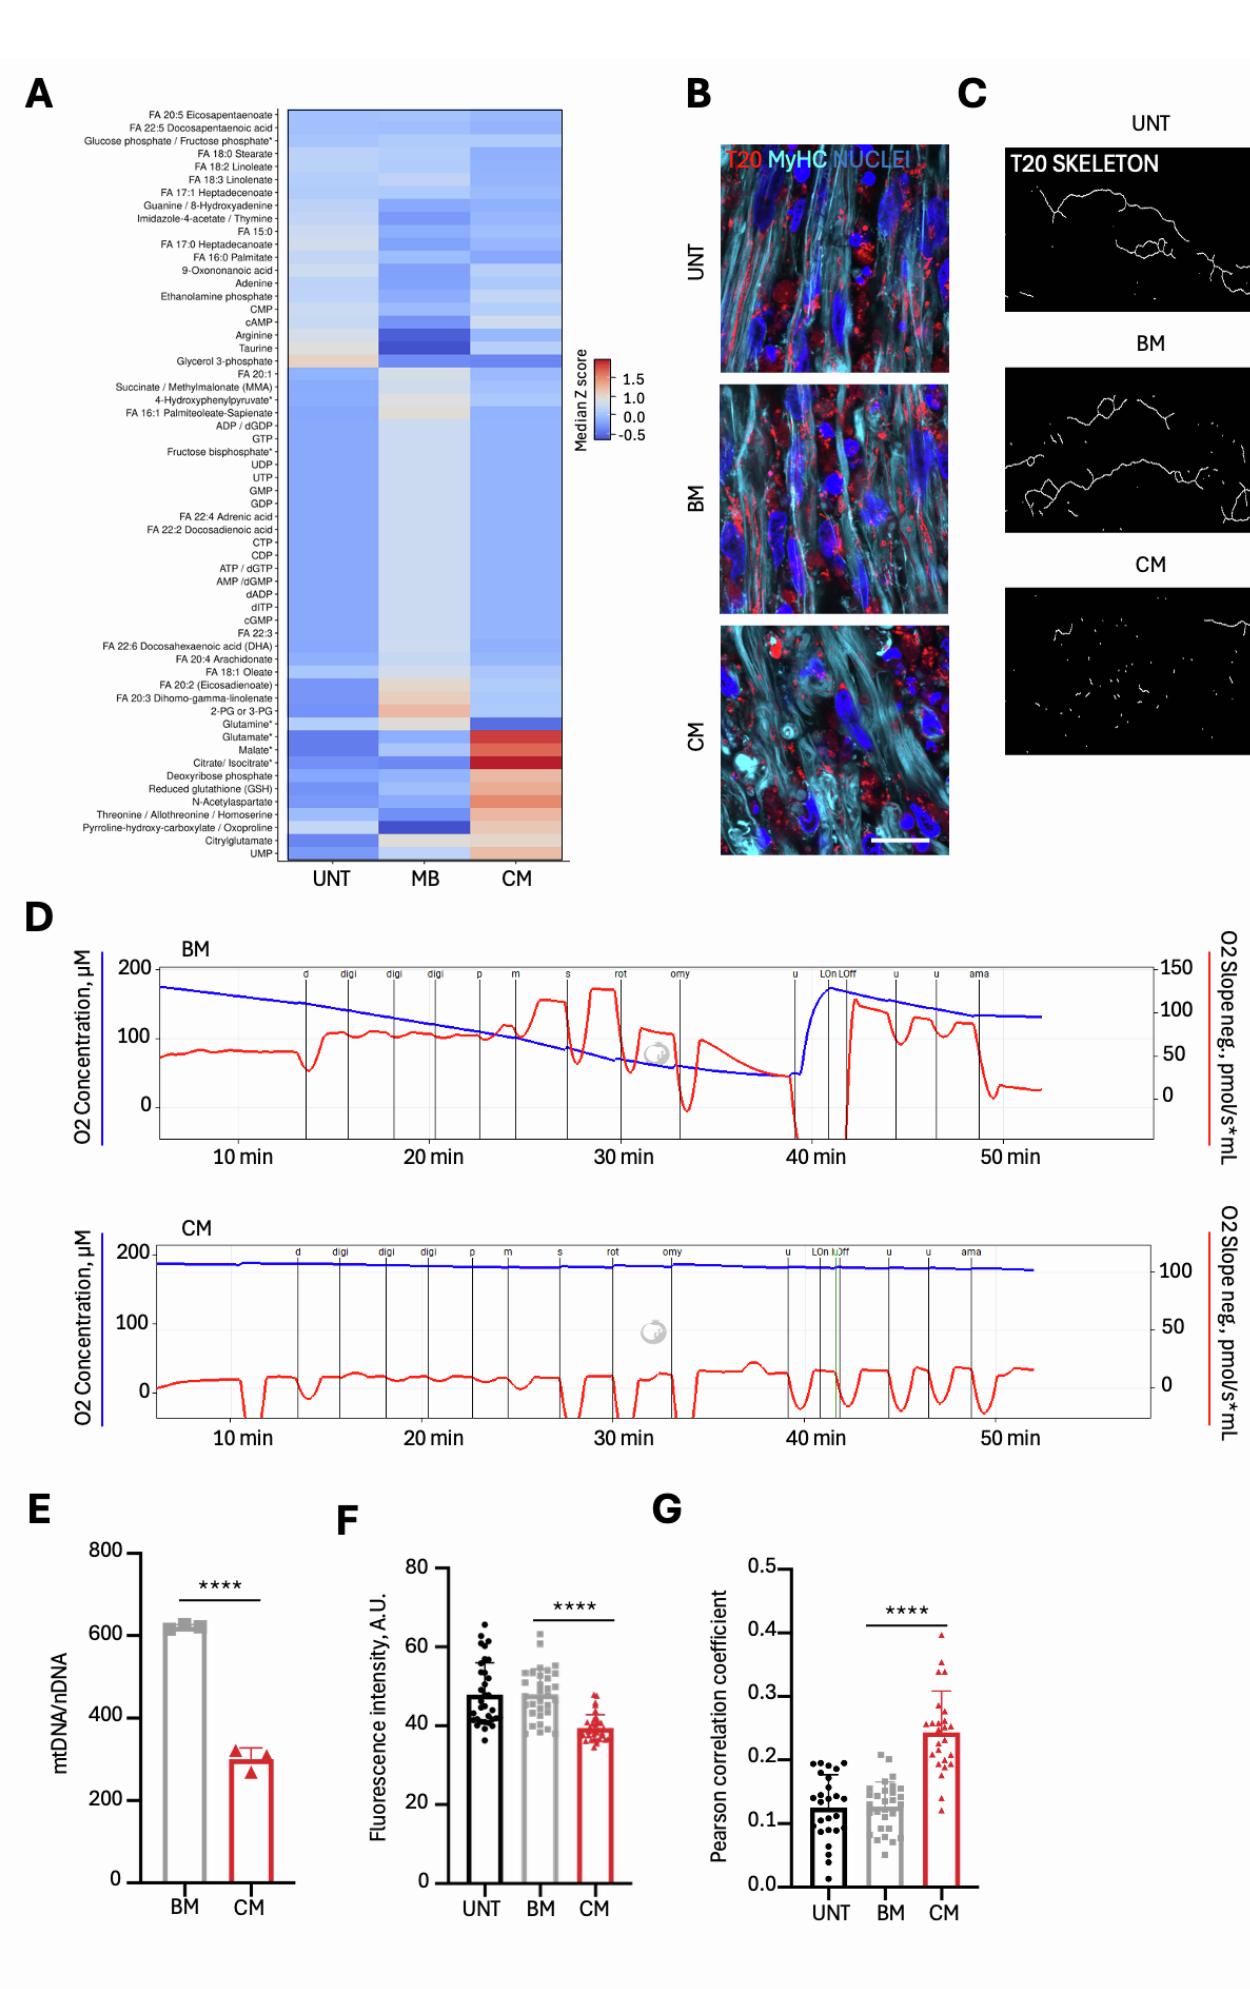
Figure S4. Characterization of UNT, BM-C26, CM-C26, NMOs reported in Figure 4. A. Heatmap showing quantification of the metabolites revealed in day-53 NMO sections 72h after C26-derived BM and CM treatments. As additional control, UNT condition was analyzed. Data are shown in Data S3. B. Representative confocal immunofluorescence image showing TOM20 (T20) and MyHC in D53 NMO sections 72h after C26-derived BM and CM treatments. As additional control, UNT condition was analyzed. TOM20 and nuclei co-staining images are reported in Figure 4D. Scale bar, 15 μm. C. Representative skeleton maps generated upon morphometric analysis of T20 stained NMOs along the different experimental conditions. D. Representative Oroboros trace that show oxygen concentration (µM, left axis) and oxygen consumption rate (negative O2 slope, right axis) over time in day-53 NMO sections 72h after C26-derived BM and CM treatments. As additional control, UNT condition was analyzed. Zoomed analysis are reported in Figure 4E. E. mtDNA content in NMOs treated with C26-BM and C26-CM. Data are reported as mean ± SD of 3 independent NMOs per each experimental condition. Statistical significance was determined using unequal variance Student’s t test; ****p < 0.0001. F. Quantification of intensity fluorescence of on T20 on identical ROI dimension, selected within MyHC-positive area. Each dot represents the measured intensity fluorescence per individual image; at least 10 images were analyzed for each 3 independent NMOs per each experimental condition. Statistical significance was determined using Ordinary One-way ANOVA; ****p < 0.0001. Statistical results are reported in Data S2. G. Quantification of thresholded Pearson correlation coefficient on T20 and LAMP1 (PCC). Each dot represents the PCC measured per individual image; at least 8 images were analyzed for each 3 independent NMOs per each experimental condition. Statistical significance was determined using Ordinary One-way ANOVA; ****p < 0.0001. Statistical results are reported in Data S2.