Journal: Science Advances, 12, eady2977 (2026), 18 February 2026
¶ Human microglia in brain assembloids display region-specific diversity and respond to hyperexcitable neurons carrying SCN2A mutation
Jiaxiang Wu1,2†, Xiaoling Chen1,2†, Jingliang Zhang1,2†, Kyle Wettschurack1,2†, Morgan Robinson1,2,3, Weihao Li4, Yuanrui Zhao1,2, Ye-Eun Yoo1,2, Brody A. Deming1,2, Yue Shu1,2, Akila D. Abeyaratna1,2, Zhefu Que1,2, Dongshu Du5, Matthew Tegtmeyer2,6, Chongli Yuan3, William C. Skarnes7, Zhong-Yin Zhang1, Jean-Christophe Rochet1,2, Long-Jun Wu8, Yang Yang1,2*
1Borch Department of Medicinal Chemistry and Molecular Pharmacology, College of Pharmacy, Purdue University, West Lafayette, IN 47907, USA.
2Purdue Institute for Integrative Neuroscience, Purdue University, West Lafayette, IN 47907, USA.
3Davidson School of Chemical Engineering, College of Engineering, Purdue University, West Lafayette, IN 47907, USA.
4ENT Institute and Department of Otorhinolaryngology, Eye & ENT Hospital, Fudan University, Shanghai 200031, China.
5School of Life Sciences, Shanghai University, Shanghai 200444, China.
6Department of Biological Sciences, Purdue University, West Lafayette, IN 47907, USA.
7The Jackson Laboratory for Genomic Medicine, Farmington, CT 06032, USA.
8Center for Neuroimmunology and Glial Biology, Institute of Molecular Medicine, University of Texas Health Science Center at Houston, Houston, TX 77030, USA.
* Corresponding author: Yang Yang, Email: yangyang@purdue.edu
† These authors contributed equally to this work.
¶ ABSTRACT
Microglia critically shape neuronal circuit development and function, yet their region-specific properties and roles in distinct circuits of the human brain remain poorly understood. In this study, we generated region-specific brain organoids (cortical, striatal, and midbrain), each integrated with human microglia, to fill this critical gap. Single-cell RNA sequencing uncovered six distinct microglial subtypes exhibiting unique regional signatures, including a subtype highly enriched for the GABAB receptor gene within striatal organoids. To investigate the contributions of microglia to neural circuitry, we created microglia-incorporated midbrain-striatal assembloids, modeling a core circuit node for many neuropsychiatric disorders, including autism. Using chemogenetics to activate this midbrain-striatal circuit, we observed increased calcium signaling in microglia involving GABAB receptors. Leveraging this model, we examined microglial responses within neural circuits harboring an SCN2A nonsense (C959X) mutation associated with profound autism. Microglia displayed heightened calcium responses to SCN2A mutation–mediated neuronal hyperactivity and engaged in excessive synaptic pruning. These pathological effects were reversed not only by pharmacological inhibition of microglial GABAB receptors but also by knockout of the GABBR1 gene in microglia. Collectively, our findings establish an advanced platform that can be used to dissect human neuroimmune interactions in subcortical regions and to evaluate previously undiscovered therapies, highlighting the important role of microglia in shaping critical circuitry related to neuropsychiatric disorders.
¶ INTRODUCTION
Microglia, the resident immune cells of the brain, originate from erythromyeloid progenitors in the yolk sac and migrate into the developing brain during early embryogenesis, where they subsequently differentiate and mature (1, 2). Beyond their classical functions as immune cells, microglia play indispensable roles in regulating neuronal maturation, synaptic refinement, and the assembly of cross-regional neural circuits throughout development (3–7). Notably, emerging evidence from rodent studies reveals remarkable region-specific identities of microglia that display spatial heterogeneity and function distinctly in different neuronal circuits and microenvironments (8–11). Bulk and single-cell transcriptomic analyses further reveal gene-expression profile-defined subpopulations of microglia across brain regions and developmental stages in rodent models (12, 13). Despite these advancements, the regional heterogeneity of human microglia, particularly in subcortical structures, such as the striatum and midbrain highly relevant to human neuropsychiatric disorders (14, 15), remains underexplored.
Microglial dysfunction has been strongly implicated in numerous neuropsychiatric disorders, including depression, schizophrenia, and autism spectrum disorder (ASD) (16–18). In our recent study, we identified microglial abnormalities in a monogenic form of ASD caused by a nonsense mutation in SCN2A, which encodes the voltage-gated sodium channel NaV1.2 (16). Using an ASD-associated Scn2a-deficient mouse model, we further observed aberrant microglial-mediated synaptic pruning, alongside deficits in synaptic formation and neuronal hyperexcitability (16, 19, 20). Microglia were also found to respond to hyperexcitable neurons through alterations in their calcium signaling (21, 22), which is known to be closely correlated with their phagocytic activity and synaptic pruning function (23). However, how human microglia behave within the critical midbrain-striatal circuits related to ASD remains unclear.
To address these gaps, here we developed human induced pluripotent stem cell (hiPSC)–derived organoid and assembloid models integrated with microglia, allowing in-depth exploration of microglial heterogeneity and neuroimmune interactions in human cell–based models. Our single-cell RNA sequencing (scRNA-seq) analysis identified distinct region-specific microglial subtypes, with striatal microglia notably enriched for genes encoding GABA receptors, notably GABAB receptors. Using chemogenetics and live calcium imaging, we observed that striatal microglia actively respond to the activation of the midbrain-striatal circuits involving GABAB receptors. Leveraging this advanced model, we revealed that the microglia can respond to hyperexcitability caused by an ASD-linked SCN2A nonsense mutation, exhibiting elevated calcium signaling and excessive synaptic pruning. Moreover, we found that pharmacological inhibition of GABAB receptors and genetic ablation of GABBR1 restored microglial activity to baseline and mitigated inhibitory synapse loss, highlighting a previously unknown GABAB receptor–dependent axis underlying neural circuit dysfunction in ASD. Our data also suggest that this advanced platform can be used to evaluate therapeutic agents.
¶ RESULTS
¶ hCO-Mg, hStrO-Mg, and hMO-Mg models reveal spatially correlated microglial heterogeneity in distinct human brain organoids
To investigate the spatiotemporal characteristics of human microglia in distinct brain regions composed of different neuronal types, we generated region-specific neural organoids alongside unspecialized/naïve microglia derived from hiPSCs (fig. S1A). These unspecialized microglia were subsequently cocultured with cortical, striatal, or midbrain organoids, establishing three distinct models: human cortical organoids with microglia (hCO-Mg), human striatal organoids with microglia (hStrO-Mg), and human midbrain organoids with microglia (hMO-Mg) (Fig. 1A). These coculture models enable microglial infiltration into specific brain regions, allowing microglia to naturally adopt regional properties from their local neural environment. Initially, microglia localized to organoid peripheries; they then progressively migrated into the parenchyma, achieving a non-clustered distribution after approximately 4 to 8 weeks (Fig. 1, B and C). This spatiotemporal pattern is consistent with our prior findings, which quantified microglial integration by the proportion of IBA1+ microglia per organoid (16). Regional identities of organoids were verified by specific neuronal markers: T-box brain protein 1 (TBR1) for hCO-Mg, GABA for hStrO-Mg, and tyrosine hydroxylase (TH) for hMO-Mg (Fig. 1D). Microglial morphology changed over time, transitioning from larger soma with fewer processes to smaller soma with complex branching, which represents an early-stage homeostatic-like microglia state that expressed key markers: CSF1R, P2RY12, and GPR34 (fig. S2, A to C and G to I). Our results suggest successful microglial integration into organoids.
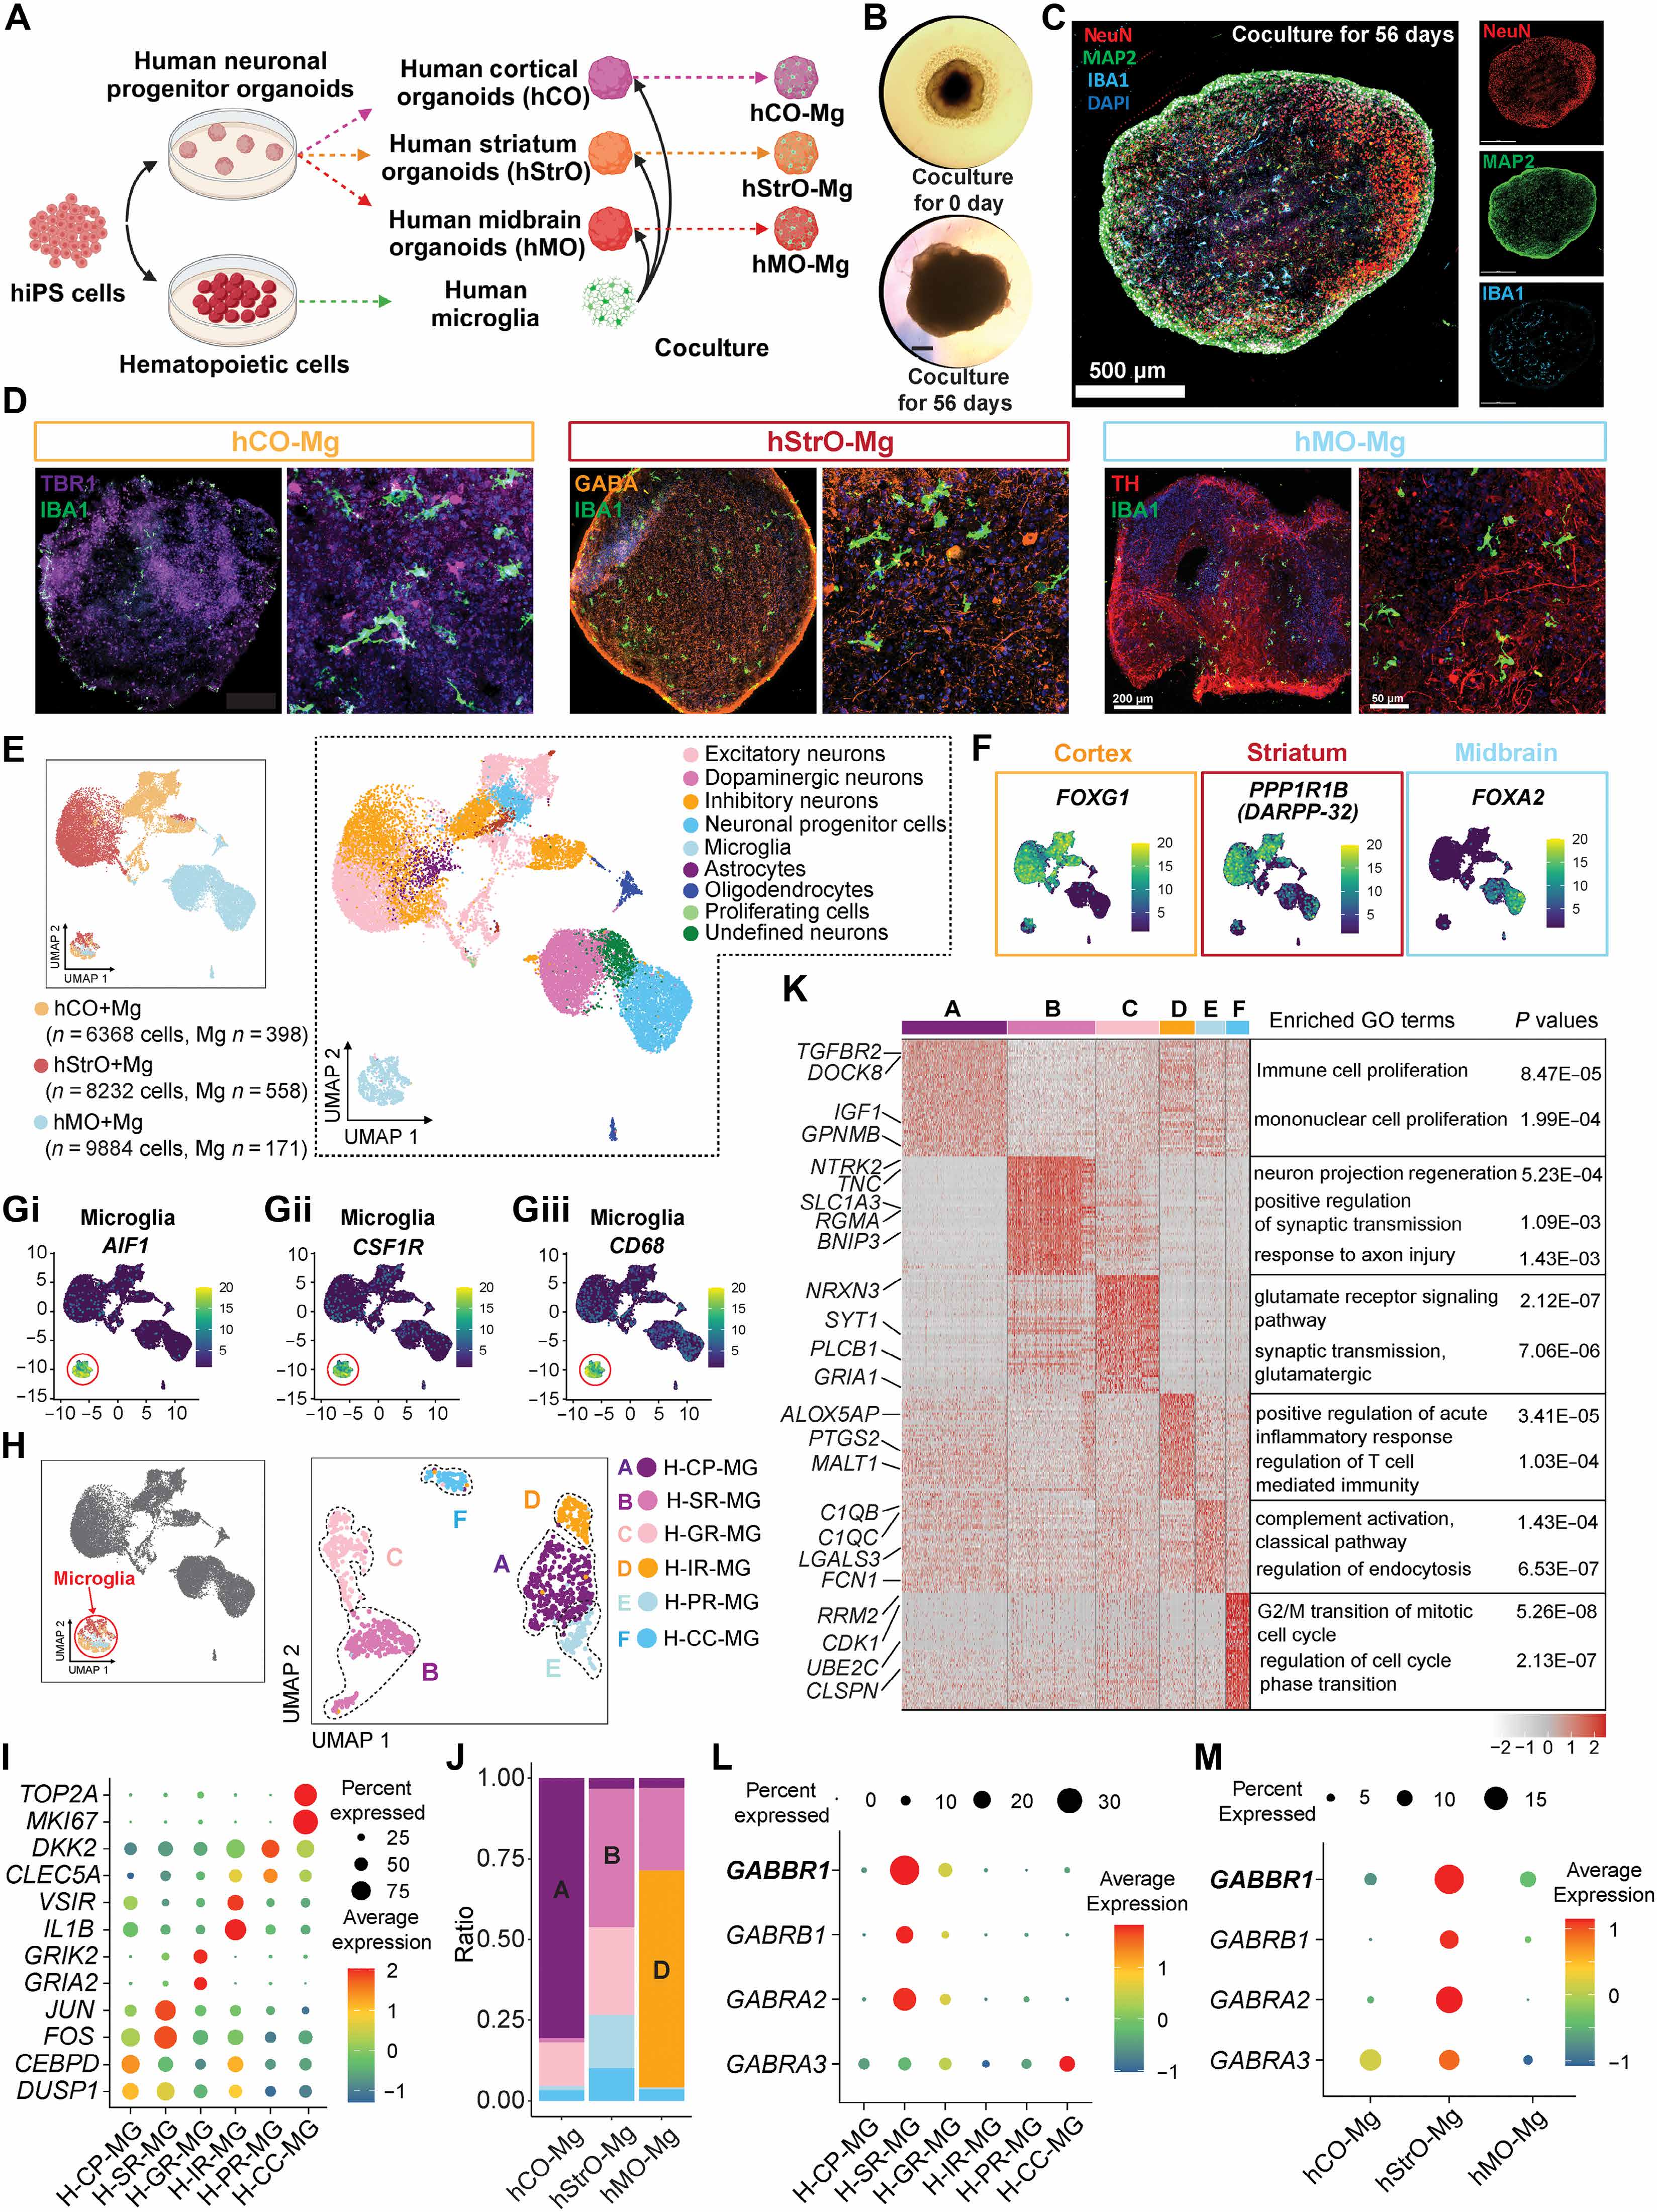
Figure 1. Region-specific brain organoids with microglia reveal spatially correlated microglial heterogeneity. (A) Schematic of region-specific organoid generation and microglial integration. (B and C) Microglial distribution in organoids over time. (D) Regional identity verification using specific neuronal markers (TBR1 for cortical, GABA for striatal, TH for midbrain). (E and F) UMAP visualization of scRNA-seq data showing region-specific neuronal clusters. (G) Microglial cluster identification using marker genes (AIF1, CSF1R, CD68). (H and I) Six distinct microglial subpopulations (clusters A to F) with unique gene expression profiles. (J and K) Distribution of microglial subpopulations across organoid types showing region-specific enrichment patterns. (L) GABA receptor gene expression in microglial clusters. (M) Enriched GABA receptor gene expression in hStrO-Mg microglia.
To understand the molecular profiles of microglia within these organoids, we conducted scRNA-seq. Transcriptomic analysis of integrated datasets identified nine clusters using uniform manifold approximation and projection (UMAP). The highly expressed region-specific neuronal marker genes (FOXG1, CAMK2A, GRIA2 for hCO; PPP1R1B, DLX1, GAD1, and GAD2 for hStrO; and FOXA2 and SHH for hMO) validated regional organoid identities (Fig. 1, E and F, and fig. S1, B to I). Microglial marker genes (AIF1, CSF1R, and CD68) distinctly identified microglia clusters on the UMAP plot (Fig. 1G). Further subclustering revealed six distinct microglial subpopulations (clusters A to F) (Fig. 1, H and I): Cluster A (human–cell proliferation–microglia, H-CP-MG) is marked by DUSP1 and CEBPD (24, 25); cluster B (human–stimulus response–microglia, H-SR-MG) expresses stimulus-responsive genes JUN and FOS; cluster C (human–glutamate-related response–microglia, H-GR-MG) is enriched in glutamate-related genes GRIK2 and GRIA2; cluster D (human–immune response–microglia, H-IR-MG) is featured by immune-response genes VSIR and IL1B; cluster E (human–pruning response–microglia, H-PR-MG) expresses synaptic pruning genes DKK2, C1QB, and FCN1; and cluster F (human–cell cycle–microglia, H-CC-MG) represents early developmental microglia expressing TOP2A and MKI67 (Fig. 1K).
To further assess regional microglial heterogeneity, we examined the distribution of microglial subpopulations across organoid types. Results showed striking enrichment patterns (Fig. 1, J and K): Cluster A was predominantly found in hCO-Mg (>75%) and exhibited high expression of TGFBR2, DOCK8, IGF1, and GPNMB. These genes were associated with enhanced proliferative capabilities by gene ontology (GO) analysis. Cluster B was notably enriched in hStrO-Mg (~50%) and demonstrated enriched expression of NTRK2, SLC1A3, and BNIP3. These genes were implicated in the modulation of neuronal excitability and synaptic plasticity by GO analysis. Cluster D is primarily populated by hMO-Mg (~70%) and prominently expresses ALOX5AP, PTGS2, and MALT1, indicative of specialized immune-regulatory functions. Furthermore, consistent with prior findings implicating GABA signaling in microglial activity and inhibitory circuit formation (26), hStrO-Mg microglia showed an overall enriched expression pattern of multiple GABA receptor–related genes (GABBR1, GABRB1, and GABRA2) (Fig. 1M and fig. S2, D to F). In particular, cluster B (H-SR-MG) exhibited predominant expression of these GABA receptor–related genes (Fig. 1L), correlating with the abundant GABAergic neurons in hStrO and suggesting functional interplay between these microglia and GABAergic neuronal populations. Collectively, our findings provide compelling evidence of region-specific microglial heterogeneity at the transcriptional level within cortical, striatal, and midbrain human organoids, reflecting spatially correlated microglial functional diversity.
¶ Microglia facilitate axonal projections and enhance assembloid formation
Rodent studies have demonstrated the critical role of microglia in shaping neural connectivity (27), influencing both local neural circuits (9, 26) and interregional projections (28). However, the function of microglia in human cell–based neural circuit models remains largely unexplored. Given that the striatum primarily receives projections from cortical glutamatergic neurons and midbrain dopaminergic neurons, we developed assembloid models to reconstruct these circuits by fusing human striatal organoids with microglia (hStrO-Mg) to either human cortical organoids (hCO-Mg) or human midbrain organoids (hMO-Mg) (Fig. 2A). After generating cortical-striatal-microglia assembloids (hCO-hStrO-Mg) and midbrain-striatal-microglia assembloids (hMO-hStrO-Mg), regional specificity was confirmed using marker expressions: TBR1 and CTIP2 for cortical organoids, GAD67 and DRD1 for striatal organoids, and FOXA2 and OTX2 for midbrain organoids (Fig. 2B). Furthermore, we validated that each organoid maintained the presence of microglia after fusion by performing coimmunostaining for GABA/IBA1 in cortical-striatal assembloids and TH/IBA1 in midbrain-striatal assembloids, confirming integration of neurons and microglia (Fig. 2, C and D).
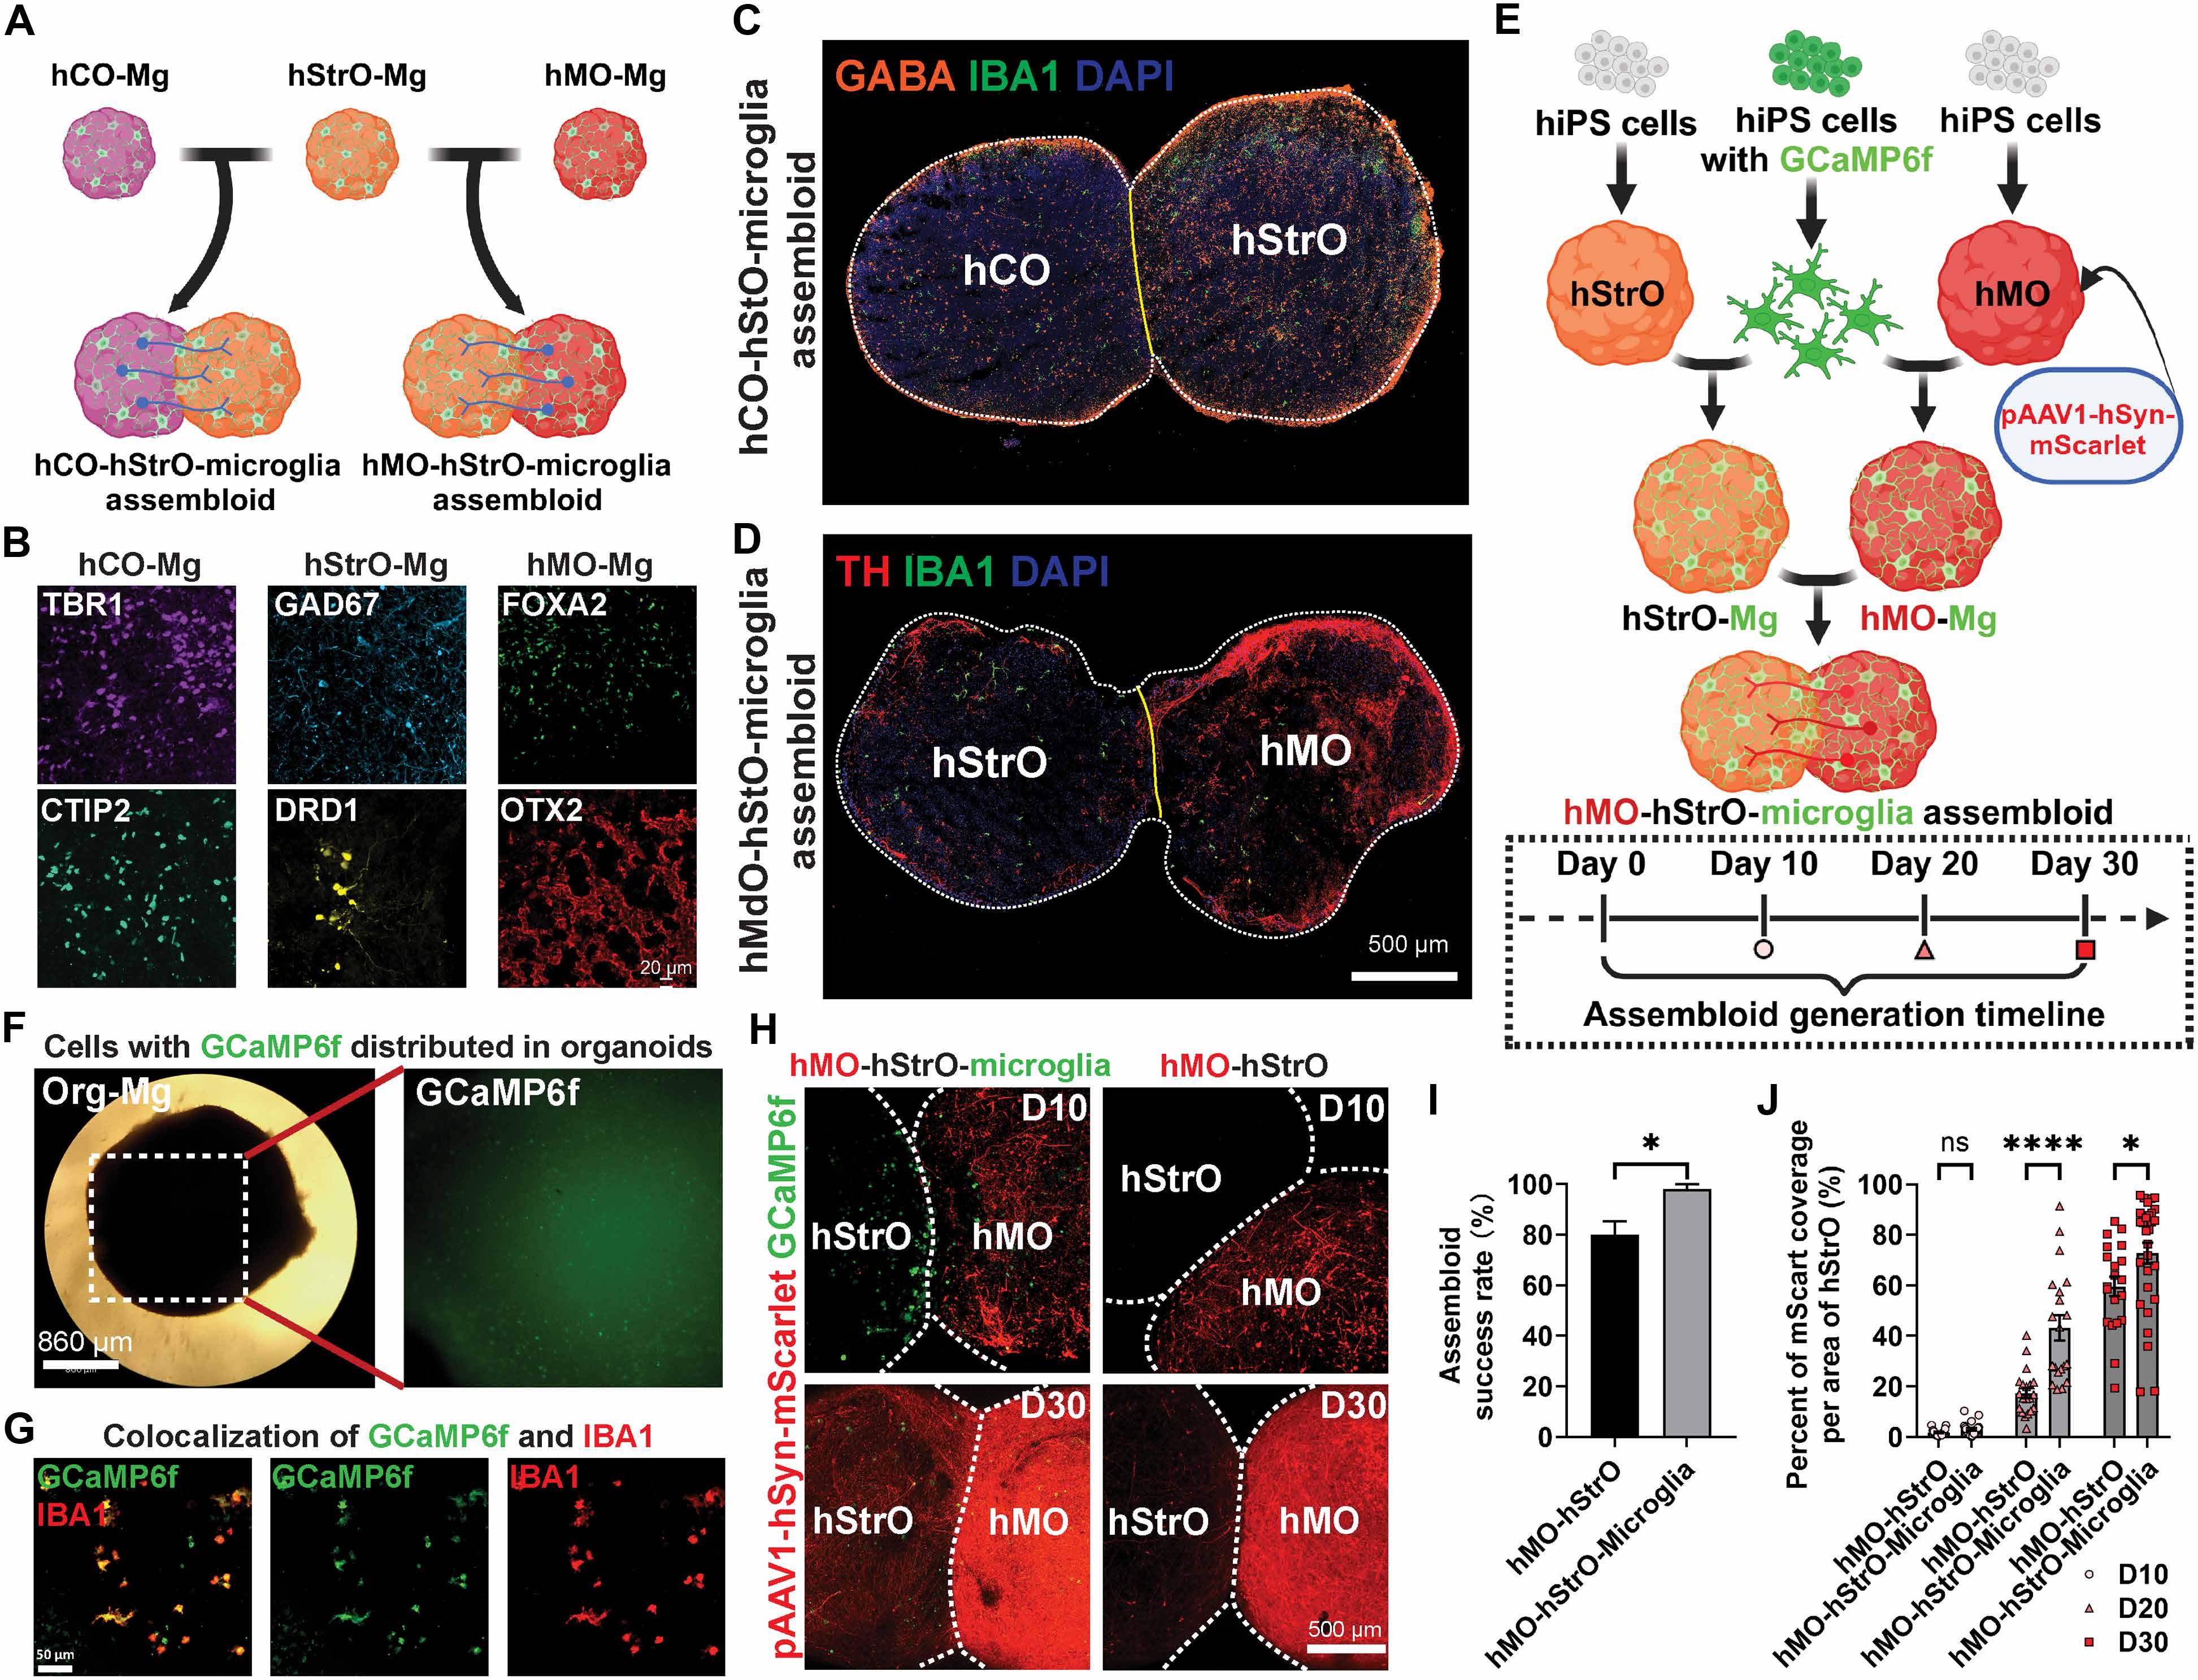
Figure 2. Microglia facilitate axonal projections and enhance assembloid formation. (A) Schematic of assembloid generation by fusing hStrO-Mg with hCO-Mg or hMO-Mg. (B) Regional specificity confirmation using marker expressions. (C and D) Microglia integration confirmation after fusion. (E and F) Midbrain-striatal assembloid reconstruction. (G) GCaMP6f-labeled microglia integration confirmation. (H and J) Progressive increase in midbrain-to-striatal axonal projections over time. (I) Fusion success rate comparison between microglia-containing and microglia-free organoid pairs.
The projection of midbrain dopaminergic neurons to striatal neurons forms a classical circuit implicated in various neuropsychiatric disorders (14). Yet, the contribution of microglia to this circuitry remains unclear. To elucidate it, we reconstructed midbrain-striatal assembloids (hMO-hStrO-Mg) (Fig. 2, E and F), using microglia derived from genetically modified hiPSC lines expressing the calcium sensor GCaMP6f (engineered at the AAVS safe harbor locus). The use of GCaMP6f-labeled microglia enables the live tracking of microglia and microglial calcium dynamics within these assembloids. Before fusion, midbrain organoids were labeled with pAAV-hSyn-mScarlet to visualize midbrain compartments distinctly. Immunostaining confirmed GCaMP6f-labeled microglia successfully integrated into assembloids, indicated by colocalization of IBA1 and GCaMP6f signals (Fig. 2G).
Live imaging postfusion revealed a progressive increase in mScarlet-labeled midbrain-to-striatal axonal projections over time (Fig. 2, H and J). Notably, microglia-integrated assembloids showed an initial clustering of microglia at the fusion interface by day 10, with subsequent redistribution at later stages. Moreover, assembloids containing microglia exhibited significantly enhanced mScarlet-labeled axonal projections compared to those without microglia (Fig. 2, H and J), along with notably higher fusion success rates defined as the proportion of organoid pairs that formed a stable fusion interface. Organoid pairs without microglia frequently detached after initial apposition, whereas microglia-containing pairs maintained stable fusion, resulting in a higher success rate (Fig. 2I). To pharmacologically validate dopaminergic transmission and assess circuit specificity and functional maturity, we performed high-density multielectrode array (HD-MEA) recordings while acutely blocking dopamine receptors in hMO-hStrO-Mg assembloids. Bath application of a D1 antagonist together with a D2 antagonist after a 2-min baseline caused a significant reduction of firing in the striatal compartment, whereas the midbrain compartment was not significantly affected (fig. S5, A to C). Our results suggest that the reconstructed midbrain-striatal circuit in hMO-hStrO-Mg assembloids is both specific and functionally mature. Together, these findings from our microglia-integrated assembloid model indicate that microglia actively facilitate axonal projections, significantly enhancing the assembly, and thereby promoting functional integration of midbrain-striatal circuits.
¶ Microglia respond to elevated neuronal activity in the hStrO region of hMO-hStrO assembloids
Microglia are known to respond dynamically to changes in neuronal activity (29, 30). Before we investigated how microglia sense neuronal activity within human midbrain-striatal circuits, we first performed experiments to validate the functional connectivity of the hMO-hStrO assembloids. We used a chemogenetics approach by transducing hMO-Mg neurons with pAAV-hSyn-hM3(Gq)-mCherry, enabling Gq-DREADD–mediated activation of the hMO neurons, which send axonal projections to the hStrO. These transduced hMO-Mg were then fused with hStrO-Mg to generate assembloids (Fig. 3A). Using HD-MEA, we recorded neural activity following the application of 10 μM clozapine N-oxide (CNO) to activate Gq-DREADDs in hMO. As expected, CNO robustly increased neuronal firing in the hMO region directly (Fig. 3, C and D). Notably, this elevated activity was efficiently transmitted to the hStrO compartment, as shown by increased neuronal firing in hStrO, confirming functional midbrain-striatal connectivity within assembloids (Fig. 3, C and D). Time-aligned mean firing rate traces, plotted separately by region, show a coordinated rise in hStrO firing ~60 to 90 s after CNO (fig. S6, A to C).
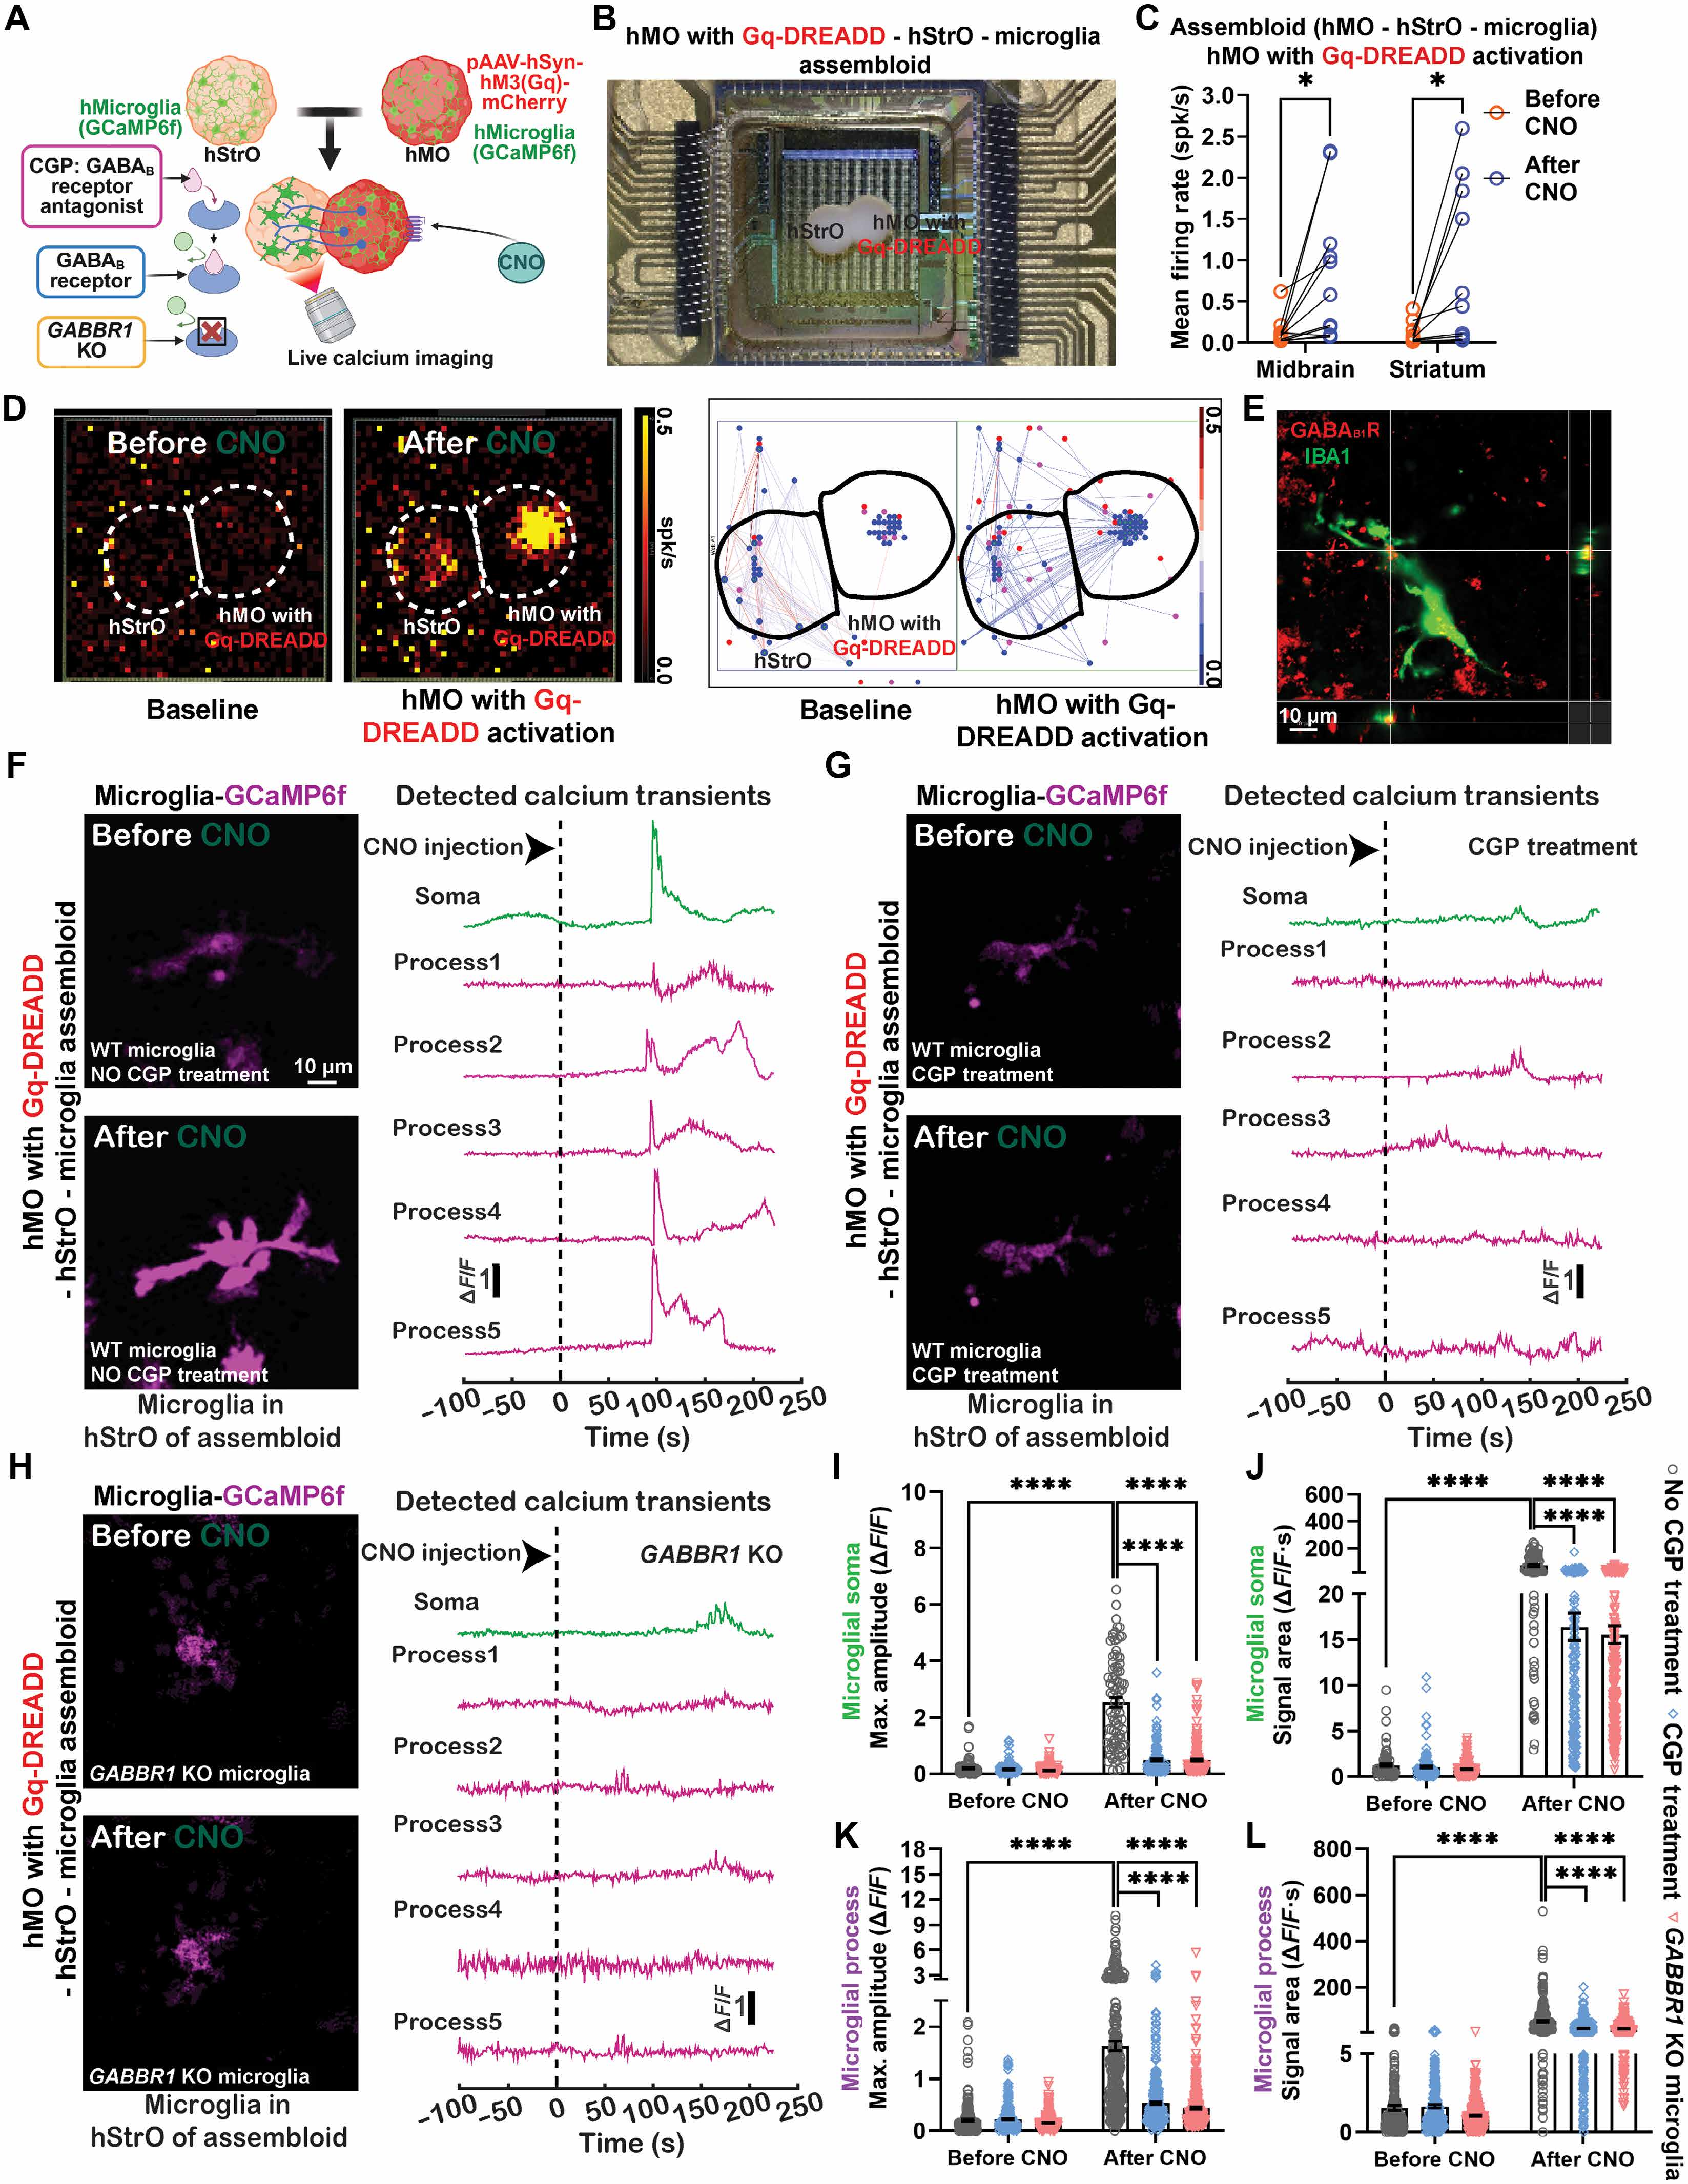
Figure 3. Microglia respond to elevated neuronal activity in hStrO region via GABAB receptors. (A) Chemogenetics approach schematic for activating midbrain-striatal circuit. (B) Experimental timeline. (C and D) HD-MEA recordings showing CNO-induced neuronal firing increase in hMO and hStrO. (E) GABAB receptor presence on microglia confirmed by IBA1/GABAB1R colocalization. (F to H) Calcium imaging of microglial somas and processes under different conditions (WT + CNO, WT + CNO + CGP, GABBR1 KO + CNO). (I to L) Quantification of calcium transients showing GABAB receptor-dependent microglial calcium dynamics.
Neuronal activity can induce microglial calcium dynamics (23). Given prior evidence implicating microglial GABAB receptors in regulating calcium activity (31), alongside our scRNA-seq data showing the enrichment of GABBR1-expressing microglia in the hStrO, we performed immunostaining in the hStrO region for IBA1 and GABAB1R (GABBR1), a GABAB receptor subunit. Colocalization of IBA1 and GABAB1R confirmed the presence of GABAB receptors on microglia (Fig. 3E). We next examined how GABAB receptors are involved in calcium dynamics in hStrO microglia using the endogenously expressed calcium sensor GCaMP6f within the midbrain-striatal circuit. Under basal conditions, both microglial somas and processes exhibited minimal spontaneous calcium activity in hStrO (Fig. 3, F and I to L). Following CNO-induced circuit activation, we observed a robust increase in calcium signals within microglial somas and processes in the hStrO (Fig. 3, F and I to L). We then applied CGP 55845 hydrochloride, a selective GABAB receptor antagonist (31), to block GABAB receptors. CGP treatment substantially suppressed the elevated microglial calcium signals induced by CNO in both somas and processes of microglia in hStrO (Fig. 3, G and I to L). As GABAB receptors are also expressed in neurons, we assessed whether CGP affected neuronal excitability. Although hStrO neurons showed a trend toward increased excitability upon CGP treatment, this change did not reach statistical significance (fig. S3, A to F), suggesting that our observed effects were largely from microglia. To further address pharmacological specificity and establish a direct role for microglial GABBR1 in the overactivated midbrain-striatal circuit, we repeated the experiments using isogenic GABBR1-knockout hiPSC lines harboring an endogenously expressed calcium sensor (GCaMP6f) (fig. S8, A and B). Under baseline conditions, microglial somas and processes again exhibited minimal spontaneous calcium activity in the hStrO (Fig. 3, H and I to L). In contrast to wild-type (WT) controls, CNO-induced circuit activation failed to elicit the robust elevation of microglial calcium signals in the GABBR1-knockout condition; calcium transients in both somas and processes of microglia remained low (Fig. 3, H and I to L). Together with the CGP 55845 blockade, these genetic loss-of-function data converge to demonstrate that microglial GABAB receptors are necessary for the CNO-evoked calcium dynamics in hStrO microglia within the midbrain-striatal circuit. Our findings align with previous studies showing that microglia can sense neuronal activity via GABA signaling (31) and potentially participate in sculpting inhibitory synapses (26).
¶ Microglia respond to hyperexcitable SCN2A-C959X assembloids via GABAB receptor–dependent calcium signaling and excessive synaptic pruning
The midbrain-striatal circuit is strongly implicated in ASD (15). Our previous work in a mouse model demonstrated that Scn2a deficiency disrupts synaptic transmission and triggers microglial activation, leading to increased synaptic engulfment and impaired neuronal plasticity (16, 32). However, the role of microglia in human midbrain-striatal assembloids carrying ASD-causing SCN2A mutations remains poorly understood. To address this gap, we established the hMO-hStrO-Mg model carrying a heterozygous SCN2A nonsense mutation (C959X) (Fig. 4A), previously identified in patients with profound ASD (33, 34). Electrophysiological analysis revealed significantly elevated network activity in the C959X (CX) assembloids compared with the isogenic WT control (fig. S4). To further assess neuronal excitability, we performed patch-clamp recordings of medium spiny neurons (MSNs) in the hStrO region. We revealed that MSNs in the CX assembloids exhibited significantly increased current-evoked action potential firing (Fig. 4, B and C), confirming hyperexcitable phenotypes of the midbrain-striatal circuit with SCN2A deficiency.
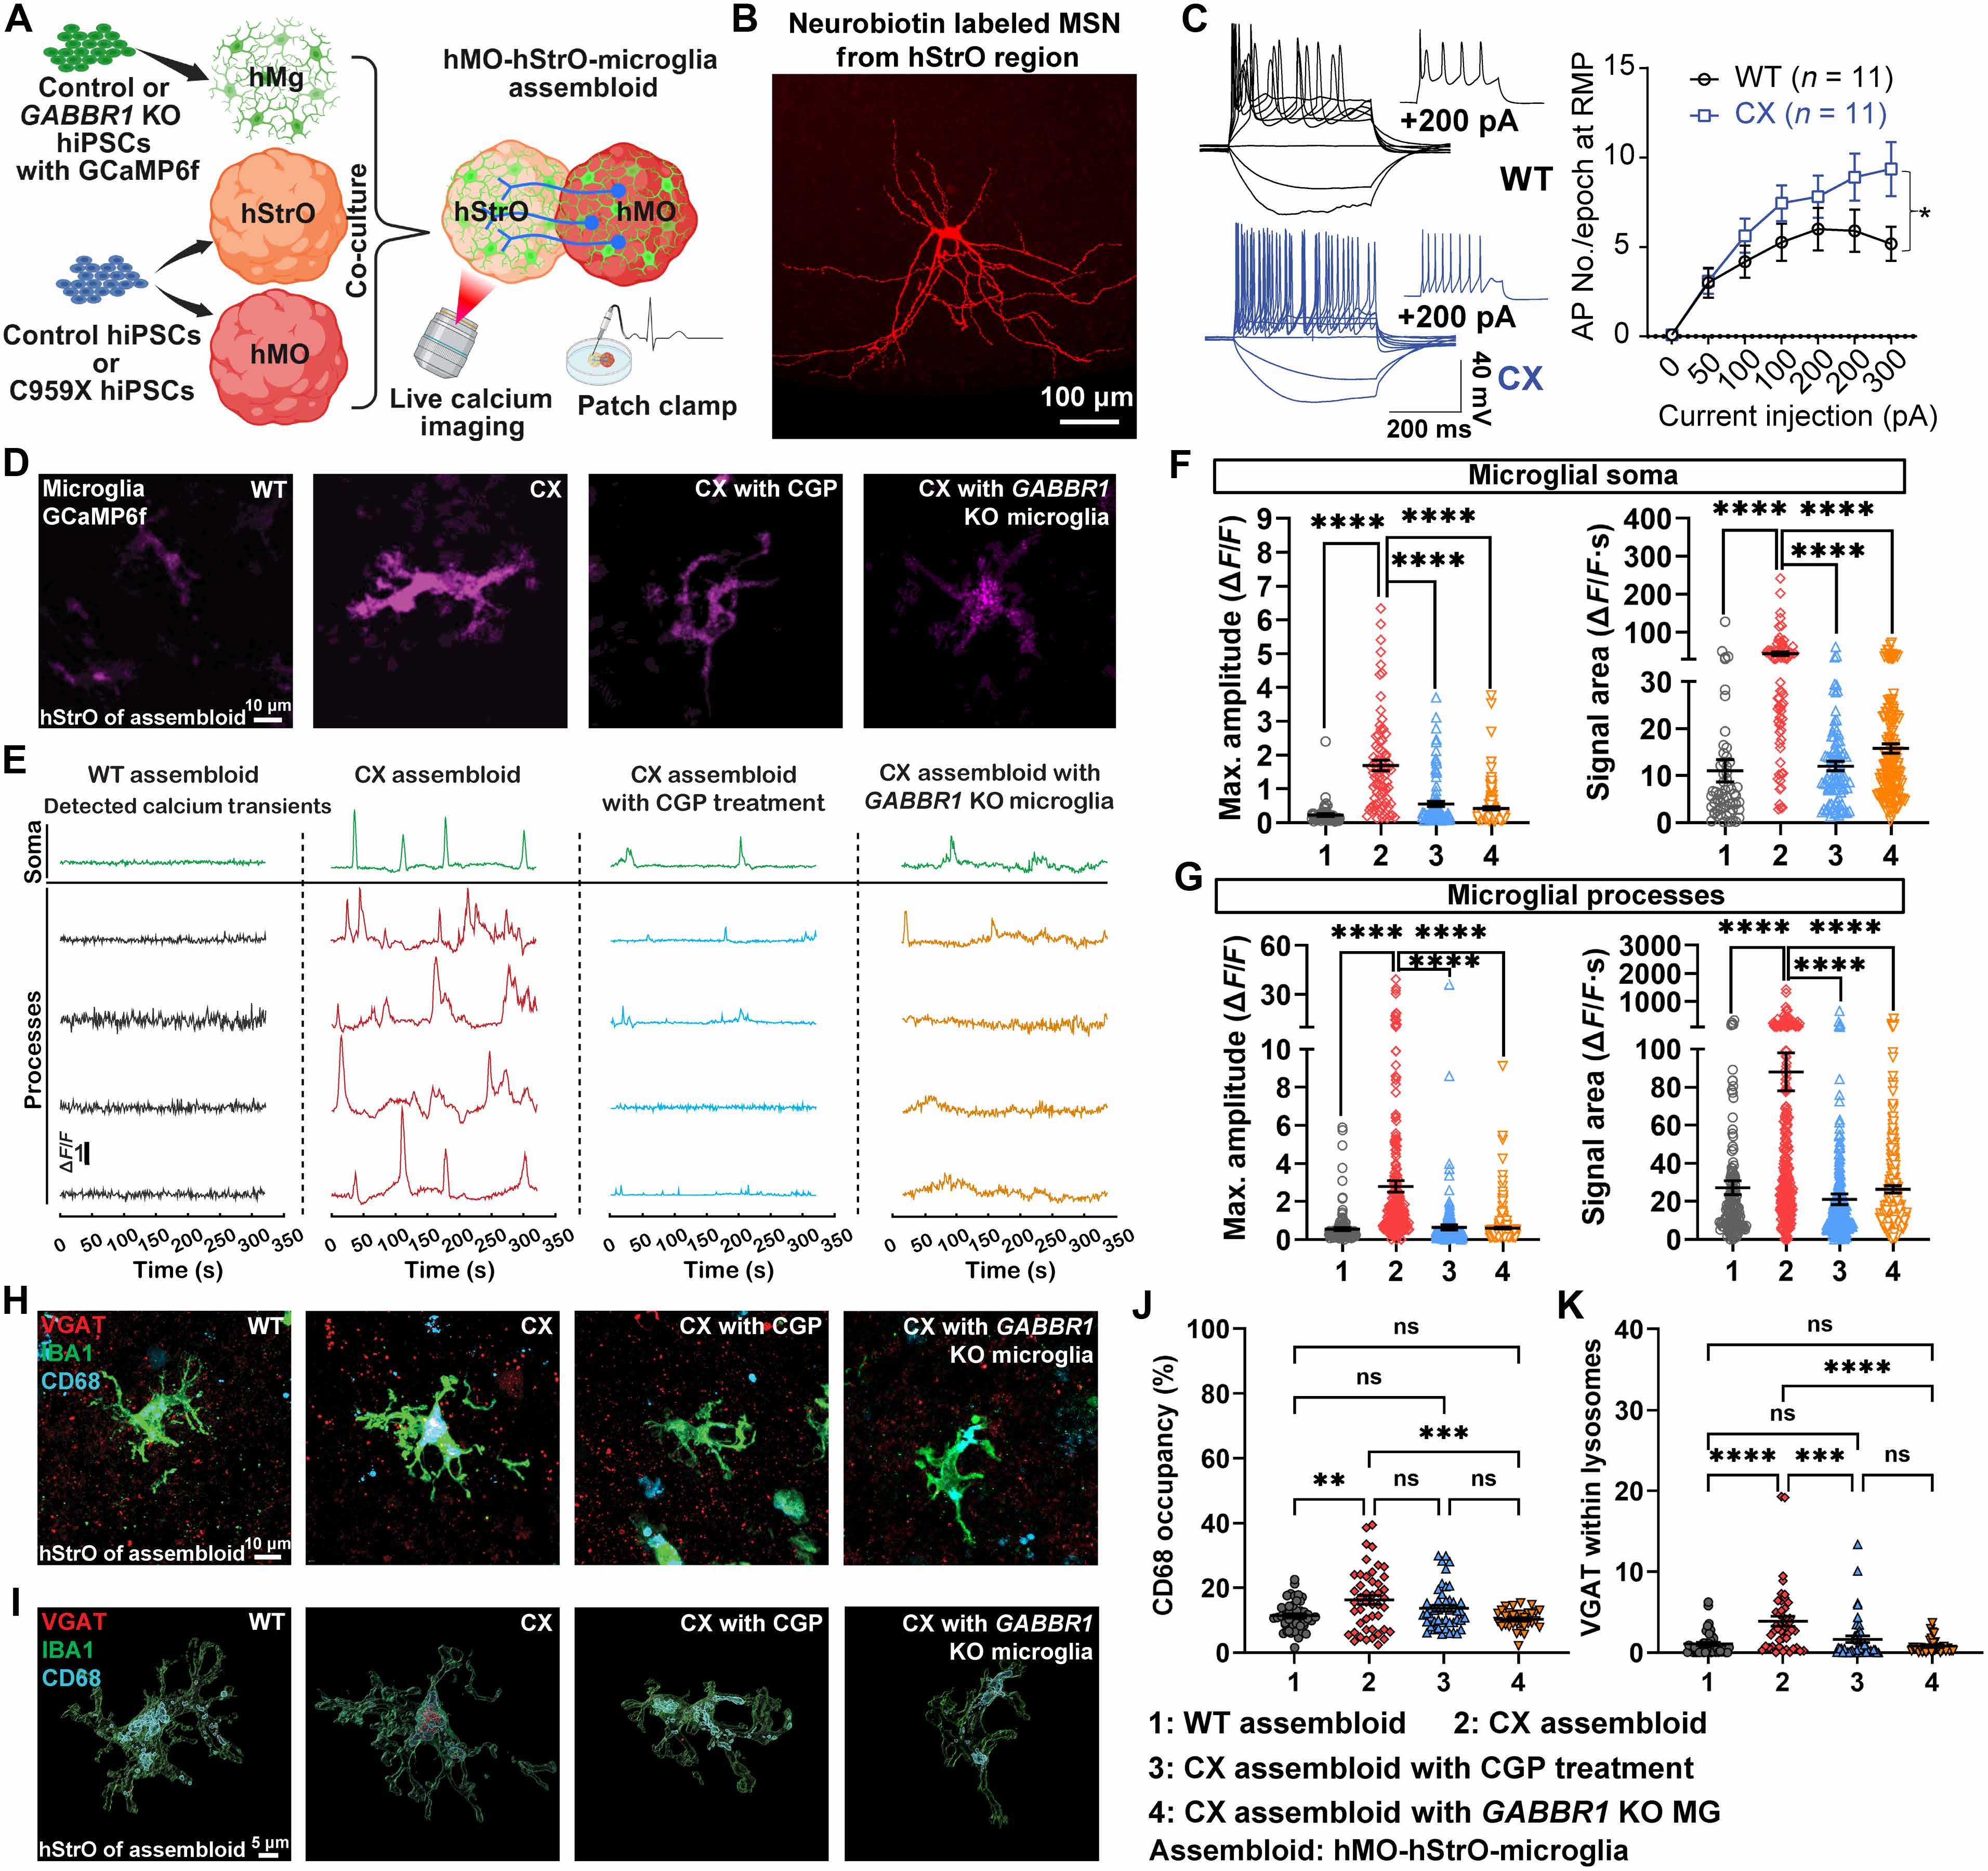
Figure 4. Microglia respond to SCN2A-C959X hyperexcitability via GABAB receptor-dependent calcium signaling and excessive synaptic pruning. (A) SCN2A-C959X assembloid model schematic. (B and C) Patch-clamp recordings showing increased action potential firing in CX MSNs. (D and E) Calcium imaging experimental setup. (F and G) Elevated microglial calcium activity in CX assembloids, attenuated by GABBR1 knockout. (H) Experimental timeline. (I) Quantification of calcium transients. (J) Increased lysosomal volume in CX microglia. (K) Enhanced VGAT+ terminal phagocytosis by microglia in CX assembloids, rescued by GABBR1 knockout.
Given the responsiveness of microglial calcium signaling to neuronal activity, we used real-time live-cell calcium imaging to monitor microglial responses in the hStrO region (Fig. 4, D and E). As it was demonstrated that SCN2A is a neuron-specific gene that has minimal expression in microglia (22), we used WT GCaMP6f and GABBR1 KO GCaMP6f microglia to explore how microglia sense neuronal hyperexcitability in the CX midbrain-striatal assembloids. Compared with the microglia in the WT assembloids, microglia in the CX assembloids displayed significantly elevated calcium activity in both their somas and processes (Fig. 4, F and G). Microglial overpruning of synapses has been implicated in various neuropsychiatric disorders (35). To investigate whether microglia in CX assembloids contribute to synaptic dysfunction in our model, we performed triple immunofluorescence staining for VGAT, IBA1, and CD68. Our 3D reconstruction and volumetric analysis using Imaris revealed a substantial increase in lysosomal volume (Fig. 4J) and enhanced phagocytosis of VGAT-positive inhibitory presynaptic terminals by microglia in the CX assembloids (Fig. 4K), indicating excessive pruning of inhibitory synapses. Importantly, disrupting microglial GABAB signaling, either pharmacologically with CGP 55845 or genetically via GABBR1 knockout, attenuated microglial Ca2+ signals and reduced VGAT engulfment (Fig. 4, D to G and K). Moreover, pre/postsynaptic colocalization analyses (VGAT-Gephyrin) revealed a reduction of inhibitory contacts in CX assembloids relative to WT, which was rescued by microglia-specific GABBR1 knockout, supporting that microglial GABAB receptors contribute to inhibitory synaptic deficits (fig. S7). Together, these findings indicate that microglia respond to SCN2A C959X–induced neuronal hyperactivity through GABAB receptor–dependent Ca2+ signaling, contributing to excessive pruning of inhibitory synapses. Our results thus highlight a critical neuroimmune mechanism contributing to synaptic pathology in human cell–based ASD models and suggest a potential strategy targeting microglial GABA signaling for intervention.
¶ DISCUSSION
Brain organoids and assembloids have rapidly advanced over the past decade, making it possible to study neurodevelopment and neuropsychiatric disorders in 3D structurally organized human cells. While microglia are critical in regulating neuronal function and circuitry (36), the region-specific identities of microglia and their role in subcortical circuits remain largely unknown. In this study, using scRNA-seq, we revealed distinct, region-specific microglial subtypes, with striatal microglia showing notable enrichment in the GABAB receptor gene. Using chemogenetics combined with live-cell calcium imaging, we demonstrated that these striatal microglia dynamically respond to elevated neuronal activity in midbrain-striatal circuits. We found microglia can also respond to hyperexcitable circuitry harboring autism-causing SCN2A protein-truncating variant C959X, by increasing microglial calcium signaling, and performing excessive synaptic pruning. Moreover, we found that pharmacological inhibition of GABAB receptors and genetic ablation of GABBR1 effectively normalized microglial activity and mitigated inhibitory synaptic loss in neurons. Our study thus demonstrates the utility of a powerful platform that can be utilized to understand the roles of microglia in human brain circuitry and neuropsychiatric disorders and to assess the efficacy of novel therapeutic agents for a number of brain disorders (Fig. 5). Rodent and postmortem human tissue studies have revealed that microglia exhibit region-specific phenotypes, including distinct morphologies, cell densities, and gene/protein expression profiles (37, 38). Such region-specific features of microglia are thought to be shaped by developmental timing, local neuronal identities, and microenvironmental cues (8–10, 12, 13, 39, 40). These dynamic local signals may prompt microglia to perform distinct functions related to synaptic pruning as well as facilitate circuit maturation and axonal projection based on the local context. Given that most insights into microglia diversity to date come from rodent models or postmortem human tissues, our study fills a critical gap by establishing human brain circuit models to study the identities and functions of human microglia. Using single-cell transcriptomic analysis, we identified six distinct microglial subtypes across three region-specific brain organoids, with each region displaying a characteristic distribution of these subpopulations. Notably, three subtypes (A, B, and F) we identified from our study to a certain degree correspond to microglial populations observed in the early developing human brain tissues (38), strengthening the utility of our platform to model human microglia in brain development. In particular, it is worth mentioning that the majority of microglia in hStrO-Mg are type B microglia, showing significant enrichment of GABAB receptor gene expression. This is interesting, considering the abundance of GABAergic neurons in the striatum. Notably, this finding also aligns with evidence from mouse studies, where regional environments (e.g., GABA- or glutamate-enriched circuits) drive transitions in microglial subtypes (29, 41). Together, we suggest that our unique human cell–based models provide an advanced platform that, when complemented by animal models and human tissues, can comprehensively elucidate the functions of microglial subtypes across different brain regions and species.
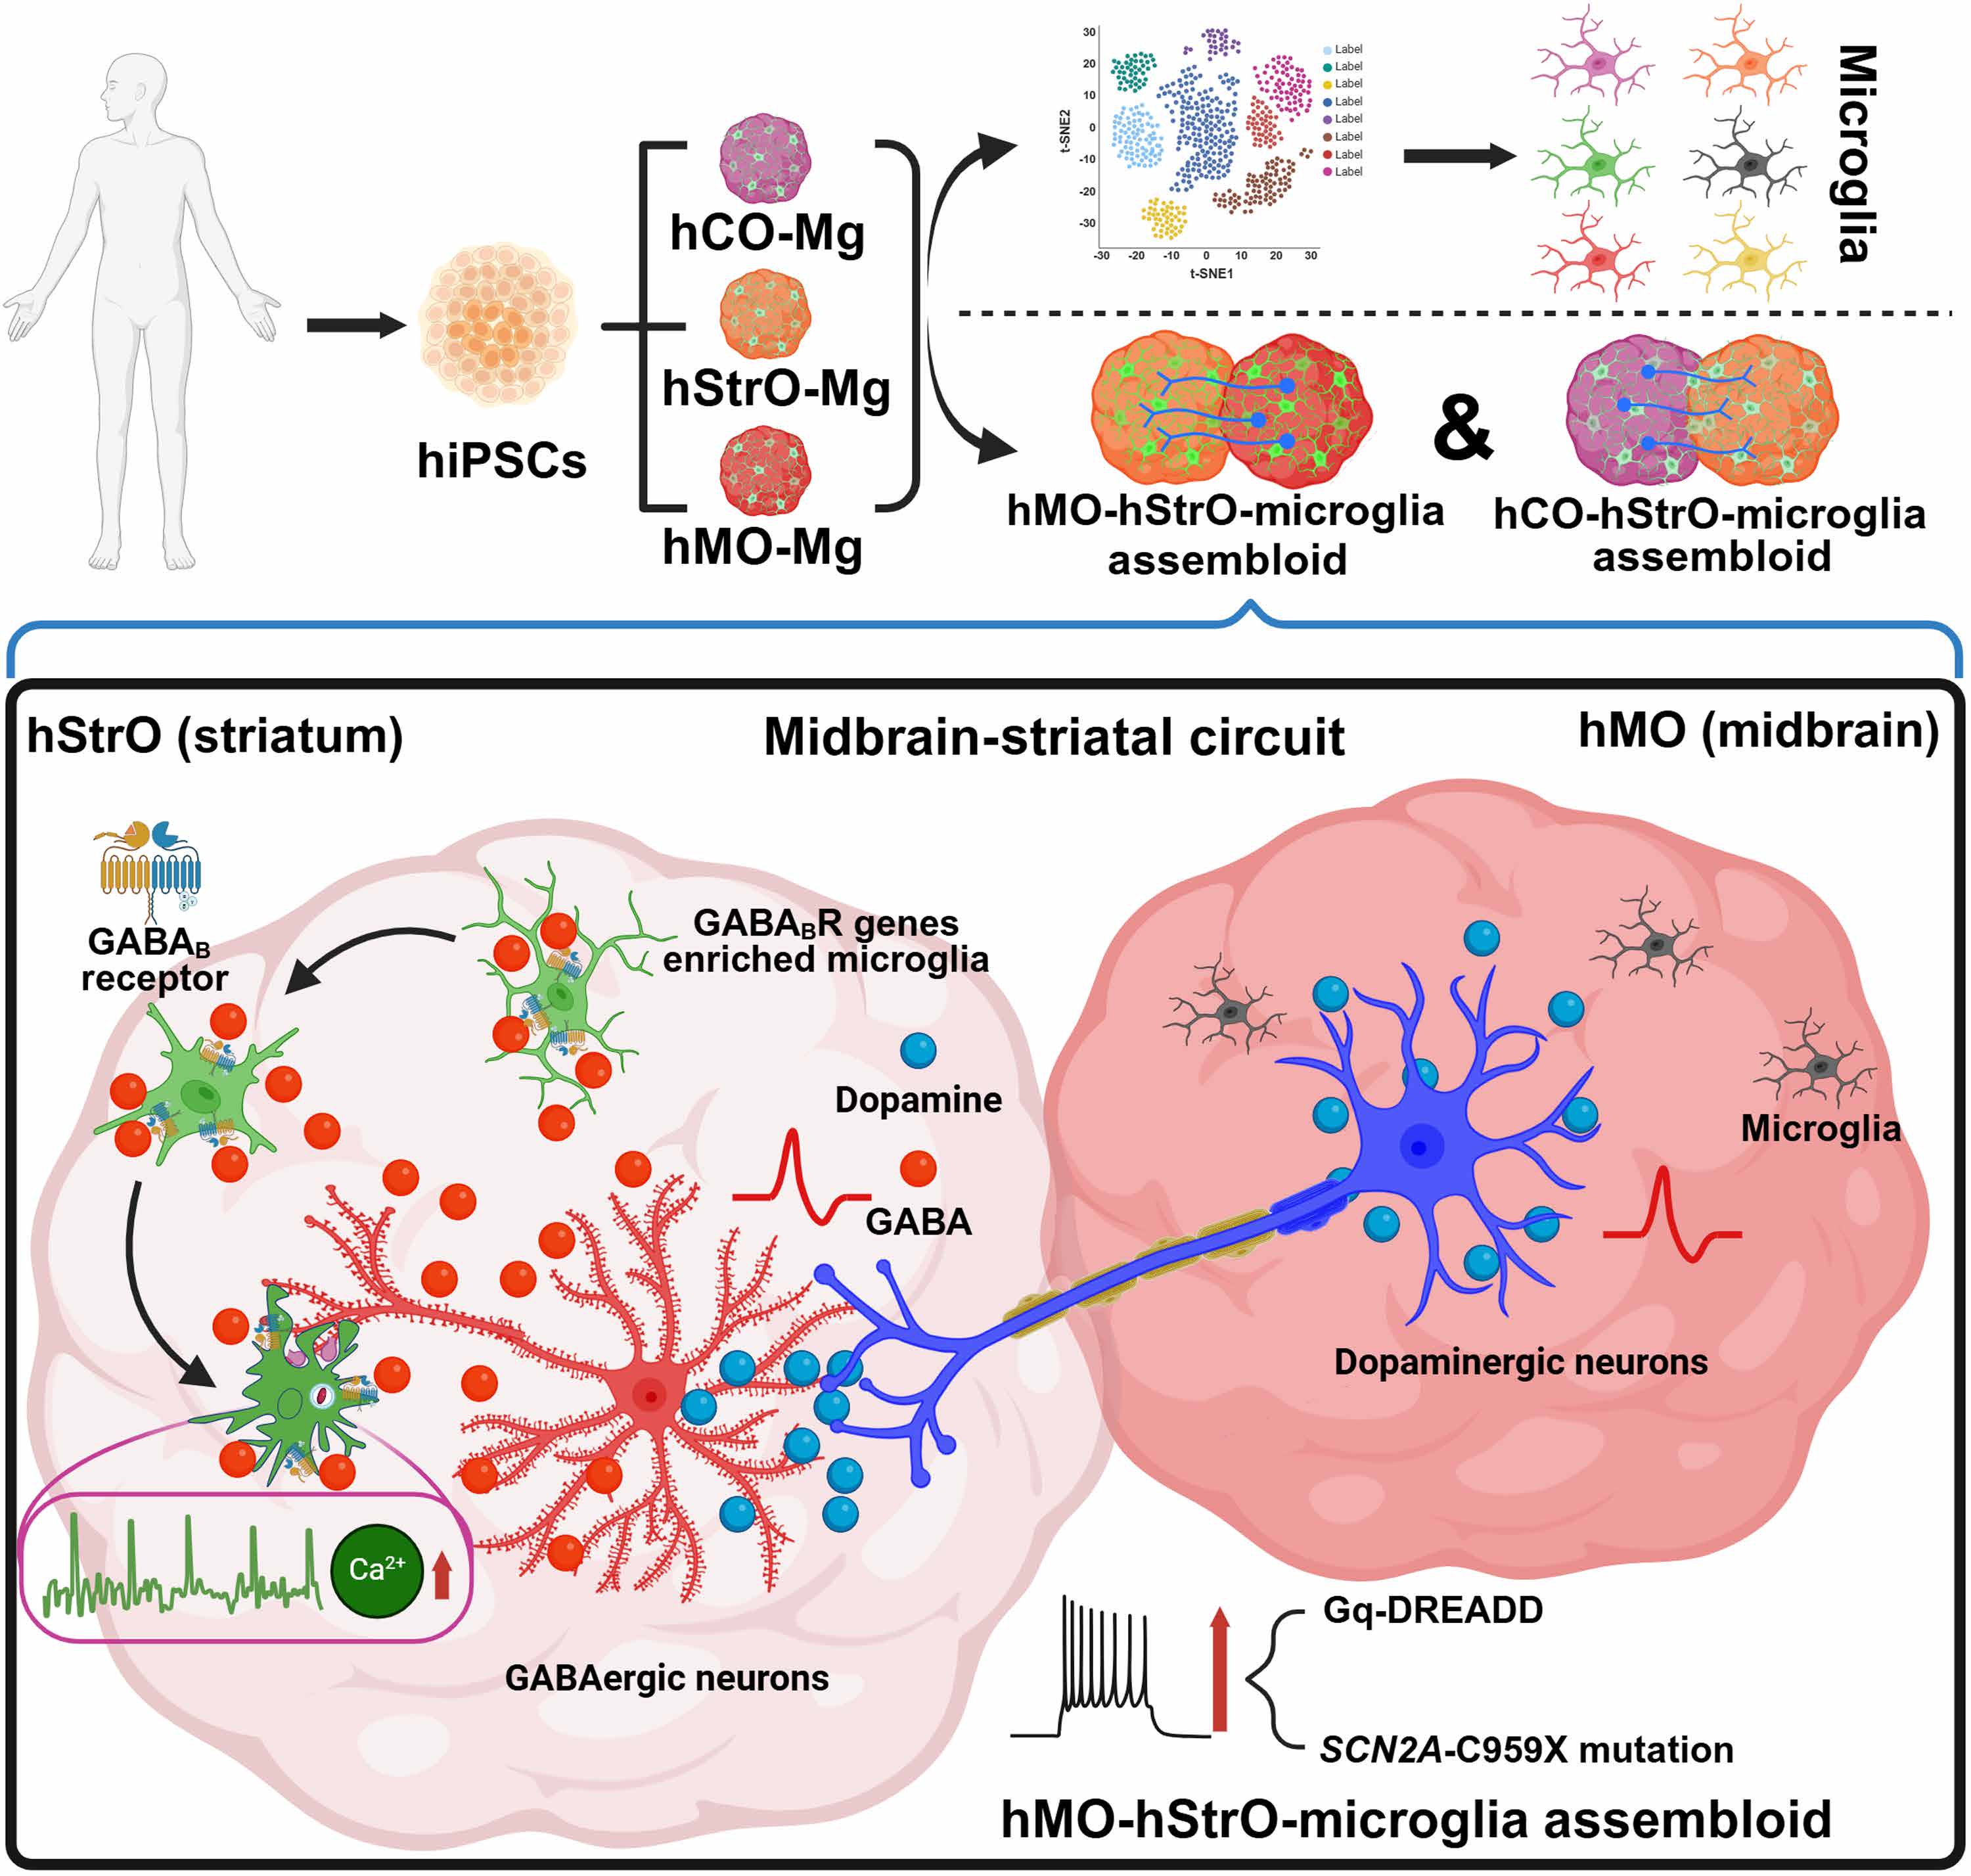
Figure 5. Summary model. Schematic illustrating the key findings: region-specific microglial heterogeneity, GABAB receptor-enriched striatal microglia, microglial response to neuronal hyperactivity via GABAB receptors, and excessive synaptic pruning in SCN2A-C959X ASD model that can be rescued by GABAB receptor inhibition or GABBR1 knockout.
Microglia are known to prune synapses as a way to regulate neuronal network excitability (29). In particular, previous studies have found that microglia can dampen neuronal hyperexcitability in chemically triggered seizure mouse models and human cells carrying seizure-related genetic mutations (22, 30, 42). It is also found that microglial calcium dynamics are highly related to microglial phagocytosis, as well as neuronal excitability monitoring and modulation (21, 23). While these results are exciting, they are limited by the existing technologies, which only allow the live-cell imaging of microglia either in 2D culture/brain slices that do not have intact long-range circuitry connectivity, or superficial cortical regions, limited by the imaging depth of in vivo two-photon microscopy (21, 43). Our current platform, therefore, provides a complementary approach to studying human microglia in subcortical circuits. Notably, our finding in the midbrain-striatal circuit is consistent with the published results that microglia display elevated calcium signaling in a hyperexcitable environment and perform overpruning of synapses in disease models of autism/epilepsy (16, 22). It is suggested that GABA-linked microglial calcium activity is developmentally regulated and most prominent in early life (31); because organoids and assembloids capture early-developmental circuit properties, the prevalence and magnitude of the GABA-dependent signals observed here likely reflect this developmental window and may shift depending on developmental state. Because GABAergic signaling undergoes a developmental shift from depolarizing to hyperpolarizing, commonly referred to as the “GABA polarity switch,” it is important to determine whether GABA acts as an excitatory or inhibitory neurotransmitter in our organoid/assembloid system. To clarify this, we looked at an age-condition-matched dataset (19): When we added GABA to human striatal organoids, the neurons’ spontaneous Ca2+ activity went down and then returned to baseline after washout; boosting GABAA receptors with clonazepam lowered the Ca2+ activity even further. Together, these observations suggest that GABA mediates inhibitory signals under conditions directly comparable to this study, so we treat the GABA signal as inhibitory in our organoid/assembloid assays. Moving beyond confirming published results, our study was able to reveal a population of GABAB-enriched microglia in hStrO. We further demonstrated that the elevated calcium signal and synaptic overpruning are microglial GABAB receptor–dependent, providing insights into the region-specific function of human microglia in regulating neuronal excitability that is not likely to be revealed by existing models.
This study may have several limitations: (i) Our assembloid system lacks a vascular component. The brain vasculature is known to maintain homeostasis and influence microglial development and functions (44, 45). We acknowledge this as a limitation. Within this defined scope, we focus on an activity-dependent axis linking neuronal excitability to microglial response. We show that microglia sense moment-to-moment, activity-dependent neurotransmitter fluctuations, respond to neuronal network dynamics, and exert measurable effects independent of endothelial input. This framing is supported by independent human datasets showing that neuron-to-microglia pathways (e.g., TGF-β/BMP → SMAD) can drive microglial state transitions in the absence of vascular cues. It is also supported by evidence of robust functional coupling in vessel-free organoids, such as APOE/ABCA1-dependent cholesterol transfer, which provides causal readouts of neuron-microglia interactions (46, 47). Together, these observations support the feasibility and biological value of interrogating the “neuronal excitability → microglial response” axis in a vessel-free model. Future studies incorporating a vascular component may further elucidate how vascular cues contribute to microglial sensing of neuronal activity. (ii) While our system can model the classic midbrain to striatum long-range axonal projections, striatal neurons also send long-range projections to multiple other brain regions (48–50), which our current system does not model. (iii) Our present work focuses on early developmental stages of organoid/assembloid. We therefore cannot yet determine how the regional microglial signatures we describe, including the GABAB receptor–enriched striatal subtype and its Ca2+ dynamics, persist, diminish, or transition at later stages. Future studies using longitudinally aged assembloids, integrating repeated live-cell Ca2+ imaging with complementary emerging approaches, may enable quantification of how these signatures change over time.
In summary, our study established an advanced platform with substantial potential for investigating microglial functions in neural circuits and their dysfunction in human diseases. This platform technology could also be potentially deployed to discover and evaluate previously unknown therapies designed to address a wide range of brain disorders toward precision medicine (51, 52). It is especially exciting that microglial spatial heterogeneity in the human brain can be partially modeled in vitro with human cell–based brain organoids and assembloids. Our platform enables a comprehensive exploration of potentially diverse microglial roles across different brain regions, including subcortical areas that have historically been challenging to access by in vivo imaging technology. Moreover, our model allows live-cell imaging and precise experimental manipulations of microglia in a human cell–based system, advancing our understanding of microglial biology and its contribution to human brain disorders.
¶ MATERIALS AND METHODS
¶ Generation of organoids (hCO, hStrO, and hMO) from hiPS cells
All hiPSC procedures were conducted under approval from the Purdue University Institutional Biosafety Committee (IBC ref. ID no. 18-002-21; IBC Form 1A). SCN2A c.2877C>A (p.Cys959Ter) mutant hiPSC lines were generated using CRISPR-Cas9–mediated genome editing (49, 50) in early passage (p2) KOLF2.1J reference hiPSCs (51). We conducted recharacterization of pluripotency assays and genome integrity to ensure the quality of hiPSC (52). In total, seven hiPSC lines were used: three isogenic control lines (KOLF2.1J, B07 WT, and B11 WT), three heterozygous SCN2A-C959X lines (A02 HET, E04 HET, and F01 HET), and one homozygous GABBR1 knockout line (KOLF2.1J with GCaMP6f). GABBR1 knockout lines were created by engineering the K303X mutation into the GABBR1 gene in KOLF2.1J hiPSCs using a prime editor. The K303 site was targeted because it lies in the earliest exon present in all known transcripts, and the K303 position is mid-exon, making aberrant splicing unlikely; it also provides a favorable context for prime editing. Homozygous knockout cell lines were acquired by single-cell selection of the edited pool of cells. Knockout was confirmed by Sanger sequencing (forward primer: GCTGACCTCCTTCTTCAGAA; and reverse primer: AGAACTGAGTCATTCTGGGT). The hiPSC colonies were maintained daily in StemFlex Medium (Gibco, A3349401) and then aggregated in Essential 8 medium (Gibco, A1517001) at a density of 100 cells/μl to form spheroidal embryoid bodies (EBs). Formation of the EBs was facilitated overnight in round-bottom ultralow-attachment plates (Corning Costar, CLS7007) with a 3-min centrifugation at 100g. The EBs were subsequently cultured in Essential 6 medium (Gibco, A1516401) for the first 6 days.
To generate hCO, following the method described, EBs were initially maintained in E6 medium for 6 days with the addition of inhibitors targeting the activin/nodal/transforming growth factor–β (TGF-β) and BMP pathways: dorsomorphin (2.5 μM, Sigma-Aldrich, P5499) and SB-431542 (10 μM, R&D Systems, 1614), as well as XAV-939 (1.25 μM, Tocris, 3748) to induce neuronal differentiation via the DUAL-SMAD approach. The EBs were then collected and transferred to flat-bottom six-well suspension culture plates (Corning, 3471) and maintained in Neurobasal-A medium (Thermo Fisher Scientific, 10888022), supplemented with GlutaMax (Gibco, 35050061), Penstrep (10,000 U/ml; Gibco, 15140163), and B27 minus vitamin A (Gibco, 12587010), along with human recombinant FGF2 (20 μg/ml; R&D Systems, 233-FB-500) and epidermal growth factor (20 μg/ml; R&D Systems, 236-EG). The medium was completely refreshed daily for the first 17 days, then every 2 days until day 23. Subsequently, the supplements were replaced with a formulation containing brain-derived neurotrophic factor (BDNF; 20 ng/ml; PeproTech, 450-02), NT3 (20 ng/ml; PeproTech, 450-03), 50 μM cAMP (Santa Cruz Biotechnology, sc-201567A), 10 μM DHA (cis-4,7,10,13,16,19-docosahexaenoic acid) (Millipore Sigma, D2534), and 200 μM AA (L-ascorbic acid 2-phosphate trisodium salt) (Wako, 323-44822), with medium changes every 2 days until day 46. Afterward, the organoids were maintained in Neurobasal-A basal medium with B27+ supplement (without additional growth factors) until day 150, with media changes every 4 to 5 days.
For the generation of hStrO, the protocol previously outlined was followed (53). On day 6, the EBs were transferred into a neural medium composed of Neurobasal-A, B-27 without vitamin A, GlutaMAX, and penicillin-streptomycin. This medium was also supplemented with 2.5 μM IWP-2 (a WNT pathway inhibitor; Selleck Chemicals, S7085) and recombinant Activin A (50 ng/ml; PeproTech, 120-14P). On day 11, the retinoid X receptor agonist SR11237 (100 nM, Tocris, 3411) was added alongside the existing supplements. Starting from day 22, to promote differentiation of neural progenitors into neurons, the medium was further enriched with BDNF (20 ng/ml), NT-3 (20 ng/ml), 200 μM AA, 50 μM cAMP, and 10 μM DHA. From day 42 onward, N-[(3,5-Difluorophenyl)acetyl]-L-alanyl-2-phenylglycine-1,1-dimethylethyl ester (DAPT, 2.5 μM, STEMCELL TECHNOLOGIES, 72082) was added in conjunction with BDNF, NT-3, AA, cAMP, and DHA. From day 46, the cultures were maintained solely in a neural medium containing B-27 Plus Supplement with medium changes every 4 days.
To generate hMO (54), EBs were cultured in brain organoid generation medium (BGM) containing a 1:1 mix of Dulbecco’s Modified Eagle’s medium (DMEM)/F12 (Thermo Fisher Scientific, 21331020) and Neurobasal-A medium, 1% penicillin/streptomycin, 1% GlutaMAX, 1% MEM nonessential amino acids solution (Thermo Fisher Scientific, 11140050), 55 μM β-mercaptoethanol (Thermo Fisher Scientific, 21985023), and heparin (1 μg/ml; Sigma-Aldrich, H3149). The medium was supplemented with 1% N-2 Supplement (Thermo Fisher Scientific, 17502048) and 2% B27 without vitamin A supplement, 2 μM dorsomorphin, A83-01 (2 μM, PeproTech, 9094360), CHIR99021 (3 μM, Tocris, 4423), and IWP2 (1 μM, Selleck Chemicals, S7085) for 7 days. On day 4, FGF8b (100 ng/ml; PeproTech, AF-100-25) and smoothened agonist (2 μM, PeproTech, 9128694) were added, and on day 7, laminin (200 ng/ml; Sigma-Aldrich, L4544) and insulin (2.5 μg/ml; Sigma-Aldrich, I9278) were introduced, with these supplements maintained until day 9. After this period, the medium was switched to BGM containing 1% N-2, 2% B27 plus, BDNF (10 ng/ml), glial cell line–derived neurotrophic factor (10 ng/ml; PeproTech, 450–10), 125 μM cAMP, and 200 μM AA. The cultures were maintained under these conditions for up to 6 months.
¶ Human microglia differentiation
Microglia differentiation was performed based on a previously established protocol (55). In summary, hiPSCs (KOLF2.1J endogenously expressing GCaMP6f, B11 WT, B07 WT, and KOLF2.1J GABBR1 KO endogenously expressing GCaMP6f) were first differentiated into hematopoietic progenitor cells over 12 days using the STEMdiff Hematopoietic Kit (STEMCELL TECHNOLOGIES, 05310). hiPSCs were grown in a six-well plate coated with Matrigel (Corning 354277) and maintained in mTeSR Plus medium (STEMCELL TECHNOLOGIES, 100-0276). The cells were passaged by washing with 1× phosphate-buffered saline (PBS) followed by the addition of 1 ml of ReLeSR (STEMCELL TECHNOLOGIES, 100-0483) and incubated at 37°C for 90 seconds. ReLeSR was then removed and 1 ml of mTeSR Plus was pipetted over the cells. Thirty to 50 colonies were plated on one well of a Matrigel-coated six-well plate using a wide-bore pipette tip. One day after cell seeding, hematopoietic progenitor medium A was added to the cells. After 2 days, a half medium change was done. On day 3, medium A was removed, and hematopoietic progenitor medium B was added. A half-medium change was done on days 5, 7, and 10. On day 12, the progenitor cells were harvested from the well by pipetting several times before transfer to one well of a Matrigel-coated six-well plate. The resulting progenitor cells were then transferred into 2 ml of microglia differentiation medium composed of DMEM/F12 (Gibco, 11320033), 2× insulin-transferrin-selenite (Gibco, 41400045), 2× B27 plus (Gibco, A3582801), 0.5× N2 (Gibco, 17502048), 1× nonessential amino acids (Gibco, 11140050), 400 μM monothioglycerol (Sigma-Aldrich, M6145-25MG), human insulin (5 μg/ml; Sigma-Aldrich I2643-25MG). Before use, the differentiation medium was supplemented with interleukin-34 (100 ng/ml; Gibco, 200-34-10UG), TGF-β1 (50 ng/ml; 100-21-10UG), and macrophage colony-stimulating factor (25 ng/ml; Gibco, 300-25-10UG). The cells were maintained in this medium for up to 24 days with the addition of 1 ml of media every 2 days.
¶ Western blot
Human microglia were homogenized in ice-cold RIPA buffer (Thermo Fisher Scientific, 89901) with protease and phosphatase inhibitors (Thermo Fisher Scientific, A32953) and centrifuged at 10,000g for 20 min at 4°C. Protein concentrations were determined using the Pierce BCA Protein Assay Kit (Thermo Fisher Scientific, 23225). Proteins were denatured in 1× Laemmli buffer [62.5 mM tris-HCl (pH 6.8), 2% SDS, 5% glycerol, and 0.05% bromophenol blue] by boiling at 95°C for 5 min. Then 50 μg of per sample was loaded on 8% SDS–polyacrylamide gel electrophoresis gels at 80 to 120 V and transferred onto polyvinylidene difluoride membranes (Thermo Fisher Scientific, PB9220) at 300 mA for 2.5 hours at 4°C. Membranes were blocked with 5% nonfat milk in TBST (tris-buffered saline with 0.1% Tween 20) for 1 hour at room temperature and incubated overnight at 4°C with primary antibodies (GABBR1 antibody, Thermo Fisher Scientific, MA5-52868) diluted in Intercept T20 (TBS) antibody diluent (LI-COR Biosciences, 927-65001). The next day, blots were washed (3×, 10 min) in TBST, incubated with secondary antibodies for 1 hour at room temperature, and washed again (3×, 10 min). Immunoreactive bands were visualized using the Odyssey CLx Imaging System (LI-COR Biosciences) and analyzed with Fiji. Protein levels were normalized to β-actin and further compared.
¶ Microglia integration in the cortical, striatum, and midbrain organoids
To facilitate the incorporation of microglia into the organoids (hCO, hStrO, and hMO), organoids that had cultured for over 80 days were individually transferred to an ultralow-attachment 96-well plate. On day 12 of microglial differentiation, microglia were collected and seeded at a density of 400,000 cells per well onto the surface of the organoids in fresh medium composed of an equal mixture of microglial differentiation medium and mature cortical/striatal/midbrain organoid medium. The organoids were incubated for 7 days to allow spontaneous microglial integration, with daily medium replacement. Afterward, the organoids were moved back to an ultralow-attachment six-well plate and maintained for an additional 7 days following the standard cortical/striatal/midbrain organoid culture protocol.
¶ Generation of microglial integrated assembloids
To produce either hMO-hStrO-Mg or hCO-hStrO-Mg assembloids, we first generated hMO-Mg (or hCO-Mg) and hStrO-Mg separately from hiPSCs. Next, these microglia-containing organoids were combined by placing them in close proximity within 1.5-ml Eppendorf tubes and incubating them for 7 days. During this incubation period, half of the medium was gently replaced each day. On the seventh day, the assembloids were transferred using a trimmed P1000 pipette tip into 24-well ultralow-attachment plates, and the medium was subsequently refreshed every 2 days.
¶ Viral labeling and live cell imaging
Before assembling the two distinct microglia-integrated organoids, 3D neural organoids were virally transduced to both visualize projections and trigger neuronal hyperexcitability using pAAV1-hSyn-mScarlet (Addgene, 131001) and pAAV9-hSyn-hM3(Gq)-mCherry (Addgene, 50474), respectively. For the hMO-hStrO-Mg assembloid experiments, hMO-Mg were first transferred to a 24-well plate containing 200 μl of medium and incubated overnight with the virus in an incubator. The following day, 800 μl of fresh culture medium was added. Three days postinfection, the virus-labeled hMO-Mg and hStrO-Mg were used for assembloid formation. Live-cell imaging was performed on the midbrain-striatal projection area at assembly days 10, 20, and 30 using a confocal fluorescence microscope equipped with an incubation system (LSM900; Carl Zeiss, Jena, Germany). Image data were subsequently analyzed with Fiji (ImageJ).
¶ Chemogenetics stimulation, pharmacological validation of dopaminergic transmission, and calcium imaging
For chemogenetics experiments, hMO-hStrO-Mg assembloids, with hMO previously transduced with pAAV-hSyn-hM3(Gq)-mCherry, were placed on a 20-mm coverslip (within a 35-mm glass-bottom plate) in neural medium and imaged using a 10× objective on the LSM900 Zeiss confocal microscope. To induce neuronal hyperexcitability specifically in the hMO region, 10 μM CNO (targeting the Gq-DREADD) (Abcam, ab120019) was applied. SCH-23390 hydrochloride (10 μM; a selective D1 antagonist) (Tocris Bioscience, 0925) and 10 μM (S)-(−)-sulpiride (a selective D2 antagonist) (Tocris Bioscience, 0895) was used for validating the specificity and maturity of the reconstructed midbrain-striatal circuit. In brief, during 10-min HD-MEA recordings of hMO-hStrO-Mg assembloids, we recorded a 2-min baseline, then bath-applied SCH-23390 together with (S)-(−)-sulpiride. Recordings continued for 8 min after drug application. Calcium activity, monitored via GCaMP6f, was recorded for a total duration of 5 min 30 s; baseline activity was captured for the initial 100 s, after which CNO was added, and recording continued for an additional 230 s. To inhibit microglial GABAB receptor signaling, assembloids were preexposed to 2 μM CGP 55845 hydrochloride (a selective GABAB receptor antagonist) (MCE, HY-103516), with the medium refreshed every 6 hours for a total of 72 to 96 hours (3 to 4 days) before calcium imaging and VGAT puncta internalization assays.
¶ Calcium activity analysis
Calcium imaging data were recorded from regions of interest (ROIs) in assembloids samples and exported as Excel files. To define ROIs for microglial somas and processes, the user manually delineated these areas on an average intensity projection covering the full field of view using Inscopix. Next, the somatic ROIs were masked in the average intensity image to separate them from the microglial processes. By applying a threshold to the remaining image data, process ROIs were isolated, and their mean pixel intensities were quantified in a similar manner. Each column in the dataset represents the fluorescence intensity of a single soma or process over time. For quantifying calcium transients, fluorescence intensity values were converted into ΔF/F values as: ΔF/F = (F(t) − F0)/F0. For each soma and process, a 100-s moving window was applied to create a dynamic baseline. The baseline fluorescence (F0) is established by the 25th percentile of the intensity values within the moving window. Calcium transients were identified using a threshold-based method, and frames exceeding a threshold that is three times greater than the SD of the baseline were classified as active transients. Maximum amplitude was computed by the peak ΔF/F value during detected transients. Signal area is the cumulative ΔF/F value above the threshold across all detected transients.
¶ scRNA-seq library preparation and data analysis
To characterize microglial properties across three organoid brain regions (WT hStrO + Mg, WT hCO + Mg, and WT hMO + Mg). Organoids were dissociated into single-cell suspensions following standard protocols with modifications optimized for the PIPseq-T20 workflow. In brief, four to five randomly selected organoids were used, and for each condition, a single pooled sample was created by mixing four to five organoids derived from three independent hiPSC lines: KOLF2.1J, B07 WT, and B11 WT. These pooled samples were incubated in an enzymatic dissociation solution containing papain (30 U/ml; Worthington Biochemical, LS003126) and 0.4% deoxyribonuclease I (Worthington Biochemical, LS2007) at 37°C for 45 min. Following enzymatic digestion, organoids were washed in protease inhibitor-containing medium and gently triturated to achieve a single-cell suspension. The cell suspension was filtered through a 70-μm Flowmi cell strainer (Bel-Art, H13680-0070) and counted. Viable cells were resuspended in cell suspension buffer (Fluent BioSciences, PIPseq T20 v3.0) at a final concentration of 10,000 cells/μl, ensuring optimal loading efficiency. scRNA-seq libraries were generated using the PIPseq-T20 3′ Single Cell RNA Kit v3.0 (Fluent BioSciences) following the manufacturer’s protocol. In brief, 40,000 cells per reaction were loaded into PIPseq pretemplated instant partitions (PIPs) and mixed with partitioning reagents to encapsulate individual cells with barcoded beads. Cell lysis and mRNA capture were performed within the PIPs, followed by cDNA synthesis using a template-switch oligonucleotide approach. cDNA was then amplified using whole-transcriptome amplification and purified via SPRI bead cleanup. Purified cDNA was fragmented, end-repaired, and A-tailed before adapter ligation using the PIPseq-T20 Library Preparation Kit. Libraries were indexed using dual-index P7/P5 adapters, amplified via polymerase chain reaction, and size-selected using double-sided SPRI bead purification. The final libraries were quantified using a Qubit High Sensitivity DNA Assay Kit (Thermo Fisher Scientific, Q33231) and analyzed on a Bioanalyzer 2100 or TapeStation 4200 (Agilent). Sequencing was performed on an Illumina NovaSeq S4 platform with 2 × 150 base pair (bp) paired-end reads, targeting ~20,000 reads per cell.
The resulting feature-barcode matrices were read into R (version 4.2.2), excluding any cell expressing fewer than 200 genes and any gene expressed in fewer than three cells. For all single-cell samples, cells with greater than 15% mitochondrial, fewer than 2500 features, or more than 10,000 features were removed by Seurat (version 4.3.0.1). We excluded cells with <2000 or >50,000 unique molecular identifier counts for quality control. The resulting Seurat objects were merged with Seurat’s (version 4.0.3) merge function and subsequently scaled using ScaleData, with nCount_RNA and percent.mt included as regressors to account for library size and mitochondrial transcript proportion (56). Then, total cell clustering was performed by the “FindNeighbors” and “FindClusters” functions using the first 50 PCs and a resolution of 0.2, and for visualization with UMAP. Clusters were grouped on the basis of the expression of known marker genes. The classification of microglia was performed on the basis of the combinatorial expression of known markers as previously described (38).
¶ HD-MEAs recording
Multiwell HyperCam Alpha (3Brain AG, Switzerland) HD-MEAs were used for all HD-MEA recordings. The six-well plates were cleaned using 200 μl of 1% Tergazyme solution for 1 hour at 37°C, washed three times with excess Sterile MilliQ water (R > 18.2), then disinfected with 70% ethanol for 1 hour. Ethanol was removed and plates were dried under ultraviolet, then the plates were incubated overnight in PBS at room temperature. Next, HD-MEAs were coated sequentially with poly-L-ornithine (50 μg/ml) in sterile MilliQ overnight, washed three times with MilliQ water, and then incubated with laminin (50 μg/ml) for 4 hours at 37°C. Days 100 to 150 assembloids were then seeded onto the 3Brain MEAs in 20 μl of media and returned to the incubator for 2 hours. An additional drop of 20-μl media was added using wide-bore pipette tips every 2 hours for 8 hours. Last, 2 ml of media was gently added in concentric circles to fill the well. Media was exchanged every 3 to 4 days. Assembloids were recorded between days 10 and 15. Data were acquired and analyzed using Brainwave V software, (version 5.6, 3Brain Switzerland). HD-MEA arrays were recorded using a 2304 × 2304 electrode configuration, with a 60-μm pitch (2.9 by 2.9 mm2 area). The sampling rate was set to 10,000 Hz, and a hardware high-pass filter of 100 Hz was used. Direct light stimulation compensation was applied during the recording. For spike detection, a band-pass filter of 20 to 5000 Hz using fast Fourier transform was performed. Spike detection was set to a SD of 8.0 with a peak lifetime of 2.0 ms, and a refractory period of 1.0 ms. Prepeak wave duration was 1.0 ms. Electrodes with less than 0.083 Hz (five spikes per minute) were discarded. For spike burst detection, simple interspike interval (ISI) settings were used with a max ISI of 100 ms and the minimum number of spikes set to 5. Spike sorting using three-component principal components analysis with K-means and gap statistics clustering was applied. For spike network bursts, a recruitment-based algorithm was applied with 10% recruited electrodes and a minimum spike threshold of 50 spikes. A spike cross-correlation window of 30 ms and bin size of 3.0 ms were used to generate correlation matrices.
¶ Cryosection and immunofluorescence
Organoids and assembloids were initially fixed in a solution of 4% paraformaldehyde in PBS for 4 hours. After fixation, the samples were transferred into a 30% sucrose/PBS solution and left for 1 day until they sank to the bottom. Once dehydration was complete, the samples were embedded in an 1:1 OCT and 30% sucrose in PBS mixture and stored at −80°C for subsequent experiments. For immunofluorescence staining, 30 μm-thick sections were prepared using a Leica Cryostat (Leica, CM1860). The cryosections were first rinsed with PBS to remove any residual OCT and then blocked for 1 hour at room temperature in a solution containing 10% normal donkey serum (Millipore Sigma, S30-100ML), 0.3% Triton X-100 (Millipore Sigma, T9284-100ML), and 1% bovine serum albumin diluted in PBS. Next, the sections were incubated overnight at 4°C with the appropriate primary antibody solution. On the following day, the sections were washed with 0.01 M PBS and then incubated with secondary antibodies for 2 hours at room temperature. After a final wash, coverslips were mounted onto the sections. The primary antibodies used were as follows: anti-IBA1 (Abcam, ab178846), human anti-IBA1 (Synaptic Systems, 234308), human anti-CD68 (Invitrogen, MA5-13324), human anti-Gabbr1 (Gene Tex, GTX102511), human anti-DRD1 (Thermo Fisher Scientific, 702593), anti-Ctip2 (Abcam, ab18465), anti-TBR1 (Thermo Fisher Scientific, 66564), anti-GABA (Thermo Fisher Scientific, PA5-32241), anti-TH (Thermo Fisher Scientific, MA1-24654), anti-MAP2 (Thermo Fisher Scientific, PA1-10005), anti-NeuN (Thermo Fisher Scientific, 702022), anti-GAD67 (Thermo Fisher Scientific, PA5-21397), anti-FOXA2 (Thermo Fisher Scientific, 701698), and anti-OTX2 (Thermo Fisher Scientific, MA5-15854), anti-VGAT (Synaptic System, 131002), and anti-Gephyrin (Synaptic System, 147111). Confocal images were acquired using a Z-stack laser scanning confocal fluorescence microscope (LSM900; Carl Zeiss, Jena, Germany). Three-dimensional image analysis was conducted with Imaris 9.9 software. The reconstructed surfaces of IBA1 and CD68 were measured, and the percentage of CD68 occupancy within microglia was determined using the formula: (volume of CD68) / (volume of IBA1+ cell). In addition, to quantify the VGAT+ signal within CD68+ regions, the following calculation was used: (VGAT+ volume / CD68+ volume) × 100.
¶ Electrophysiology
Patch-clamp recordings were performed as described previously (32). In brief, organoids were cut with a vibratome (Leica VT1200S, Germany) in ice-cold slicing solution containing the following: 110 mM choline chloride, 2.5 mM KCl, 1.25 mM NaH2PO4, 25 mM NaHCO3, 0.5 mM CaCl2, 7 mM MgCl2, 25 mM glucose, 1 mM sodium ascorbate, and 3.1 mM sodium pyruvate (pH 7.4, 305 to 315 mOsm, bubbled with 95% O2 and 5% CO2). Slices were incubated in the same medium for 10 min at 33°C, then transferred to artificial cerebrospinal fluid (125 mM NaCl, 2.5 mM KCl, 1.25 mM NaH2PO4, 25 mM NaHCO3, 2.0 mM CaCl2, 2.0 mM MgCl2, 10 mM glucose; pH 7.4, 305 to 315 mOsm, bubbled with 95% O2 and 5% CO2) for 10 to 20 min at 33°C before storage at room temperature for at least 30 min. Slices were visualized under IR-DIC using a BX-51WI microscope (Olympus) with an IR-2000 camera (Dage-MTI). We used thin-wall borosilicate pipettes (BF150-110-10) with 3 to 5 MΩ open-tip resistances. For current-clamp recordings, the internal solution contained the following: 122 mM KMeSO4, 4 mM KCl, 2 mM MgCl2, 0.2 mM EGTA, 10 mM HEPES, 4 mM Na2ATP, 0.3 mM tris-GTP, and 14 mM tris-phosphocreatine, adjusted to pH 7.25 with KOH, 295 to 305 mOsm. Recordings were performed with an Axon MultiClamp 700B amplifier (Molecular Devices), and data were acquired using pClamp 11.3 software filtered at 2 kHz and sampling rate at 50 kHz with an Axon Digidata 1550B plus HumSilencer digitizer (Molecular Devices). The action potentials were obtained in response to a series of 400-ms hyperpolarizing and depolarizing current steps from −200 pA to +400 pA in increments of 50-pA, each sweep duration of 5 s with cells held at the normal RMP.
¶ Statistical analysis
OriginPro 2025 and GraphPad Prism 10 were used for data analysis and curve fitting. Two-tailed Student’s t test (parametric) or unpaired two-tailed Mann-Whitney U test (nonparametric) was used for single comparisons between two groups. The other data were analyzed using one-way or two-way analysis of variance (ANOVA) and then using a post hoc test with Bonferroni corrections. The number of experimental samples (n) in each group was indicated in the legend. Results are presented as mean ± SEM. Significance was determined when P < 0.05 (), P < 0.01 (), P < 0.001 (), and P < 0.0001 (****).
¶ Use of AI-assisted tools
Generative artificial intelligence was used only as a language-editing aid in the preparation of this manuscript. Specifically, ChatGPT (OpenAI; model GPT-5.0) was used to improve the grammar, clarity, and readability of the English text without introducing or modifying any scientific conclusions. The following representative prompt was used in the production of the work: “Please edit the following scientific text to improve grammar, clarity, and readability while preserving its original meaning and not introducing new scientific claims or interpretations: [insert text].” No data analysis, figure generation, or experimental design was performed by the AI tool. All AI-assisted suggestions were critically reviewed, revised, and approved by the authors, who take full responsibility for the accuracy, originality, and integrity of the manuscript.
¶ Supplementary Materials
This paper includes supplementary materials containing additional data, figures, and methodological details.
Supplementary Figures:
- Fig. S1. Characterization of region-specific brain organoids and microglial integration.
- Fig. S2. Microglial marker expression and GABA receptor gene expression patterns.
- Fig. S3. Neuronal excitability analysis upon CGP 55845 treatment.
- Fig. S4. Network activity comparison between WT and SCN2A-C959X assembloids.
- Fig. S5. Pharmacological validation of dopaminergic transmission in hMO-hStrO-Mg assembloids.
- Fig. S6. Time-aligned mean firing rate traces showing coordinated activity.
- Fig. S7. Pre/post synaptic colocalization analysis (VGAT-Gephyrin).
- Fig. S8. Characterization of GABBR1-knockout hiPSC lines.
Supplementary Methods: Additional experimental protocols and data analysis details.
¶ REFERENCES
- F. Ginhoux, M. Guilliams, Tissue-resident macrophage ontogeny and homeostasis. Immunity 44, 439–449 (2016).
- F. Ginhoux, S. Lim, G. Hoeffel, D. Low, T. Huber, Origin and differentiation of microglia. Front. Cell. Neurosci. 7, 45 (2013).
- M. Andoh, K. Shibata, K. Okamoto, J. Onodera, K. Morishita, Y. Miura, Y. Ikegaya, R. Koyama, Exercise reverses behavioral and synaptic abnormalities after maternal inflammation. Cell Rep. 27, 2817–2825.e5 (2019).
- F. Filipello, R. Morini, I. Corradini, V. Zerbi, A. Canzi, B. Michalski, M. Erreni, M. Markicevic, C. Starvaggi-Cucuzza, K. Otero, L. Piccio, F. Cignarella, F. Perrucci, M. Tamborini, M. Genua, L. Rajendran, E. Menna, S. Vetrano, M. Fahnestock, R. C. Paolicelli, M. Matteoli, The microglial innate immune receptor TREM2 is required for synapse elimination and normal brain connectivity. Immunity 48, 979–991.e8 (2018).
- H.-J. Kim, M.-H. Cho, W. H. Shim, J. K. Kim, E.-Y. Jeon, D.-H. Kim, S.-Y. Yoon, Deficient autophagy in microglia impairs synaptic pruning and causes social behavioral defects. Mol. Psychiatry. 22, 1576–1584 (2017).
- Y. Zhan, R. C. Paolicelli, F. Sforazzini, L. Weinhard, G. Bolasco, F. Pagani, A. L. Vyssotski, A. Bifone, A. Gozzi, D. Ragozzino, C. T. Gross, Deficient neuron-microglia signaling results in impaired functional brain connectivity and social behavior. Nat. Neurosci. 17, 400–406 (2014).
- M. Jin, R. Xu, L. Wang, M. M. Alam, Z. Ma, S. Zhu, A. C. Martini, A. Jadali, M. Bernabucci, P. Xie, K. Y. Kwan, Z. P. Pang, E. Head, Y. Liu, R. P. Hart, P. Jiang, Type-I-interferon signaling drives microglial dysfunction and senescence in human iPSC models of Down syndrome and Alzheimer’s disease. Cell Stem Cell 29, 1135–1153.e8 (2022).
- A. S. Warden, S. A. Wolfe, S. Khom, F. P. Varodayan, R. R. Patel, M. Q. Steinman, M. Bajo, S. E. Montgomery, R. Vlkolinsky, T. Nadav, I. Polis, A. J. Roberts, R. D. Mayfield, R. A. Harris, M. Roberto, Microglia control escalation of drinking in alcohol-dependent mice: Genomic and synaptic drivers. Biol. Psychiatry 88, 910–921 (2020).
- Y. J. Liu, E. E. Spangenberg, B. Tang, T. C. Holmes, K. N. Green, X. Xu, Microglia elimination increases neural circuit connectivity and activity in adult mouse cortex. J. Neurosci. 41, 1274–1287 (2021).
- A. L. Ribeiro Xavier, B. T. Kress, S. A. Goldman, J. R. Lacerda de Menezes, M. Nedergaard, A distinct population of microglia supports adult neurogenesis in the subventricular zone. J. Neurosci. 35, 11848–11861 (2015).
- M. Ueno, Y. Fujita, T. Tanaka, Y. Nakamura, J. Kikuta, M. Ishii, T. Yamashita, Layer V cortical neurons require microglial support for survival during postnatal development. Nat. Neurosci. 16, 543–551 (2013).
- K. Grabert, T. Michoel, M. H. Karavolos, S. Clohisey, J. K. Baillie, M. P. Stevens, T. C. Freeman, K. M. Summers, B. W. McColl, Microglial brain region-dependent diversity and selective regional sensitivities to aging. Nat. Neurosci. 19, 504–516 (2016).
- T. R. Hammond, C. Dufort, L. Dissing-Olesen, S. Giera, A. Young, A. Wysoker, A. J. Walker, F. Gergits, M. Segel, J. Nemesh, S. E. Marsh, A. Saunders, E. Macosko, F. Ginhoux, J. Chen, R. J. M. Franklin, X. Piao, S. A. McCarroll, B. Stevens, Single-cell RNA sequencing of microglia throughout the mouse lifespan and in the injured brain reveals complex cell-state changes. Immunity 50, 253–271.e6 (2019).
- A. A. Grace, Dysregulation of the dopamine system in the pathophysiology of schizophrenia and depression. Nat. Rev. Neurosci. 17, 524–532 (2016).
- P. E. Rothwell, M. V. Fuccillo, S. Maxeiner, S. J. Hayton, O. Gokce, B. K. Lim, S. C. Fowler, R. C. Malenka, T. C. Südhof, Autism-associated neuroligin-3 mutations commonly impair striatal circuits to boost repetitive behaviors. Cell 158, 198–212 (2014).
- J. Wu, J. Zhang, X. Chen, K. Wettschurack, Z. Que, B. A. Deming, M. I. Olivero-Acosta, N. Cui, M. Eaton, Y. Zhao, S. M. Li, M. Suzuki, I. Chen, T. Xiao, M. S. Halurkar, P. Mandal, C. Yuan, R. Xu, W. A. Koss, D. Du, F. Chen, L.-J. Wu, Y. Yang, Microglial over-pruning of synapses during development in autism-associated SCN2A-deficient mice and human cerebral organoids. Mol. Psychiatry. 29, 2424–2437 (2024).
- H. Wang, Y. He, Z. Sun, S. Ren, M. Liu, G. Wang, J. Yang, Microglia in depression: An overview of microglia in the pathogenesis and treatment of depression. J. Neuroinflammation 19, 132 (2022).
- C. Zhuo, H. Tian, X. Song, D. Jiang, G. Chen, Z. Cai, J. Ping, L. Cheng, C. Zhou, C. Chen, Microglia and cognitive impairment in schizophrenia: Translating scientific progress into novel therapeutic interventions. Schizophrenia 9, 42 (2023).
- J. Zhang, M. Eaton, X. Chen, Y. Zhao, S. Kant, B. A. Deming, K. Harish, H. P. Nguyen, Y. Shu, S. Lai, J. Wu, Z. Que, K. W. Wettschurack, Z. Zhang, T. Xiao, M. S. Halurkar, M. I. Olivero-Acosta, Y.-E. Yoo, N. A. Lanman, W. A. Koss, W. C. Skarnes, Y. Yang, Restoration of excitation/inhibition balance enhances neuronal signal-to-noise ratio and rescues social deficits in autism-associated Scn2a−deficiency. bioRxiv 641498 [Preprint] (2025). https://doi.org/10.1101/2025.03.04.641498.
- M. Eaton, J. Zhang, Z. Ma, A. C. Park, E. Lietzke, C. M. Romero, Y. Liu, E. R. Coleman, X. Chen, T. Xiao, Z. Que, S. Lai, J. Wu, J. H. Lee, S. Palant, H. P. Nguyen, Z. Huang, W. C. Skarnes, W. A. Koss, Y. Yang, Generation and basic characterization of a gene-trap knockout mouse model of Scn2a with a substantial reduction of voltage-gated sodium channel Nav 1.2 expression. Genes Brain Behav. 20, e12725 (2021).
- A. D. Umpierre, L. L. Bystrom, Y. Ying, Y. U. Liu, G. Worrell, L. J. Wu, Microglial calcium signaling is attuned to neuronal activity in awake mice. eLife 9, e56502 (2020).
- Z. Que, M. I. Olivero-Acosta, M. Robinson, I. Chen, J. Zhang, K. Wettschurack, J. Wu, T. Xiao, C. M. Otterbacher, V. Shankar, H. Harlow, S. Hong, B. Zirkle, M. Wang, N. Cui, P. Mandal, X. Chen, B. Deming, M. Halurkar, Y. Zhao, J. C. Rochet, R. Xu, A. L. Brewster, L. J. Wu, C. Yuan, W. C. Skarnes, Y. Yang, Human iPSC-derived microglia sense and dampen hyperexcitability of cortical neurons carrying the epilepsy-associated SCN2A-L1342P mutation. J. Neurosci. 45, e2027232024 (2024).
- A. D. Umpierre, B. Li, K. Ayasoufi, W. L. Simon, S. Zhao, M. Xie, G. Thyen, B. Hur, J. Zheng, Y. Liang, D. B. Bosco, M. A. Maynes, Z. Wu, X. Yu, J. Sung, A. J. Johnson, Y. Li, L. J. Wu, Microglial P2Y6 calcium signaling promotes phagocytosis and shapes neuroimmune responses in epileptogenesis. Neuron 112, 1959–1977.e10 (2024).
- V. Barbaro, A. Testa, E. Di Iorio, F. Mavilio, G. Pellegrini, M. De Luca, C/EBPdelta regulates cell cycle and self-renewal of human limbal stem cells. J. Cell Biol. 177, 1037–1049 (2007).
- J. Shen, Y. Zhang, H. Yu, B. Shen, Y. Liang, R. Jin, X. Liu, L. Shi, X. Cai, Role of DUSP1/MKP1 in tumorigenesis, tumor progression and therapy. Cancer Med. 5, 2061–2068 (2016).
- E. Favuzzi, S. Huang, G. A. Saldi, L. Binan, L. A. Ibrahim, M. Fernández-Otero, Y. Cao, A. Zeine, A. Sefah, K. Zheng, Q. Xu, E. Khlestova, S. L. Farhi, R. Bonneau, S. R. Datta, B. Stevens, G. Fishell, GABA-receptive microglia selectively sculpt developing inhibitory circuits. Cell 184, 4048–4063.e32 (2021).
- D. P. Schafer, E. K. Lehrman, A. G. Kautzman, R. Koyama, A. R. Mardinly, R. Yamasaki, R. M. Ransohoff, M. E. Greenberg, B. A. Barres, B. Stevens, Microglia sculpt postnatal neural circuits in an activity and complement-dependent manner. Neuron 74, 691–705 (2012).
- S. Deivasigamani, M. T. Miteva, S. Natale, D. Gutierrez-Barragan, B. Basilico, S. Di Angelantonio, L. Weinhard, D. Molotkov, S. Deb, C. Pape, G. Bolasco, A. Galbusera, H. Asari, A. Gozzi, D. Ragozzino, C. T. Gross, Microglia complement signaling promotes neuronal elimination and normal brain functional connectivity. Cereb. Cortex 33, 10750–10760 (2023).
- S. Zhao, A. D. Umpierre, L.-J. Wu, Tuning neural circuits and behaviors by microglia in the adult brain. Trends Neurosci. 47, 181–194 (2024).
- A. D. Umpierre, L.-J. Wu, How microglia sense and regulate neuronal activity. Glia 69, 1637–1653 (2021).
- F. Logiacco, P. Xia, S. V. Georgiev, C. Franconi, Y.-J. Chang, B. Ugursu, A. Sporbert, R. Kuhn, H. Kettenmann, M. Semtner, Microglia sense neuronal activity via GABA in the early postnatal hippocampus. Cell Rep. 37, 110128 (2021).
- J. Zhang, X. Chen, M. Eaton, J. Wu, Z. Ma, S. Lai, A. Park, T. S. Ahmad, Z. Que, J. H. Lee, T. Xiao, Y. Li, Y. Wang, M. I. Olivero-Acosta, J. A. Schaber, K. Jayant, C. Yuan, Z. Huang, N. A. Lanman, W. C. Skarnes, Y. Yang, Severe deficiency of the voltage-gated sodium channel NaV1.2 elevates neuronal excitability in adult mice. Cell Rep. 36, 109495 (2021).
- S. J. Sanders, M. T. Murtha, A. R. Gupta, J. D. Murdoch, M. J. Raubeson, A. J. Willsey, A. G. Ercan-Sencicek, N. M. DiLullo, N. N. Parikshak, J. L. Stein, M. F. Walker, G. T. Ober, N. A. Teran, Y. Song, P. El-Fishawy, R. C. Murtha, M. Choi, J. D. Overton, R. D. Bjornson, N. J. Carriero, K. A. Meyer, K. Bilguvar, S. M. Mane, N. Sestan, R. P. Lifton, M. Gunel, K. Roeder, D. H. Geschwind, B. Devlin, M. W. State, De novo mutations revealed by whole-exome sequencing are strongly associated with autism. Nature 485, 237–241 (2012).
- F. K. Satterstrom, J. A. Kosmicki, J. Wang, M. S. Breen, S. De Rubeis, J.-Y. An, M. Peng, R. Collins, J. Grove, L. Klei, C. Stevens, J. Reichert, M. S. Mulhern, M. Artomov, S. Gerges, B. Sheppard, X. Xu, A. Bhaduri, U. Norman, H. Brand, G. Schwartz, R. Nguyen, E. E. Guerrero, C. Dias, Autism Sequencing Consortium, iPSYCH-Broad Consortium, C. Betancur, E. H. Cook, L. Gallagher, M. Gill, J. S. Sutcliffe, A. Thurm, M. E. Zwick, A. D. Børglum, M. W. State, A. E. Cicek, M. E. Talkowski, D. J. Cutler, B. Devlin, S. J. Sanders, K. Roeder, M. J. Daly, J. D. Buxbaum, Large-scale exome sequencing study implicates both developmental and functional changes in the neurobiology of autism. Cell 180, 568–584.e23 (2020).
- S. Hong, V. F. Beja-Glasser, B. M. Nfonoyim, A. Frouin, S. Li, S. Ramakrishnan, K. M. Merry, Q. Shi, A. Rosenthal, B. A. Barres, C. A. Lemere, D. J. Selkoe, B. Stevens, Complement and microglia mediate early synapse loss in Alzheimer mouse models. Science 352, 712–716 (2016).
- T. R. Hammond, D. Robinton, B. Stevens, Microglia and the brain: Complementary partners in development and disease. Annu. Rev. Cell Dev. Biol. 34, 523–544 (2018).
- Y.-L. Tan, Y. Yuan, L. Tian, Microglial regional heterogeneity and its role in the brain. Mol. Psychiatry 25, 351–367 (2020).
- Y. Li, Z. Li, M. Yang, F. Wang, Y. Zhang, R. Li, Q. Li, Y. Gong, B. Wang, B. Fan, C. Wang, L. Chen, H. Li, J. Ong, Z. Teng, L. Jin, Y.-L. Wang, P. Du, J. Jiao, Decoding the temporal and regional specification of microglia in the developing human brain. Cell Stem Cell 29, 620–634.e6 (2022).
- Y. Liu, L.-J. Zhou, J. Wang, D. Li, W.-J. Ren, J. Peng, X. Wei, T. Xu, W.-J. Xin, R.-P. Pang, Y.-Y. Li, Z.-H. Qin, M. Murugan, M. P. Mattson, L.-J. Wu, X.-G. Liu, TNF-α differentially regulates synaptic plasticity in the hippocampus and spinal cord by microglia-dependent mechanisms after peripheral nerve injury. J. Neurosci. 37, 871–881 (2017).
- T. Masuda, R. Sankowski, O. Staszewski, C. Böttcher, L. Amann, Sagar, C. Scheiwe, S. Nessler, P. Kunz, G. van Loo, V. A. Coenen, P. C. Reinacher, A. Michel, U. Sure, R. Gold, D. Grün, J. Priller, C. Stadelmann, M. Prinz, Spatial and temporal heterogeneity of mouse and human microglia at single-cell resolution. Nature 566, 388–392 (2019).
- G. A. Czapski, J. B. Strosznajder, Glutamate and GABA in microglia-neuron cross-talk in Alzheimer’s disease. Int. J. Mol. Sci. 22, 11677 (2021).
- X. Li, J. Liu, A. J. Boreland, S. Kapadia, S. Zhang, A. C. Stillitano, Y. Abbo, L. Clark, D. Lai, Y. Liu, P. B. Barr, J. L. Meyers, C. Kamarajan, W. Kuang, A. Agrawal, P. A. Slesinger, D. Dick, J. Salvatore, J. Tischfield, J. Duan, H. J. Edenberg, A. Kreimer, R. P. Hart, Z. P. Pang, Polygenic risk for alcohol use disorder affects cellular responses to ethanol exposure in a human microglial cell model. Sci. Adv. 10, eado5820 (2024).
- E. C. Damisah, R. A. Hill, A. Rai, F. Chen, C. V. Rothlin, S. Ghosh, J. Grutzendler, Astrocytes and microglia play orchestrated roles and respect phagocytic territories during neuronal corpse removal in vivo. Sci. Adv. 6, eaba3239 (2020).
- E. Mondo, S. C. Becker, A. G. Kautzman, M. Schifferer, C. E. Baer, J. Chen, E. J. Huang, M. Simons, D. P. Schafer, A developmental analysis of juxtavascular microglia dynamics and interactions with the vasculature. J. Neurosci. 40, 6503–6521 (2020).
- R. C. Knopp, W. A. Banks, M. A. Erickson, Physical associations of microglia and the vascular blood-brain barrier and their importance in development, health, and disease. Curr. Opin. Neurobiol. 77, 102648 (2022).
- D. S. Park, T. Kozaki, S. K. Tiwari, M. Moreira, A. Khalilnezhad, F. Torta, N. Olivie, C. H. Thiam, O. Liani, A. Silvin, W. W. Phoo, L. Gao, A. Triebl, W. K. Tham, L. Gonçalves, W. T. Kong, S. Raman, X. M. Zhang, G. Dunsmore, C. A. Dutertre, S. Lee, J. M. Ong, A. Balachander, S. Khalilnezhad, J. Lum, K. Duan, Z. M. Lim, L. Tan, I. Low, K. H. Utami, X. Y. Yeo, S. Di Tommaso, J.-W. Dupuy, B. Varga, R. T. Karadottir, M. C. Madathummal, I. Bonne, B. Malleret, Z. Y. Binte, N. Wei Da, Y. Tan, W. J. Wong, J. Zhang, J. Chen, R. M. Sobota, S. W. Howland, L. G. Ng, F. Saltel, D. Castel, J. Grill, V. Minard, S. Albani, J. K. Y. Chan, M. S. Thion, S. Y. Jung, M. R. Wenk, M. A. Pouladi, C. Pasqualini, V. Angeli, O. N. F. Cexus, F. Ginhoux, iPS-cell-derived microglia promote brain organoid maturation via cholesterol transfer. Nature 623, 397–405 (2023).
- C. Z. Han, R. Z. Li, E. Hansen, S. Trescott, B. R. Fixsen, C. T. Nguyen, C. M. Mora, N. J. Spann, H. R. Bennett, O. Poirion, J. Buchanan, A. S. Warden, B. Xia, J. C. M. Schlachetzki, M. P. Pasillas, S. Preissl, A. Wang, C. O’Connor, S. Shriram, R. Kim, D. Schafer, G. Ramirez, J. Challacombe, S. A. Anavim, A. Johnson, M. Gupta, I. A. Glass, Birth Defects Research Laboratory, M. L. Levy, S. B. Haim, D. D. Gonda, L. Laurent, J. F. Hughes, D. C. Page, M. Blurton-Jones, C. K. Glass, N. G. Coufal, Human microglia maturation is underpinned by specific gene regulatory networks. Immunity 56, 2152–2171.e13 (2023).
- C. Blomeley, E. Bracci, Substance P depolarizes striatal projection neurons and facilitates their glutamatergic inputs. J. Physiol. 586, 2143–2155 (2008).
- S. Taverna, E. Ilijic, D. J. Surmeier, Recurrent collateral connections of striatal medium spiny neurons are disrupted in models of Parkinson’s disease. J. Neurosci. 28, 5504–5512 (2008).
- K. Bisht, K. A. Okojie, K. Sharma, D. H. Lentferink, Y.-Y. Sun, H.-R. Chen, J. O. Uweru, S. Amancherla, Z. Calcuttawala, A. B. Campos-Salazar, B. Corliss, L. Jabbour, J. Benderoth, B. Friestad, W. A. Mills III, B. E. Isakson, M. E. Tremblay, C. Y. Kuan, U. B. Eyo, Capillary-associated microglia regulate vascular structure and function through PANX1-P2RY12 coupling in mice. Nat. Commun. 12, 5289 (2021).
- M. Robinson, K. Wettschurack, M. S. Halurkar, X. Chen, Z. Zhang, J. Zhang, Y. Yang, Precision medicine for sodium channelopathy-related autism and epilepsy. Trends. Mol. Med. 28, S1471–S4914 (2025).
- Y. Yang, What we can learn from the first personalized CRISPR-treated baby to tackle genetic brain disorders. Neuron 113, 3697–3702 (2025).
- Y. Miura, M.-Y. Li, O. Revah, S.-J. Yoon, G. Narazaki, S. P. Pasca, Engineering brain assembloids to interrogate human neural circuits. Nat. Protoc. 17, 15–35 (2022).
- J. Jo, Y. Xiao, A. X. Sun, E. Cukuroglu, H.-D. Tran, J. Göke, Z. Y. Tan, T. Y. Saw, C.-P. Tan, H. Lokman, Y. Lee, D. Kim, H. S. Ko, S.-O. Kim, J. H. Park, N.-J. Cho, T. M. Hyde, J. E. Kleinman, J. H. Shin, D. R. Weinberger, E. K. Tan, H. S. Je, H.-H. Ng, Midbrain-like organoids from human pluripotent stem cells contain functional dopaminergic and neuromelanin-producing neurons. Cell Stem Cell 19, 248–257 (2016).
- A. McQuade, M. Blurton-Jones, Human induced pluripotent stem cell-derived microglia (hiPSC-Microglia). Methods Mol. Biol. 2454, 473–482 (2022).
- W. Li, T. Wu, K. Zhu, G. Ba, J. Liu, P. Zhou, S. Li, L. Wang, H. Liu, W. Ren, H. Yu, Y. Yu, A single-cell transcriptomic census of mammalian olfactory epithelium aging. Dev. Cell. 59, 3043–3058.e8 (2024).
¶ Acknowledgments
We thank A. Kimbrough from Purdue University for providing access to Imaris software.
¶ Funding
This work was supported by the National Institute of Neurological Disorders and Stroke (NINDS) of the National Institutes of Health (NIH) (R01NS117585 and R01NS123154 to Y.Y.). X.C. was supported by an American Epilepsy Society (AES) Postdoctoral Research Fellowship. J.Z. was supported by the FamilieSCN2A Foundation.
¶ Author contributions
- Writing–original draft: J.W., X.C., M.R., and Y.Y.
- Conceptualization: J.W., J.Z., W.S., L.-J.W., and Y.Y.
- Investigation: J.W., X.C., J.Z., K.W., M.R., Y.-E.Y., A.D.A., and Z.Q.
- Methodology: J.W., X.C., J.Z., K.W., Y.Z., W.S., Z.-Y.Z., L.-J.W., and Y.Y.
- Formal analysis: J.W., J.Z., M.R., W.L., Y.Z., and M.T.
- Resources: J.W., X.C., J.Z., K.W., W.L., and W.C.S.
- Data curation: J.W., X.C., J.Z., Y.Z., and B.A.D.
- Writing–review & editing: J.W., X.C., J.Z., K.W., M.R., W.L., Y.Z., Y.-E.Y., B.D., A.D.A., D.D., M.T., C.Y., W.C.S., Z.-Y.Z., J.-C.R., L.-J.W., and Y.Y.
- Validation: J.W., J.Z., K.W., and M.R.
- Visualization: J.W., X.C., J.Z., K.W., and Y.Z.
- Software: J.W., X.C., W.L., Y.Z., and Y.S.
- Project administration: J.W., J.Z., and Y.Y.
- Funding acquisition: X.C., J.Z., and Y.Y.
- Supervision: J.W. and Y.Y.
¶ Competing interests
The authors declare that they have no competing interests.
¶ Data, code, and materials availability
The raw scRNA-seq data are publicly available at GEO through accession number GEO: GSE312664 (https://www.ncbi.nlm.nih.gov/geo/query/acc.cgi?acc=GSE312664). All data and code needed to evaluate and reproduce the results in the paper are present in the paper and/or the Supplementary Materials. The hiPSC lines can be provided by The Jackson Laboratory pending scientific review and a completed material transfer agreement. Requests for the hiPSC lines should be submitted to The Jackson Laboratory.
Submitted: 29 April 2025
Accepted: 15 January 2026
Published: 18 February 2026
DOI: 10.1126/sciadv.ady2977