¶ High-density multielectrode array (MEA) recordings in a rodent glioma model
Ferdinand Forberger a,1 , Fabiana Santana Kragelund a,1 , Katrin Porath a , Rüdiger Kohling ¨ a,b , Falko Lange a,b , Timo Kirschstein a,b,*
a Oscar-Langendorff-Institute of Physiology, Rostock University Medical Center, Rostock 18057, Germany
b Center for Transdisciplinary Neurosciences Rostock, University of Rostock, Rostock 18147, Germany
* Corresponding author at: Oscar-Langendorff-Institute of Physiology, Rostock University Medical Center, Rostock 18057, Germany.E-mail addresses: rudolf.forberger@uni-rostock.de (F. Forberger), fabiana.kragelund@uni-rostock.de (F.S. Kragelund), katrin.porath@uni-rostock.de (K. Porath), ruediger.koehling@uni-rostock.de (R. Kohling), ¨ falko.lange@uni-rostock.de (F. Lange), timo.kirschstein@uni-rostock.de (T. Kirschstein).
1 These authors contributed equally to this work.
¶ Highlights
• Network bursts were induced in acute brain slices from glioma-bearing rats.
• 64 × 64 multielectrode arrays allowed for detailed recording of network bursts.
• Center-of-activity trajectories and activity propagation analysis were described.
• Network bursts differed between glioma-bearing slices and controls.
• Spike Time Tiling Coefficient-based functional connectivity graphs were constructed.
¶ Keywords:
Multielectrode array
Microelectrode array
Glioma
Network bursts
Spike sorting
Spike time tiling coefficient
¶ ABSTRACT
Background: High-grade gliomas are aggressive primary brain tumors that affect the surrounding brain tissue, which can lead to neurological deficits, epilepsy, cognitive deficits, and tumor progression. Research has focused on glutamatergic alterations, but the understanding of the underlying network mechanisms is still scarce.
New method: To investigate how gliomas might affect neural network integrity and capacity for spiking activity, we induced network bursting events in neocortical slices from F98 glioma-bearing rats. Network activity was recorded using a high-density multielectrode array to assess the network’s capacity for extended periods of high activity. We describe glioma cell implantation, brain slice preparation, and detailed data analysis of electrophysiological recordings, focusing on computational methods for characterization of the network-wide bursting events.
Results: Spike sorting was performed using Kilosort4 and employed to identify network bursts. Burst origins were estimated from multi-unit activity, and network burst propagation speed was assessed. Network-level functional connectivity was analyzed using metrics derived from graphs based on the spike time tiling coefficient. Our results indicate reduced network integrity in glioma-bearing slices.
Comparison with existing methods: The combination of a high-density multielectrode array with Kilosort4 is ad vantageous over conventional recording techniques in terms of detecting network bursting and plotting centerof-activity trajectories.
Conclusions: This protocol provides a robust platform for dissecting network activity and establishes a basis for future mechanistic studies. We also discuss the limitations and experimental challenges of our preclinical approach to investigating glioma-associated effects on surrounding neuronal networks.
¶ 1. Introduction
High-grade gliomas are aggressive and lethal primary brain tumors; median survival rarely exceeds 15 months despite multimodal therapy (Guo et al., 2023; Stupp et al., 2005; Wang and Jiang, 2013). In addition to the drastically reduced life expectancy, high-grade gliomas compromise brain functions, often causing neurological deficits, cognitive decline, and seizures (Amidei and Kushner, 2015; Ghadimi et al., 2025; Samudra et al., 2019).
In the peritumoral cortex, interactions between neoplastic cells and the microenvironment create a hyperexcitable network (Campbell et al.,2012; Hatcher et al., 2020; Taylor et al., 2023). Implicated mechanisms include excessive extracellular glutamate release, disrupted inhibitory GABAergic signaling, altered ion channel expression, and chronic neuroinflammation (Barron et al., 2025; Lange et al., 2021; Liu et al., 2019). Furthermore, evidence indicates that neuron-to-glioma synapses allow excitatory neuronal inputs to directly promote glioma proliferation (Harwood et al., 2024; Huang-Hobbs et al., 2023; Venkataramani et al., 2022, 2019; Venkatesh et al., 2017, 2015). Although glutamatergic transmission has been the primary focus, cholinergic and GABAergic pathways may also contribute to tumor-associated network dynamics (Drexler et al., 2025; Li et al., 2024; Tantillo et al., 2020). Despite this research, the understanding of how gliomas alter neuronal population activity, integrity, and network synchronicity remains limited.
Advances in computational hardware and signal processing have now enabled the capture and analysis of signals from thousands of electrodes simultaneously. High-density multielectrode arrays (HDMEAs) offer the opportunity to investigate various central nervous system pathologies (Emery et al., 2025; Kragelund et al., 2025; Quintanilla et al., 2025). However, to date, only small MEA systems have been used to investigate the effects of gliomas ex vivo (Gill et al., 2020). Here, we present a novel approach to analyzing HD-MEA data from tumor-bearing rat brain slices kept under hyperexcitable conditions to induce network bursts (NBs).
Our protocol allows for a detailed description of NBs, identification of their origins as well as capturing network-wide interactions between single unit activities.
¶ 2. Methods
¶ 2.1. Study protocol
A graphical overview of our study protocol is shown in Fig. 1. We recorded chemically induced activity in neocortical brain slices from F98 glioma-bearing rats after prolonged disinhibition. This model recapitulates the diffuse infiltration, rapid progression, and immunological microenvironment of human high-grade gliomas (Barth and Kaur, 2009; Biasibetti et al., 2017; Mathieu et al., 2007), and epileptic seizures in vivo (Lange et al., 2020). Ten to twelve days after glioma implantation, rats were sacrificed. Network bursts (NBs) were induced by perfusing rat brain slices with artificial cerebrospinal fluid lacking and containing and 50 µmol/L 4-aminopyridine.
HD-MEA recordings were spike-sorted using Kilosort4 (Pachitariu et al., 2024b). The sorted units were used to describe NB propagation, and functional connectivity graphs were constructed and analyzed based on the spike time tiling coefficient (Cutts and Eglen, 2014) between well-isolated single-unit activities.
¶ 2.2. The glioma-bearing rat
¶ 2.2.1. Cell culture
The rat F98 glioma cell line was obtained from the American Type Culture Collection (ATCC), and aliquots containing a defined number of cells were prepared for long-term storage. For the experiments, the cells were cultured in Dulbecco’s Modified Eagle Medium: Nutrient Mixture F-12 (DMEM/F12; from PAN Biotech, Aidenbach, Germany) with fetal calf serum (Bio&SELL, Feucht, Germany) at in a humidified atmosphere. Continually growing cell cultures were regularly passaged and, at constant intervals, were tested for mycoplasmic contamination using MycoSPY®-PCR Mycoplasma Test Kit (Biontex, Munich, Germany). Prior to stereotactic injection, the cells were harvested by trypsinization and prepared for implantation as cell suspension ( cells ) in phosphate-buffered saline (PBS).
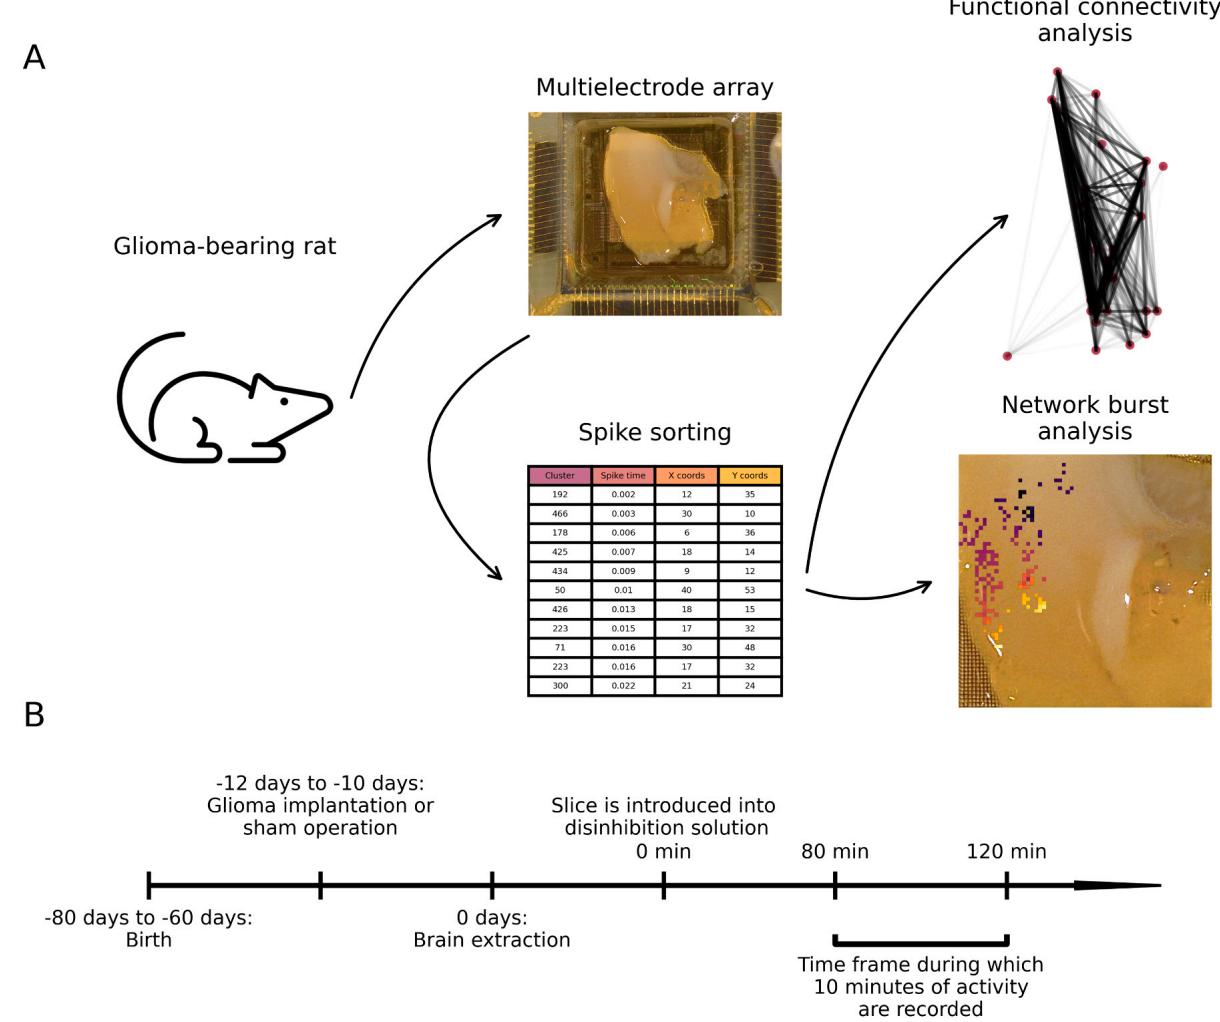
Fig. 1. Study protocol. (A) F98 gliomas were stereotactically implanted into the sensorimotor cortex of Fischer rats. After 10–12 days, acute brain slices were prepared and pharmacologically disinhibited for at least using artificial cerebrospinal fluid containing 0 mmol/L , , and 4-aminopyridine (“disinhibition solution” in panel B) before being placed onto a MEA system. Ten minutes of spontaneous activity were recorded, and spike sorting was performed using Kilosort4. Network bursts were analyzed, and single-unit activity was used for graph-based investigation of functional connectivity between units. (B) Timeline of the experiments.
¶ 2.2.2. In vivo F98 glioma model
The well-established syngeneic Fischer 344 rat/F98 tumor model was employed to imitate human glioma (Lange et al., 2020; Mathieu et al., 2007). All procedures including living rats were conducted according to national and international guidelines on the ethical use of animals (European Council Directive 86/609/EEC, approval of local authority LALLF M-V/TSD/7221.3–1–020/20). All efforts were made to minimize animal suffering and to reduce the number of Fischer rats used in this study. The animals were housed under environmentally controlled conditions (12-hour light/dark cycles, lights switched on from ., and relative humidity).
Stereotactic implantation of glioma cell suspension into the sensorimotor neocortex of 4 Fischer rats was performed under anesthesia based on ketamine i.p.) and xylazine i.p.) as previously reported (Lange et al., 2020). To inject F98 glioma cells, the head was fixed in a stereotactic frame (Narishige, Tokyo, Japan). Following a scalp incision, the skull was freed from extracranial muscles, and a hole of diameter was manually drilled into the skull in the left parasagittal position (relative to bregma: posterior, left). A total of cells was injected at a rate of using a Hamilton syringe (Model 701 N SYR; Hamilton, Reno, Nevada, USA), inserted deep relative to the bregma. After injection of the cell suspension, the drill hole was covered with Heliobond (Ivoclar Vivadent, Schaan, Lichtenstein), and the scalp was closed with a suture. For two days after surgery, the animals were provided with orally administered metamizole ; supplemented in the drinking water) for postoperative analgesia. Three additional sham-operated animals underwent the same surgical procedure, but PBS without glioma cells were injected.
¶ 2.2.3. Neocortical slice preparations
Fischer rats were anesthetized with diethyl ether (Avantor Performance Materials, Gliwice, Poland) and rapidly decapitated 60–80 days after birth. The brain was promptly extracted and immersed in ice-cold, oxygenated dissection solution of the following composition (in mmol/L): 87 NaCl, , 2.5 KCl, , , 7 10 D-glucose, and 75 sucrose, adjusted to with an osmolarity of . Coronal slices of the sensorimotor cortex ) were prepared using a vibratome (Leica VT1200, Wetzlar, Germany) in chilled, continuously carbogenated dissection solution. We ensured that the macroscopically healthy area was comparable between slices from sham-operated and glioma-bearing rats , mean , for sham-operated slices and 10.3 , for glioma-bearing slices).
Subsequently, slices were transferred to a submerged holding chamber containing carbogen-bubbled artificial cerebrospinal fluid (aCSF) with the following constituents (in mmol/L): 124 NaCl, 26 , 3 KCl, , , , and -glucose, adjusted to and an osmolarity of . Slices were maintained in this aCSF for at room temperature. Prior to transfer onto the MEA, slices were preincubated for in modified aCSF containing 8 mmol/L KCl, 0 mmol/L and 4-aminopyridine (4-AP; Tocris, Bristol, United Kingdom). Our preliminary studies (Forberger et al., 2025; Lange et al., 2020) showed that a robust occurrence of network activity was typically reached by minutes 40–60.
Histological analysis with hematoxylin and eosin staining was performed on a small subset of brain slices to verify tissue penetration by the MEA and to confirm glioma invasion. Sections adjacent to the MEA exhibited vacuolar spaces consistent with electrode penetration (Supplementary figure 1).
¶ 2.3. Multielectrode array
For the electrophysiological recording, coronal brain slices were transferred onto the recording surface of a 3D HD-MEA chip (CorePlate 1 W 38–60, 3Brain AG, Pf¨affikon ZH, Switzerland) using stereomicroscopic guidance (S9i, Leica Stereo Microscope, Wetzlar, Germany) and secured with a slice anchor (3Brain AG, Supplementary figure 2). The device features a active area with 4096 electrodes , pitch, height). Extracellular activity from the sensorimotor cortex was recorded continuously for at a sampling rate of using a 3D HD-MEA chip coupled to the BioCAM DupleX acquisition platform (3Brain AG). The data was high-pass filtered employing a filter upon data acquisition. We recorded the activity of 10 slices from sham-operated rats and 12 from gliomabearing animals.
¶ 2.4. Spike sorting
Spike sorting is a computational technique used to separate the individual electrical firings (“spikes”) of different neurons from multineuronal extracellular recordings. It works by detecting spikes, extracting their properties, and subsequently grouping them into clusters, with each cluster (hereafter called unit) ideally representing a distinct neuron.
The raw recordings (saved as *.brw files) were loaded in chunks and stored as unsigned 16-bit integers in a binary format, enabling more efficient loading via SpikeInterface (version 0.101.2 (Buccino et al., 2020)). Spike sorting was performed using Kilosort4 (version 4.0.37 (Pachitariu et al., 2024b)) accessed through SpikeInterface, with parameters specifically adjusted for compatibility with our recording system (Table 1, (Pachitariu et al., 2024a)). We utilized an NVIDIA GeForce RTX 3060 for Kilosort4’s PyTorch-based computations, achieving a spike sorting duration of approximately two hours per recording.
Channels not covered by the brain slice upon visual inspection were excluded from spike sorting to save computational resources.
For each recording, we isolated putative single-unit activity (SUA). Kilosort4 determines whether a spike-sorted unit is well isolated or contains multi-unit activity by computing metrics based on its correlogram (Pachitariu et al., 2024b). It should be noted that the Kilosort autocorrelogram threshold default of 0.2, used here as well, is different from the value of 0.1 used in Pachitariu et al. We classified spike-sorted units with a mean firing rate above and the Kilosort4 label “good” as putative SUA.
Table 1 Spike sorting parameters deviating from the default settings.
| Variable | Value | Comments |
| nt | 41 | The recommended setting is 2 × (number of sampling points within 2 ms)+ 1. |
| min_template_size | 20 (um) | Default is 1O um,which is suitable only for closer contacts than found in our MEA system. |
| dmin, dminx | 60(um) | Vertical and horizontal electrode spacing. |
| x_centers | 15 | Centers should be provided every 200-300 μm. |
| max_channel_distance | 85 (um) | Approximately the diagonal distance between electrodes. |
¶ 2.5. Single unit activity (SUA) analysis
Firing patterns of SUAs were used to compare general trends and identify differences in SUA between glioma-bearing and sham-operated slices. To analyze firing patterns, an autocorrelogram was calculated for each isolated single unit with a bin size of and a maximum lag of . Each autocorrelogram was then normalized by its -norm. Principal component analysis (PCA) was used for dimensionality reduction. The first 108 components, which explained approximately of the variance, were selected for k-means clustering. K-means was performed using scikit-learn’s default settings. The optimal number of clusters was determined using the Silhouette score of clustering results from 2 to 10 clusters. For each number of clusters, the mean Silhouette score from 100 clustering runs with different random states was calculated. The highest mean scores were achieved with two or three clusters (both 0.20), with a sharp decline for four or more clusters. The three cluster solution was selected as it provided more meaningful groups: Cluster 1 contained autocorrelograms with the highest immediate postfiring probability, Cluster 2 had a wider range of firing probabilities mostly within , and Cluster 3 displayed no distinct maximum bursting probability within (Fig. 2). The stability of the threecluster solution was confirmed by repeatedly sampling pairs, each containing of the data and comparing the resulting clusters using the adjusted Rand index. This analysis yielded a mean adjusted Rand index of , indicating high stability.
The proportional contribution of each group to each cluster was statistically analyzed. For each recording, the percentage of its clusters belonging to each group was calculated. Zeros in the data were replaced with a small constant before applying an Isometric Log-Ratio (ILR) transformation. An ILR transformation is necessary for compositional data (Gloor et al., 2017). Statistical significance was tested using PERMANOVA (scikit-bio, version 0.7.0, (Rideout et al., 2025)).
¶ 2.6. Network burst analysis
NBs were detected semi-automatically. An NB was defined to be an NB when over of spike-sorted units exhibited bursting activity overlapping by more than . NBs separated by less than were merged, and those shorter than were discarded. Burst activity was defined to contain more than five consecutive spikes with inter-spike intervals of or less, sustained for over . The parameters for (non-network-wide) bursting detection were optimized to achieve high recall (sensitivity), identifying as many potential NBs as possible. Subsequent filtering discards potential NBs that are too short or lack sufficient bursting units. Additional manual inspection further ensures that only NBs involving a substantial portion of the network are recognized as such.
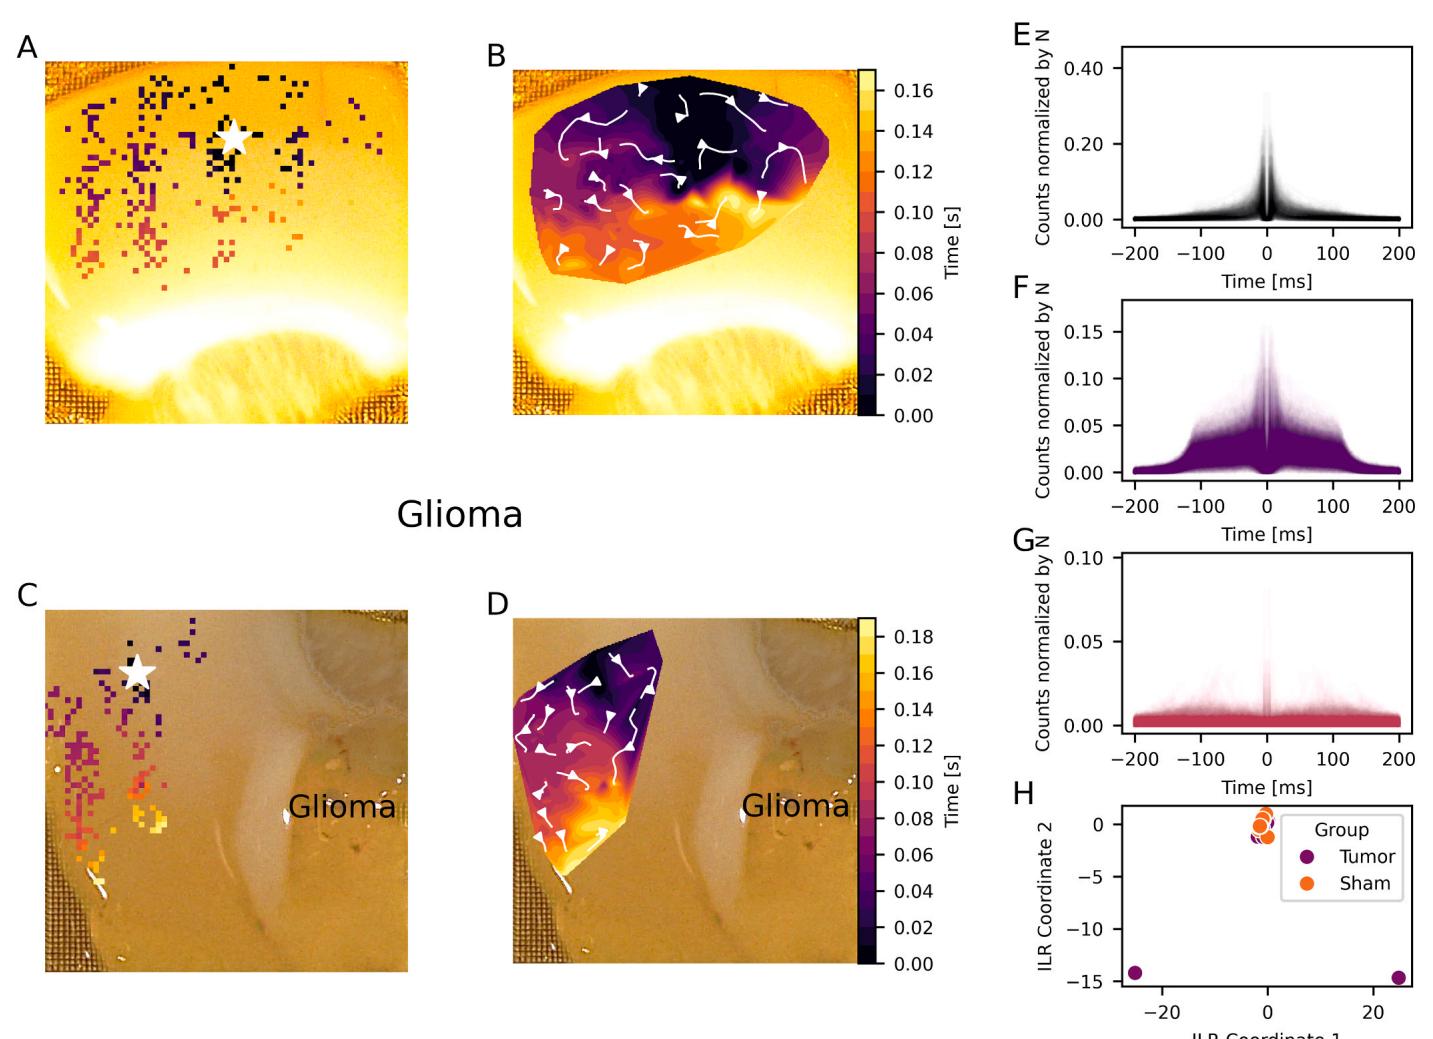
Fig. 2. Propagation of network bursts in sham-operated and glioma-bearing slices and analysis of firing patterns. (A) Activity propagation across the slice for a single network burst. Each colored square represents one spike sorted unit. The color indicates the onset time of bursting activity for each unit. The algorithmically estimated origin is marked by a white star. (B) A time-surface constructed from the burst start times shown in (A). White streamlines illustrate the propagation velocity calculated from this time-surface. © and (D) show burst start times, the time-surface, and velocity streamlines for a glioma-bearing slice. (E-G) Autocorrelation plots for the three identified clusters. (H) ILR transformation of the relative proportions to which each recording belongs into which cluster.
We used a custom graphical user interface, based on Tkinter (version 8.6) and Matplotlib (version 3.9.2), which allowed us to manually correct NB misidentifications arising from noise artifacts. For recordings with either very few or an exceptionally high number of units, the threshold for the percentage of the total amount of units needed for NB identification was manually adjusted between and . The start and endpoints of each NB and the necessary information to recalculate the participating units were saved. It should be noted that spiking activity was not only happening during network bursts. The threshold values for NBs in this study were therefore chosen such that the term NB only describes the activity of high-frequency spiking at multiple locations at the same time. It should be noted that we did not exclude spikesorted units containing multi-unit activity (MUA) for the process of identifying NBs.
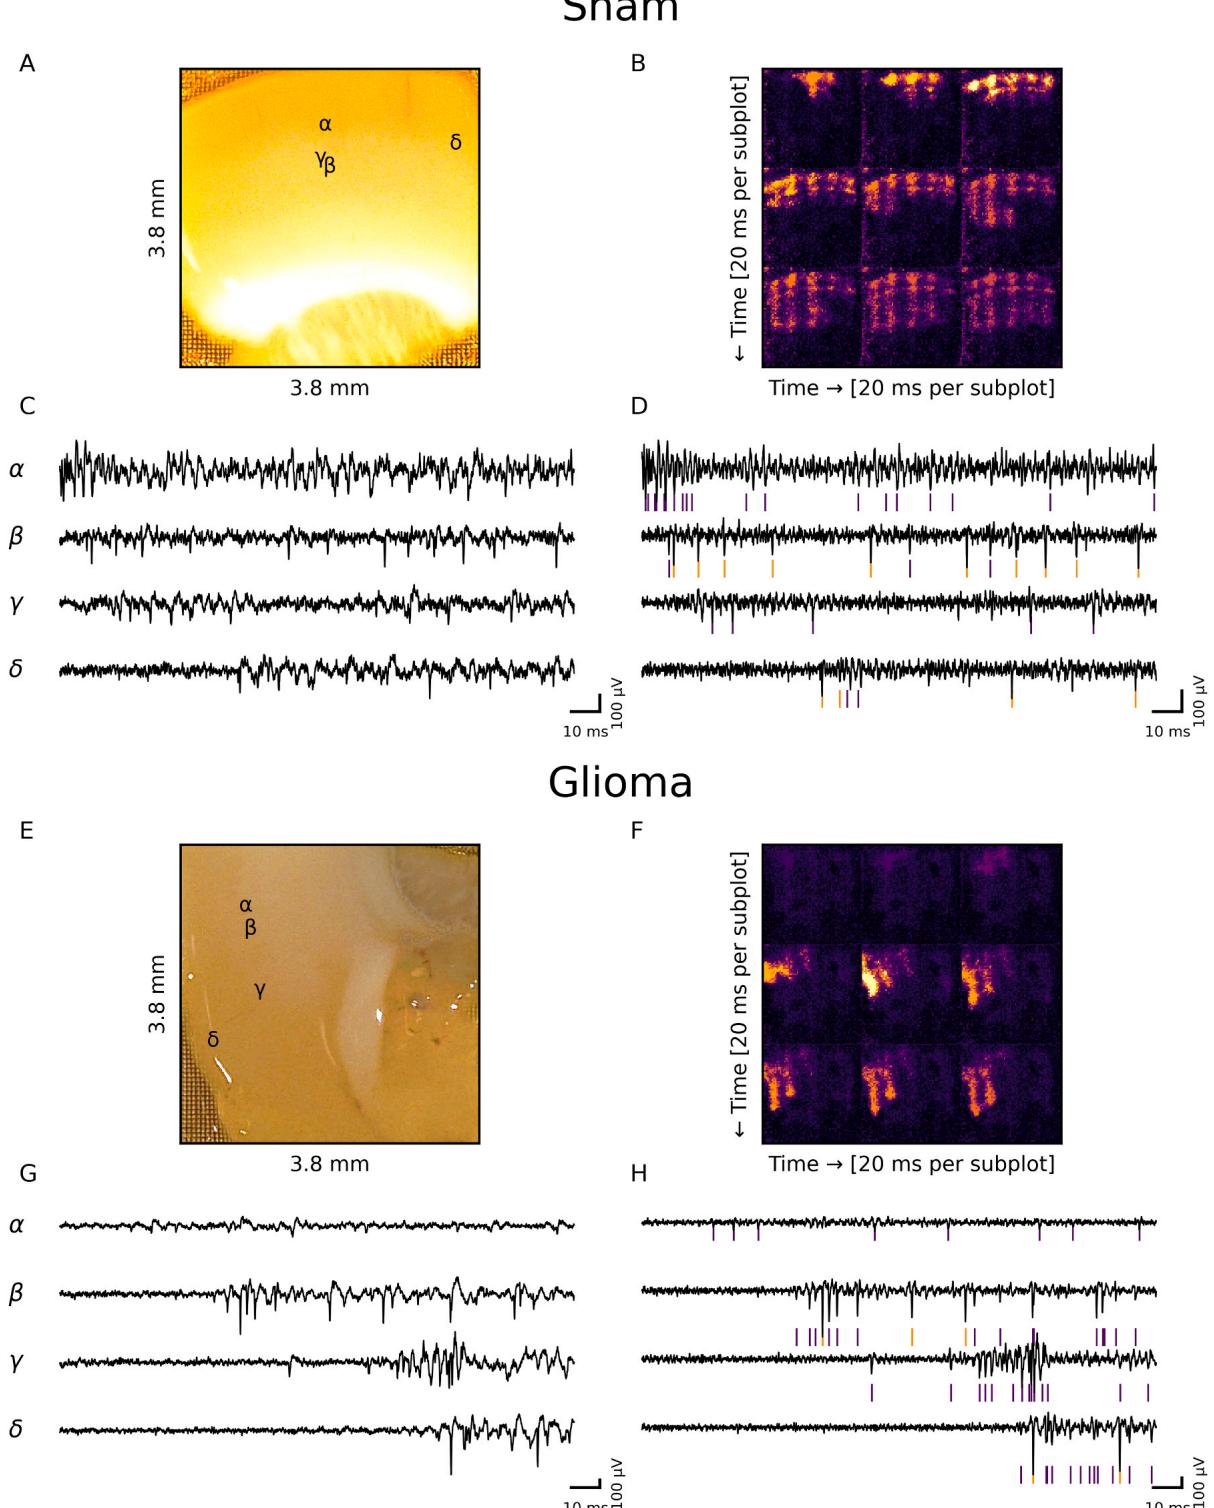
Fig. 3. Representative network bursting events. (A) Photograph of a brain slice from a sham-operated animal placed on the MEA. (B) Nine heatmaps representing the channel-wise standard deviation over intervals after the beginning of a network burst. © Traces recorded with a hardware high-pass filter. Their locations on the slice are denoted by Greek letters. (D) The same traces as in © after high-pass filtering. Detected spikes are denoted by colored vertical lines. If multiple units are detected for an electrode, the spikes are colored differently. (E) Photograph of a brain slice from a glioma-bearing animal placed on the MEA. (F) Nine heatmaps representing the channel-wise standard deviation over intervals after the beginning of a network burst. (G) Traces recorded with a hardware high-pass filter. Their locations on the slice are denoted by Greek letters. (H) The same traces as in (G) after high-pass filtering. Detected spikes are denoted by colored vertical lines. If multiple units are detected for an electrode, the spikes are colored differently.
A small subset of our NB analyses was also compared to data analyzed employing BrainWave6 (3brain AG, Supplementary table 3).
¶ 2.6.1. Estimating the origins of network bursts
The electrodes corresponding to the center of each spike-sorted unit were determined by identifying the electrode with the largest squared sum of the spike template learned by Kilosort4 for this unit.
To estimate the spatial origin of each NB, spike-sorted units exhibiting bursts during the event, and their associated electrodes, were first sorted by the time of their first spike within the NB. The goal was to first eliminate temporal outliers which are likely not related to the NB and then to estimate the origin of the NB by calculating the centroid of the earliest units participating in the NB.
Outliers in spike timing were removed using local neighborhood statistics based on the spatial coordinates of the spike and their associated time values, described as point . For each point up to 10 available neighboring points (not counting itself) were identified in 2D space. For each of the points, the local weighted mean time of their first spike during the NB was calculated. The weight for a point and a neighbor was calculated based on formula (1). i is the index of the point being investigated. is the index that iterates through the set of neighbors corresponding to point
described the Euclidean distance between points and . describes a constant that is in our case equal to the electrode pitch .
Subsequently, we calculated the weighted local mean time (2)
Where represents the time values of the -th neighbor. The weighted local standard deviation of the neighbors’ time values was calculated by formula (3).
A point was identified as a temporal outlier when the absolute difference between its own time and the computed local weighted mean time exceeded double the weighted local standard deviation of t.
Next, the largest subset among the first of spiking electrodes having at least one neighbor within was calculated. The centroid of this subset was defined as the NB origin (white stars in Fig. 2A and C). The approach to remove outliers explained above mitigated inaccuracies that resulted from isolated, random spikes, which might otherwise have skewed the origin estimate.
Since Kilosort4’s accuracy for 3brain HD-MEA systems has not yet been extensively validated, we compared our Kilosort-derived NB origins with those obtained through an independent method: We visually inspected heatmaps of channel-wise standard deviations (Fig. 3B, F), calculated over intervals for randomly selected NBs. We found no visually noticeable differences between the propagation of the NBs between the two methods.
To assess for any spatial trends in the occurrence of NBs relative to the glioma, slices were aligned and all analyzed data were registered to a common coordinate system. No notable spatial trends were observed (Supplementary Figure 3 and supplementary table 1).
¶ 2.6.2. Center of activity trajectory
To assess the propagation of the neuronal activity, we calculated the center of activity (CoA) trajectory (CoAT) across events. The CoAT was implemented analogous to Chao et al. (Chao et al., 2007) as follows in formula 4:
is the -coordinate of the center of activity, the y-coordinate of the center of activity. is the activity level (spike frequency), of the i-th spike sorted unit. and are the -coordinate and y-coordinate of the i-th spike-sorted unit, respectively. is the total number of spike-sorted units. This CoA was then calculated for long windows of activity from each NB resulting in a CoAT. The windows overlapped by . It should be noted that we did not exclude MUA for the calculation of the CoAT.
¶ 2.6.3. Network bursting propagation speed
To calculate the propagation speed of bursting activity, a time surface was constructed from the bursting start times. The gradient of this surface allowed us to calculate the propagation speed across the spatial domain. Outlier burst start times were filtered beforehand as described in Section 2.5.1.
The data for each bursting event consisted of a sparse set of electrode coordinates and their corresponding burst onset times .
First, a continuous activation time surface, , was generated by interpolating these sparse data points onto a high-resolution 2D grid points) encompassing the spatial extent of the MEA. This interpolation was performed using a cubic method (scipy.interpolate. griddata), chosen to yield a smooth surface suitable for stable gradient computation.
Next, the gradient of this time surface, , was computed numerically at each grid point using a second-order central difference scheme (numpy.gradient). The direction of propagation at any point points in the direction of the negative gradient, .
The local propagation speed, , is inversely proportional to the magnitude of the gradient. A steeper gradient signifies a slower wave front, as more time elapses over a shorter distance. The speed was calculated as (5):
This calculation produced a 2D “speed map” representing the local propagation speed at each point on the grid. Grid points lying outside the convex hull of the active electrodes were masked and excluded from analysis. A single representative propagation speed for each event was determined by calculating the median of all valid speed values in the map, as the median is less sensitive to interpolation artifacts and outliers than the mean.
Propagation paths were visualized by generating a stream plot from the negative gradient vector field (-∂T/∂x, -∂T/∂y).
¶ 2.7. Functional connectivity analysis
To characterize how the spike-sorted units interact, especially during NBs, we constructed undirected graphs containing well-isolated units (mean firing rate above , Kilosort4 label “good”) as nodes using NetworkX (Version 3.5) and nx-cugraph (Version 25.04.00). We additionally only considered single units that showed bursting activity during at least of NBs. This step seemed to eliminate most of the SUA we would have considered to contain mainly noise. Edges between nodes were weighted by the spike time tiling coefficient (STTC, (Cutts and Eglen, 2014)), calculated for a Δt of . To process the large datasets generated by the HD-MEA in an efficient manner, we modified the STTC implementation from the elephant library (Version 1.1.1, (Denker et al., 2018)) to be partially compilable by Numba (Version 0.61.2). Δt was chosen as based on cross correlation histogram data calculated from one 60-s-long snippet for each recording. Most recordings showed a reasonably strong correlation between the spike-sorted units at Δt of . The STTC provides a frequency-independent measure of spiking “correlation”. We did not observe relevant negative values , and therefore simplified graph-based calculations by establishing edges only if the STTC exceeded 0.
We evaluated the following metrics for each graph (i.e. for each slice):
Global weighted efficiency (Latora and Marchiori, 2001): Global efficiency measures how efficiently information can be exchanged across the entire graph. In our weighted graph, the “distance” between nodes (well-isolated spike-sorted units) is defined as 1-STTC. Global efficiency is calculated as the average of the inverse of the shortest path lengths between all pairs of nodes in the network. A high global weighted efficiency suggests that, on average, any two spike-sorted units in the recorded slice can influence each other effectively through paths of strong functional connections (high STTC values along the path). It reflects the network’s overall capacity for signal propagation, in this case, epileptiform activity across distant parts of the network.
Average weighted clustering (Watts and Strogatz, 1998): The clustering coefficient of a single node measures how strongly its direct functional partners (neighbors in the graph) are also functionally connected to each other. The “weighted” aspect means that the strength of these connections (STTC values) is taken into account. A high average weighted clustering coefficient indicates that the spike sorted units have a strong tendency to form tightly knit local functional groups.
Average weighted node strength (Fornito et al., 2016a): The strength of a node in a weighted graph is the sum of the weights of all edges connected to that node. Here, for a given unit, its strength is the sum of all STTC values it shares with its connected partners. The average weighted node strength is simply the average of these individual strengths across all units in the network. The average weighted node strength reflects the general intensity of overall synchrony within the recorded neural population. A high average strength suggests that units, in general, exhibit strong temporal “correlations” in their firing patterns with their connected neighbors.
Modularity score (Fornito et al., 2016b): In graph theory, modularity is a metric that quantifies the extent to which a network or graph can be divided into distinct communities or modules. In our study, the Louvain community detection algorithm was used to identify communities with the default parameters as implemented in NetworkX. The modularity score measures the strength of the division by evaluating whether there are more connections within a community than would be expected by chance and fewer connections between different communities. In the context of a functional network of spike-sorted units, a high modularity score would suggest that the neural population is organized into distinct, semi-independent functional ensembles.
To explore whether network metrics are influenced by NB duration, we calculated the Spearman correlation between NB duration and the graph metrics. None of the correlations reached significance
¶ 3. Results and discussion
In this study, we present a detailed protocol for capturing pharmacologically induced bursting network activity in acute neocortical slices from F98 glioma-bearing Fischer rats using a high-density multielectrode array (HD-MEA). We successfully recorded network bursts (NBs) after disinhibition and analyzed their spatial origins, propagation patterns, as well as network-level interactions of spiking activity.
Network activity was chemically induced by incubating acute brain slices in a disinhibition solution lacking and containing 8 mmol/ and 4-aminopyridine for up to before recording. This model disinhibits excitatory glutamatergic activity (Mody et al., 1987) and GABAergic inhibitory neurons (Codadu et al., 2019; Lado et al., 2022). The strong disinhibition contrasts with other studies that typically assess activity immediately after introducing a disinhibitory solution, often based on modified extracellular ion concentrations or pharmacological ion channel inhibition. These models are frequently used to evaluate hyperexcitability in glioma-surrounding networks (Campbell et al., 2012; Gill et al., 2020). In contrast, our extended, strong disinhibition assesses network integrity and health by evaluating its capacity for sustained spiking activity. Moreover, the protocol of data analysis presented in our study could also easily be applied to earlier or less disinhibited spiking activity.
A primary limitation of this study is the small sample size, comprising glioma-bearing slices from 4 animals and sham-operated slices from 3 animals. While this sample size is sufficient for establishing the feasibility and utility of the proposed HD-MEA methodology and data analysis pipeline, it is a significant constraint on the interpretability of our findings. We propose that our findings serve as a foundation for future, larger-scale studies aimed at conclusively characterizing the effects of F98 gliomas on neocortical network function.
¶ 3.1. Spike sorting
Spike sorting is often considered fundamental for accurate analysis of multi-electrode data, as it enables the assignment of individual spikes to specific neurons (Pachitariu et al., 2024b; Quiroga, 2012; Wu et al., 2025). However, units resulting directly from spike sorting may still contain multi-unit activity and noise. Therefore, if the goal is to analyze SUA only, further processing of the outputs resulting from initial spike sorting is mandatory.
In this study, spike-sorted units with a mean firing rate Hz and a Kilosort4 label of “good” were classified as putative SUA. Spike sorting identified a substantial number of these putative, well-isolated, singleneuron units in most recordings (Fig. 4).
Kilosort family algorithms have been previously applied to in vitro experiments involving brain slices and cell cultures, including those using HD-MEAs (Andrews et al., 2024; Habibey et al., 2022; Zhao et al., 2023). To the best of our knowledge, Kilosort algorithms have, however, not been used for analyzing acute neocortical brain slices. Based on the number of identified SUAs, we conclude that Kilosort4 is well-suited for identifying SUAs from an ex vivo HD-MEA system within a reasonable timeframe (see 2.4), confirming Kilosort4’s scalability to the large number of electrodes of modern MEA systems.
¶ 3.2. Single unit analysis
Well isolated single units were clustered into three clusters using kmeans based on their autocorrelograms, resulting in three distinct groups (Fig. 2). Cluster 1 contained autocorrelograms with the highest immediate post-firing probability. Cluster 2 had a wider range of firing probabilities mostly within , and Cluster 3 displayed no distinct maximum bursting probability within (Fig. 2). The contribution to the clusters did not differ significantly between groups: Mean Std.: Tumor: Cluster 1 , Cluster 2: , Cluster 3: 0.45 $\pm 0 . 1 6 $ . Sham: Cluster 1: , Cluster 2: , Cluster 3: , PERMANOVA).

Fig. 4. Number of well-isolated spike-sorted units. There was no significant difference in the number of well-isolated spike-sorted units between slices from shamoperated and glioma-bearing rats (Mann-Whitney test: ; median sham-operated , median glioma . The whiskers extend to points that lie within 1.5 interquartile ranges of the lower and upper quartiles.
While the neuron subtype can be inferred from firing patterns under specific conditions (Connors and Gutnick, 1990; Jia et al., 2019; Venkadesh et al., 2019), validated data from strongly disinhibited neurons over a prolonged time is currently unavailable.
¶ 3.3. Network burst analysis
¶ 3.3.1. NB duration and rate
Mean NB duration was significantly longer in slices from shamoperated controls compared to slices from glioma-bearing animals (median of sham-operated: versus glioma s versus , Mann-Whitney test, Fig. 5A).
However, no significant difference in NB rates was observed between both groups (sham-operated: versus glioma: , , Mann-Whitney test).
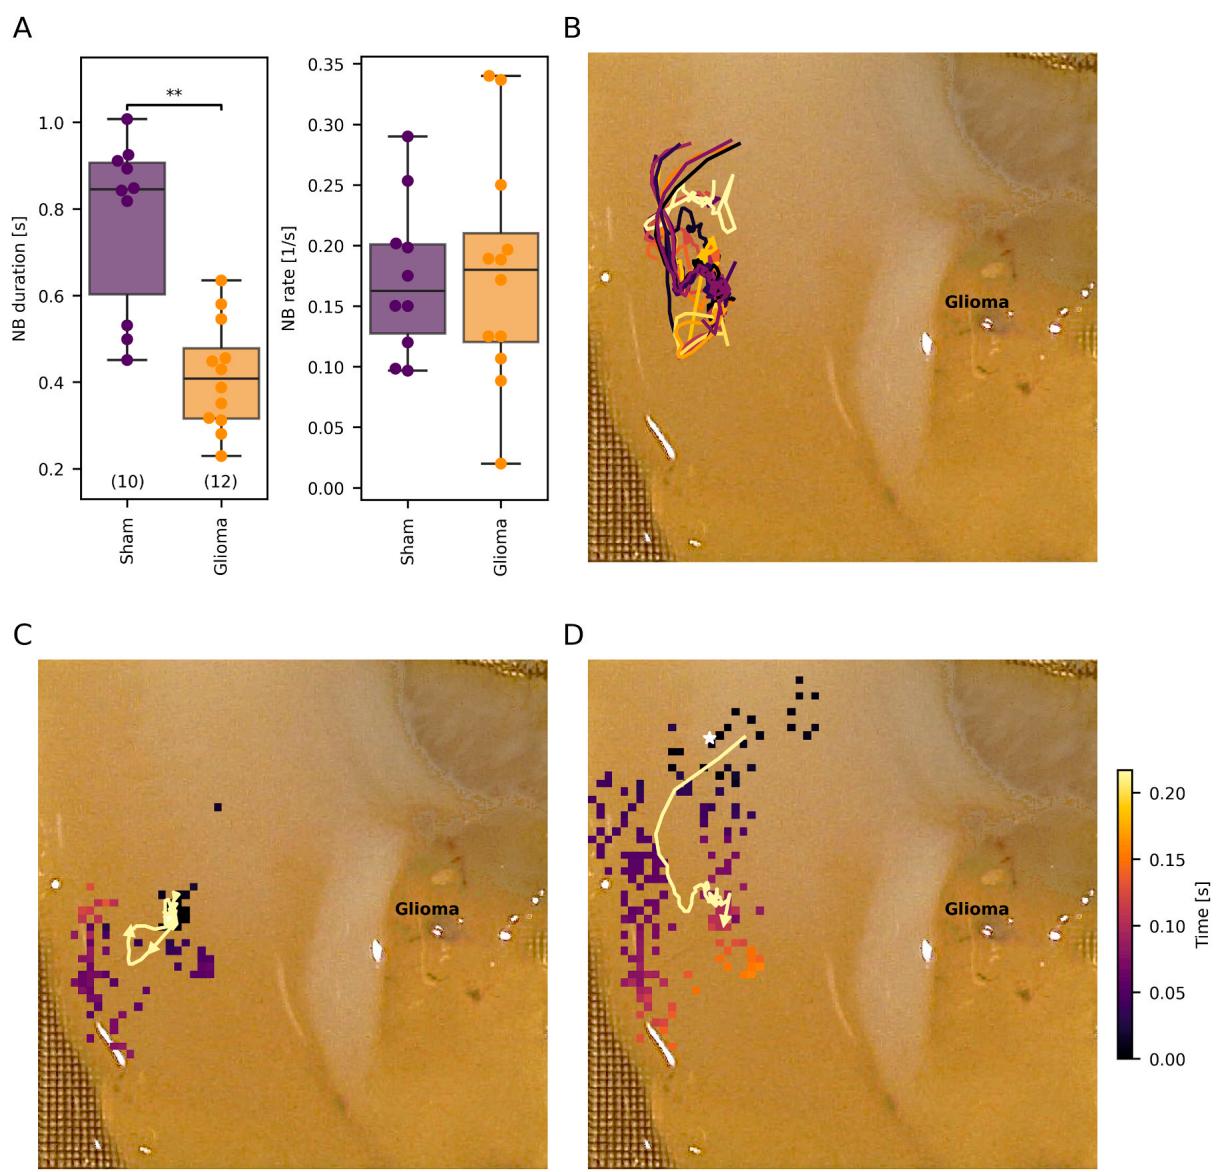
Fig. 5. Network burst (NB) metrics and center of activity trajectories. (A) Boxplots for NB duration and rate (same whisker definition as in Fig. 4). (B) Exemplary center of activity trajectories projected onto the slice. © Visualization of a localized NB event propagating through a small part of the slice. (D) A larger NB, with superimposed center of activity trajectories. Colored squares indicate the burst start time, and white stars mark the estimated origins of the NBs.
No notable changes in these metrics were observed throughout the 10-minute recording period (Supplementary Table 2).
Other studies have shown an increased frequency of epileptiform events in glioma-surrounding tissue. However, these studies investigated disinhibition earlier than it was done in our experiments, and, in addition, used only a low/zero-Magnesium-based disinhibition model (Campbell et al., 2012; Gill et al., 2022, 2020). In contrast, our model uses sustained and more effective disinhibition, therefore providing information on a network’s resources for extended activity, rather than immediate hyperexcitability, as extended spiking activity can lead to cell death (Kovac et al., 2012). This may explain why our model did not show a difference in the NB rate between glioma-bearing and sham-operated slices, in contrast to references (Campbell et al., 2012; Gill et al., 2022, 2020) that described an increased rate of epileptiform activity in glioma-bearing brain tissue.
¶ 3.3.2. Propagation patterns of network bursts
To assess NB propagation within slices, we calculated the origin of each NB and then tracked the movement of the center of highest activity throughout its duration calculating the center-of-activity trajectory (Fig. 5B).
Estimated origins varied substantially among NBs, yet no NB originated near the top of the slices in layer 1. There was no specific preference for any other histological layer (Supplementary Figure 4) or a specific distance from the glioma. Although bursting activity was detected in all areas of the slices with presumed good contact to the MEA system (Fig. 2A), some NBs remained restricted to smaller regions (Fig. 2C). Given the variability in NB origins, it was expected and confirmed that the trajectories of the centers of activity also vary.
Pallud et al. (2014) described interictal discharges, defined as field potentials associated with bursts of multi-unit activity, to arise spontaneously and preferentially in layers 3/4 of peritumoral glioma tissue. On the other hand, electrical discharges initiated by the 4-AP model have been described to occur in layers 5/6 (Rheims et al., 2008). Epileptiform activity induced by the zero-magnesium model has been reported to emerge in all layers but to be stable within each recording (Tsau et al., 1999). It was therefore to be expected that our study, which combines the presence of a glioma and disinhibition conditions (4-AP, high potassium, and zero-magnesium) with a long preincubation period rather than recording shortly after disinhibition, possesses differential properties.
The primary limitation in analyzing NB origins and trajectories was the variable quality of contact between the slices and the electrodes. Typically, each slice had regions with poor electrode contact. If an NB originated in such a region, its apparent origin would be misidentified as the point where activity first reached a well-connected area of the MEA system.
We attempted to mitigate this issue by securing the slices with a net of parallel wires (Supplementary figure 2), which improved contact via the pressure applied by the wires. We hypothesize that signal quality can be further enhanced in future studies by reducing the distance between the wires, potentially allowing for high-quality recordings consistently from all regions of the slices.
The propagation speed of the NBs did not differ significantly between the two groups but showed a clear trend towards faster activity propagation in slices from sham-operated animals (sham median: $1 0 . 5 1 \ \mathrm { m m } / $ s, glioma median , , Fig. 6E).
To assess for any spatial trends in the occurrence of events relative to the glioma, slices were aligned and all analyzed data were registered to a common coordinate system. No notable spatial trends were observed (Supplementary figure 3 and Supplementary table 1).
¶ 3.4. Functional connectivity analysis
Analyzing solely NB characteristics and individual SUA provides limited insight into network-level neuronal interactions. To investigate these interactions, we constructed functional connectivity graphs using the frequency-independent Spike Time Tiling Coefficient (STTC, (Cutts and Eglen, 2014)). We then compared key graph theory metrics between sham-operated and tumor-bearing slices using the Mann-Whitney test: Networks of sham-operated slices showed significantly higher global efficiency (fold change based on medians: 0.92-fold change versus tumor, ) and average node strength (0.48-fold change, . However, the average clustering coefficient (1.03-fold change, $ { \mathbf { p } } = 0 . 7 6 6 7 ,$ ) and modularity score (0.93-fold change, did not differ significantly (Fig. 6). Thus, slices from sham-operated animals exhibited a significantly more integrated and efficient network topology.
Our network analysis revealed a significant disruption of functional connectivity in glioma-bearing slices. The lower global efficiency in tumor slices suggests a functionally weaker connected network state. The decrease in node strength indicates that neurons in glioma slices had a weaker tendency to form tightly knit local functional groups and exhibited weaker or less temporal correlations in their firing patterns.
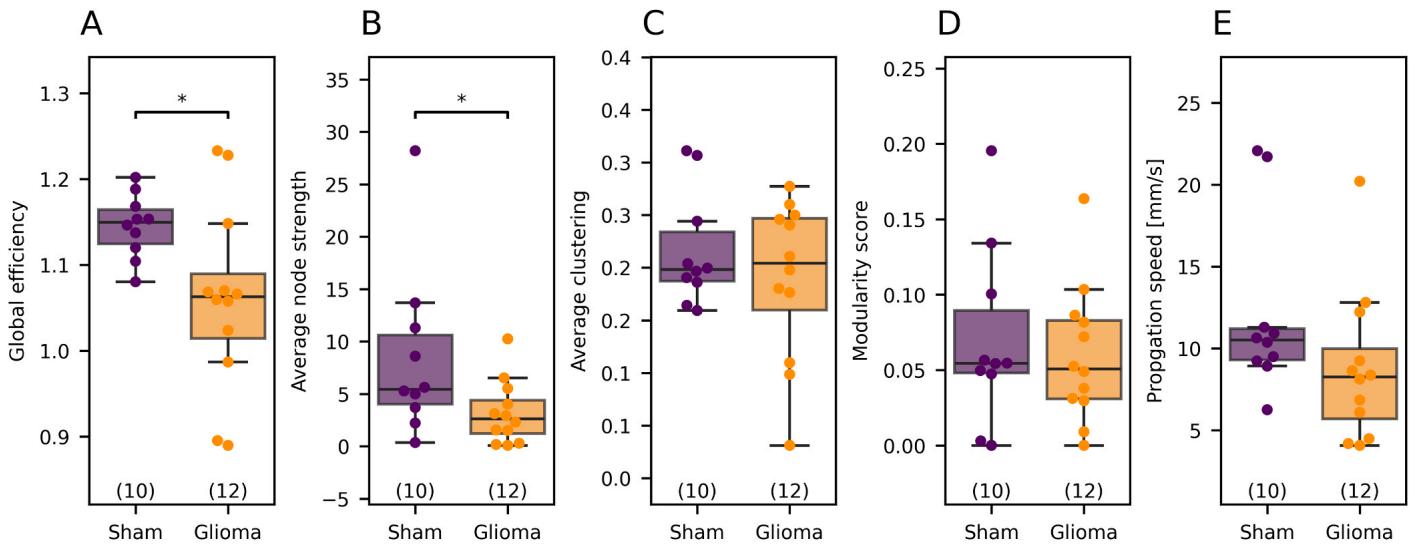
Fig. 6. Graph-based metrics derived from STTC values and propagation speed. (A) Sham networks showed significantly higher global efficiency and (B) average node strength . However, © the average clustering coefficient and (D) modularity score did not differ significantly. (E) The propagation speed does not differ significantly , however, there was a strong trend towards a lower propagation speed for gliomabearing slices. The whiskers extend to points that lie within 1.5 interquartile ranges of the lower and upper quartiles. p-values refer to Mann-Whitney U-test.
A potential contribution to the functionally weaker connected networks in glioma-bearing slices as well as the shorter NBs is the highly infiltrative nature of the F98 glioma model. This glioma is known to invade contiguous brain tissue, forming isolated “islands” and perivascular clusters of tumor cells (Mathieu et al., 2007; Sahu et al., 2022) that may physically disrupt established synaptic connections and circuit integrity. This physical disruption would logically lead to less efficient global integration (lower efficiency).
¶ 4. Conclusion
This study developed a robust protocol using a high-density multielectrode array to investigate glioma-induced alterations in network excitability and activity propagation in acute rat brain slices. The protocol included glioma cell implantation, brain slice preparation, and detailed data analysis focusing on network bursts (NBs). We identified NBs using Kilosort4 for spike sorting, observing shorter durations in glioma-bearing slices compared to sham-operated controls. We also determined origins, trajectories, and propagation speeds of NBs. Analysis of spike time tiling coefficient (STTC)-based functional connectivity graphs revealed distinct network-level interactions between the two groups. This protocol provides a reliable platform for future studies aiming to analyze NBs and functional connectivity in brain slices.
¶ CRediT authorship contribution statement
Falko Lange: Writing – review & editing, Conceptualization. Rüdiger Kohling: ¨ Writing – review & editing. Timo Kirschstein: Writing – review & editing, Supervision, Conceptualization. Fabiana Santana Kragelund: Writing – review & editing, Investigation. Ferdinand Forberger: Writing – original draft, Visualization, Validation, Software, Methodology, Investigation, Formal analysis, Data curation. Katrin Porath: Writing – review & editing, Investigation.
¶ Funding
This research did not receive any specific grant from funding agencies in the public, commercial, or not-for-profit sectors.
¶ Declaration of Competing Interest
The authors declare no conflicts of interest.
¶ Acknowledgements
The authors wish to thank Silke Birkmann, Hanka Schmidt and Simone Rackow for excellent technical assistance.
¶ Appendix A. Supporting information
Supplementary data associated with this article can be found in the online version at doi:10.1016/j.jneumeth.2025.110623. All python code will be available at https://github.com/Ferdinan d23457/HD_MEA_IPHYS_Rostock.
¶ Data availability
Data will be made available on request.
¶ References
Amidei, C., Kushner, D.S., 2015. Clinical implications of motor deficits related to brain tumors†. Neuro-Oncol. Pract. 2, 179–184. https://doi.org/10.1093/nop/npv017.
Andrews, J.P., Geng, J., Voitiuk, K., Elliott, M.A.T., Shin, D., Robbins, A., Spaeth, A., Wang, A., Li, L., Solis, D., Keefe, M.G., Sevetson, J.L., Rivera de Jesús, J.A., Donohue, K.C., Larson, H.H., Ehrlich, D., Auguste, K.I., Salama, S., Sohal, V., Sharf, T., Haussler, D., Cadwell, C.R., Schaffer, D.V., Chang, E.F., Teodorescu, M., Nowakowski, T.J., 2024. Multimodal evaluation of network activity and optogenetic interventions in human hippocampal slices. Nat. Neurosci. 27, 2487–2499. https:// doi.org/10.1038/s41593-024-01782-5.
Barron, T., Yalçın, B., Su, M., Byun, Y.G., Gavish, A., Shamardani, K., Xu, H., Ni, L., Soni, N., Mehta, V., Maleki Jahan, S., Kim, Y.S., Taylor, K.R., Keough, M.B., Quezada, M.A., Geraghty, A.C., Mancusi, R., Vo, L.T., Castaneda, ˜ E.H., Woo, P.J., Petritsch, C.K., Vogel, H., Kaila, K., Monje, M., 2025. GABAergic neuron-to-glioma synapses in diffuse midline gliomas. Nature 639, 1060–1068. https://doi.org/ 10.1038/s41586-024-08579-3.
Barth, R.F., Kaur, B., 2009. Rat brain tumor models in experimental neuro-oncology: the C6, 9L, T9, RG2, F98, BT4C, RT-2 and CNS-1 gliomas. J. Neurooncol. 94, 299–312. https://doi.org/10.1007/s11060-009-9875-7.
Biasibetti, E., Valazza, A., Capucchio, M.T., Annovazzi, L., Battaglia, L., Chirio, D., Gallarate, M., Mellai, M., Muntoni, E., Peira, E., Riganti, C., Schiffer, D., Panciani, P., Lanotte, M., 2017. Comparison of allogeneic and syngeneic rat glioma models by using MRI and histopathologic evaluation. Comp. Med. 67, 147–156.
Buccino, A.P., Hurwitz, C.L., Garcia, S., Magland, J., Siegle, J.H., Hurwitz, R., Hennig, M. H., 2020. SpikeInterface, a unified framework for spike sorting. eLife 9, e61834. https://doi.org/10.7554/eLife.61834.
Campbell, S.L., Buckingham, S.C., Sontheimer, H., 2012. Human glioma cells induce hyperexcitability in cortical networks. Epilepsia 53, 1360–1370. https://doi.org/ 10.1111/j.1528-1167.2012.03557.x.
Chao, Z.C., Bakkum, D.J., Potter, S.M., 2007. Region-specific network plasticity in simulated and living cortical networks: comparison of the center of activity trajectory (CAT) with other statistics. J. Neural Eng. 4, 294–308. https://doi.org/ 10.1088/1741-2560/4/3/015.
Codadu, N.K., Graham, R.T., Burman, R.J., Jackson-Taylor, R.T., Raimondo, J.V., Trevelyan, A.J., Parrish, R.R., 2019. Divergent paths to seizure-like events. Physiol. Rep. 7. https://doi.org/10.14814/phy2.14226.
Connors, B.W., Gutnick, M.J., 1990. Intrinsic firing patterns of diverse neocortical neurons. Trends Neurosci. 13, 99–104. https://doi.org/10.1016/0166-2236(90) 90185-d.
Cutts, C.S., Eglen, S.J., 2014. Detecting pairwise correlations in spike trains: an objective comparison of methods and application to the study of retinal waves. J. Neurosci. Off. J. Soc. Neurosci. 34, 14288–14303. https://doi.org/10.1523/JNEUROSCI.2767- 14.2014.
Denker, M., Yegenoglu, A., Grün, S., 2018. Collaborative HPC-enabled workflows on the HBP Collaboratory using the Elephant framework, in: Neuroinformatics, 2018, p. P19. https://doi.org/10.12751/incf.ni2018.0019.
Drexler, R., Drinnenberg, A., Gavish, A., Yalçin, B., Shamardani, K., Rogers, A.E., Mancusi, R., Trivedi, V., Taylor, K.R., Kim, Y.S., Woo, P.J., Soni, N., Su, M., Ravel, A., Tatlock, E., Midler, A., Wu, S.H., Ramakrishnan, C., Chen, R., Ayala-Sarmiento, A.E., Pacheco, D.R.F., Siverts, L., Daigle, T.L., Tasic, B., Zeng, H., Breunig, J.J., Deisseroth, K., Monje, M., 2025. Cholinergic neuronal activity promotes diffuse midline glioma growth through muscarinic signaling. Cell 0. https://doi.org/ 10.1016/j.cell.2025.05.031.
Emery, B.A., Hu, X., Klütsch, D., Khanzada, S., Larsson, L., Dumitru, I., Fris´en, J., Lundeberg, J., Kempermann, G., Amin, H., 2025. MEA-seqX: high-resolution profiling of large-scale electrophysiological and transcriptional network dynamics. Adv. Sci. Weinh. Baden. Wurtt. Ger. 12, e2412373. https://doi.org/10.1002/ advs.202412373.
Forberger, F., Santana Kragelund, F., Porath, K., Kohling, ¨ R., Kirschstein, T., Lange, F., 2025. Cenobamate reduces epileptiform activity in the ex vivo F98 rat glioma model. Front. Neurosci. 19, 1629259. https://doi.org/10.3389/fnins.2025.1629259.
Chapter 9 - Modularity. In: Fornito, A., Zalesky, A., Bullmore, E.T. (Eds.), 2016b. Fundamentals of Brain Network Analysis. Academic Press, San Diego, pp. 303–354. https://doi.org/10.1016/B978-0-12-407908-3.00009-1.
Chapter 4 - Node degree and strength. In: Fornito, A., Zalesky, A., Bullmore, E.T. (Eds.), 2016a. Fundamentals of Brain Network Analysis. Academic Press, San Diego, pp. 115–136. https://doi.org/10.1016/B978-0-12-407908-3.00004-2.
Ghadimi, K., Abbas, I., Karandish, A., Crisman, C., Eskandar, E.N., Kobets, A.J., 2025. Cognitive decline in glioblastoma (GB) patients with different treatment modalities and insights on untreated cases. Curr. Oncol. 32, 152. https://doi.org/10.3390/ curroncol32030152.
Gill, B.J.A., Wu, X., Khan, F.A., Sosunov, A.A., Liou, J.-Y., Dovas, A., Eissa, T.L., Banu, M. A., Bateman, L.M., McKhann, G.M., Canoll, P., Schevon, C., 2020. Ex vivo multielectrode analysis reveals spatiotemporal dynamics of ictal behavior at the infiltrated margin of glioma. Neurobiol. Dis. 134, 104676. https://doi.org/10.1016/ j.nbd.2019.104676.
Gill, B.J.A., Khan, F.A., Goldberg, A.R., Merricks, E.M., Wu, X., Sosunov, A.A., Sudhakar, T.D., Dovas, A., Lado, W., Michalak, A.J., Teoh, J.J., Liou, J., Frankel, W. N., McKhann, G.M., Canoll, P., Schevon, C.A., 2022. Single unit analysis and widefield imaging reveal alterations in excitatory and inhibitory neurons in glioma. Brain 145, 3666–3680. https://doi.org/10.1093/brain/awac168.
Gloor, G.B., Macklaim, J.M., Pawlowsky-Glahn, V., Egozcue, J.J., 2017. Microbiome datasets are compositional: and this is not optional. Front. Microbiol 8, 2224. https://doi.org/10.3389/fmicb.2017.02224.
Guo, X., Gu, L., Li, Y., Zheng, Z., Chen, W., Wang, Yaning, Wang, Yuekun, Xing, H., Shi, Y., Liu, D., Yang, T., Xia, Y., Li, J., Wu, J., Zhang, K., Liang, T., Wang, H., Liu, Q., Jin, S., Qu, T., Guo, S., Li, H., Wang, Yu, Ma, W., 2023. Histological and molecular glioblastoma, IDH-wildtype: a real-world landscape using the 2021 WHO classification of central nervous system tumors. Front. Oncol. 13. https://doi.org/ 10.3389/fonc.2023.1200815.
Habibey, R., Striebel, J., Schmieder, F., Czarske, J., Busskamp, V., 2022. Long-term morphological and functional dynamics of human stem cell-derived neuronal networks on high-density micro-electrode arrays. Front. Neurosci. 16, 951964. https://doi.org/10.3389/fnins.2022.951964.
Harwood, D.S.L., Pedersen, V., Bager, N.S., Schmidt, A.Y., Stannius, T.O., Areˇskeviˇciut ¯ e, ˙ A., Josefsen, K., Nørøxe, D.S., Scheie, D., Rostalski, H., Lü, M.J.S., Locallo, A., Lassen, U., Bagger, F.O., Weischenfeldt, J., Heiland, D.H., VittingSeerup, K., Michaelsen, S.R., Kristensen, B.W., 2024. Glioblastoma cells increase expression of notch signaling and synaptic genes within infiltrated brain tissue. Nat. Commun. 15, 7857. https://doi.org/10.1038/s41467-024-52167-y.
Hatcher, A., Yu, K., Meyer, J., Aiba, I., Deneen, B., Noebels, J.L., 2020. Pathogenesis of peritumoral hyperexcitability in an immunocompetent CRISPR-based glioblastoma model. J. Clin. Invest 130, 2286–2300. https://doi.org/10.1172/JCI133316.
Huang-Hobbs, E., Cheng, Y.-T., Ko, Y., Luna-Figueroa, E., Lozzi, B., Taylor, K.R., McDonald, M., He, P., Chen, H.-C., Yang, Y., Maleki, E., Lee, Z.-F., Murali, S., Williamson, M.R., Choi, D., Curry, R., Bayley, J., Woo, J., Jalali, A., Monje, M., Noebels, J.L., Harmanci, A.S., Rao, G., Deneen, B., 2023. Remote neuronal activity drives glioma progression through SEMA4F. Nature 619, 844–850. https://doi.org/ 10.1038/s41586-023-06267-2.
Jia, X., Siegle, J.H., Bennett, C., Gale, S.D., Denman, D.J., Koch, C., Olsen, S.R., 2019. High-density extracellular probes reveal dendritic backpropagation and facilitate neuron classification. J. Neurophysiol. 121, 1831–1847. https://doi.org/10.1152/ jn.00680.2018.
Kovac, S., Domijan, A.-M., Walker, M.C., Abramov, A.Y., 2012. Prolonged seizure activity impairs mitochondrial bioenergetics and induces cell death. J. Cell Sci. 125, 1796–1806. https://doi.org/10.1242/jcs.099176.
Kragelund, F.S., Spiliotis, K., Heerdegen, M., Sellmann, T., Bathel, H., Lüttig, A., Richter, A., Starke, J., Kohling, ¨ R., Franz, D., 2025. Network-wide effects of pallidal deep brain stimulation normalised abnormal cerebellar cortical activity in the dystonic animal model. Neurobiol. Dis. 205, 106779. https://doi.org/10.1016/j. nbd.2024.106779.
Lado, W.E., Xu, X., Hablitz, J.J., 2022. Modulation of epileptiform activity by three subgroups of GABAergic interneurons in mouse somatosensory cortex. Epilepsy Res 183, 106937. https://doi.org/10.1016/j.eplepsyres.2022.106937.
Lange, F., Hartung, J., Liebelt, C., Boisser´ee, J., Resch, T., Porath, K., Hornschemeyer, ¨ M. F., Reichart, G., Sellmann, T., Neubert, V., Kriesen, S., Hildebrandt, G., Schültke, E., Kohling, ¨ R., Kirschstein, T., 2020. Perampanel add-on to standard radiochemotherapy in vivo promotes neuroprotection in a rodent F98 glioma model. Front. Neurosci. 14, 598266. https://doi.org/10.3389/fnins.2020.598266.
Lange, F., Hornschemeyer, ¨ J., Kirschstein, T., 2021. Glutamatergic mechanisms in glioblastoma and tumor-associated epilepsy. Cells 10, 1226. https://doi.org/ 10.3390/cells10051226.
Latora, V., Marchiori, M., 2001. Efficient behavior of small-world networks. Phys. Rev. Lett. 87, 198701. https://doi.org/10.1103/PhysRevLett.87.198701.
Li, J., Long, S., Zhang, Y., Wei, W., Yu, S., Liu, Q., Hui, X., Li, X., Wang, Y., 2024. Molecular mechanisms and diagnostic model of glioma-related epilepsy. Npj Precis. Oncol. 8, 223. https://doi.org/10.1038/s41698-024-00721-8.
Liu, J., Qu, C., Han, C., Chen, M.-M., An, L.-J., Zou, W., 2019. Potassium channels and their role in glioma: a mini review. Mol. Membr. Biol. 35, 76–85. https://doi.org/ 10.1080/09687688.2020.1729428.
Mathieu, D., Lecomte, R., Tsanaclis, A.M., Larouche, A., Fortin, D., 2007. Standardization and detailed characterization of the syngeneic Fischer/F98 glioma model. Can. J. Neurol. Sci. J. Can. Sci. Neurol. 34, 296–306. https://doi.org/10.1017/ s0317167100006715.
Mody, I., Lambert, J.D., Heinemann, U., 1987. Low extracellular magnesium induces epileptiform activity and spreading depression in rat hippocampal slices. J. Neurophysiol. 57, 869–888. https://doi.org/10.1152/jn.1987.57.3.869.
Pachitariu, M., Sridhar, S., Pennington, J., Stringer, C., 2024b. Spike sorting with Kilosort4. Nat. Methods 21, 914–921. https://doi.org/10.1038/s41592-024-02232- 7.
Pachitariu, M., Pennington, J., Carsen, S., 2024a. When to adjust default settings — Kilosort4 0.0.1 documentation [WWW Document]. URL 〈https://kilosort.readthe docs.io/en/stable/parameters.html〉 (accessed 7.10.25).
Pallud, J., Le Van Quyen, M., Bielle, F., Pellegrino, C., Varlet, P., Cresto, N., Baulac, M., Duyckaerts, C., Kourdougli, N., Chazal, G., Devaux, B., Rivera, C., Miles, R., Capelle, L., Huberfeld, G., 2014. Cortical GABAergic excitation contributes to epileptic activities around human glioma, 244ra89 Sci. Transl. Med. 6. https://doi. org/10.1126/scitranslmed.3008065.
Quintanilla, C.A., Fitzgerald, Z., Kashow, O., Radojicic, M.S., Ulupinar, E., Bitlis, D., Genc, B., Andjus, P., van Drongelen, W., Ozdinler, P.H., 2025. High-density multielectrode arrays bring cellular resolution to neuronal activity and network analyses of corticospinal motor neurons. Sci. Rep. 15, 732. https://doi.org/10.1038/ s41598-024-83883-6.
Quiroga, R.Q., 2012. Spike sorting. Curr. Biol. 22, R45–R46. https://doi.org/10.1016/j. cub.2011.11.005.
Rheims, S., Represa, A., Ben-Ari, Y., Zilberter, Y., 2008. Layer-specific generation and propagation of seizures in slices of developing neocortex: role of excitatory GABAergic synapses. J. Neurophysiol. 100, 620–628. https://doi.org/10.1152/ jn.90403.2008.
Rideout, J.R., Bolyen, E., McDonald, D., Baeza, Y.V., Alastuey, J.C., Pitman, A., Morton, J., Zhu, Q., Navas, J., Gorlick, K., Aton, M., Debelius, J., Xu, Z., llcooljohn, Shorenstein, J., Luce, L., Treuren, W.V., Chase, J., charudatta-navare, Gonzalez, A., Brislawn, C.J., Patena, W., Schwarzberg, K., teravest, Sfiligoi, I., Reeder, J., Caporaso, G., shiffer1, nbresnick, Tapo, C., 2025. scikit-bio/scikit-bio: scikit-bio 0.7.0. https://doi.org/10.5281/zenodo.15988672.
Sahu, U., Barth, R.F., Otani, Y., McCormack, R., Kaur, B., 2022. Rat and mouse brain tumor models for experimental neuro-oncology research. J. Neuropathol. Exp. Neurol. 81, 312–329. https://doi.org/10.1093/jnen/nlac021.
Samudra, N., Zacharias, T., Plitt, A., Lega, B., Pan, E., 2019. Seizures in glioma patients: an overview of incidence, etiology, and therapies. J. Neurol. Sci. 404, 80–85. https://doi.org/10.1016/j.jns.2019.07.026.
Stupp, R., Mason, W.P., van den Bent, M.J., Weller, M., Fisher, B., Taphoorn, M.J.B., Belanger, K., Brandes, A.A., Marosi, C., Bogdahn, U., Curschmann, J., Janzer, R.C., Ludwin, S.K., Gorlia, T., Allgeier, A., Lacombe, D., Cairncross, J.G., Eisenhauer, E., Mirimanoff, R.O., European Organisation for Research and Treatment of Cancer Brain Tumor and Radiotherapy Groups, National Cancer Institute of Canada Clinical Trials Group, 2005. Radiotherapy plus concomitant and adjuvant temozolomide for glioblastoma. N. Engl. J. Med. 352, 987–996. https://doi.org/10.1056/NEJ Moa043330.
Tantillo, E., Vannini, E., Cerri, C., Spalletti, C., Colistra, A., Mazzanti, C.M., Costa, M., Caleo, M., 2020. Differential roles of pyramidal and fast-spiking, GABAergic neurons in the control of glioma cell proliferation. Neurobiol. Dis. 141, 104942. https://doi. org/10.1016/j.nbd.2020.104942.
Taylor, K.R., Barron, T., Hui, A., Spitzer, A., Yalçin, B., Ivec, A.E., Geraghty, A.C., Hartmann, G.G., Arzt, M., Gillespie, S.M., Kim, Y.S., Maleki Jahan, S., Zhang, H., Shamardani, K., Su, M., Ni, L., Du, P.P., Woo, P.J., Silva-Torres, A., Venkatesh, H.S., Mancusi, R., Ponnuswami, A., Mulinyawe, S., Keough, M.B., Chau, I., Aziz-Bose, R., Tirosh, I., Suv`a, M.L., Monje, M., 2023. Glioma synapses recruit mechanisms of adaptive plasticity. Nature 623, 366–374. https://doi.org/10.1038/s41586-023- 06678-1.
Tsau, Y., Guan, L., Wu, J.-Y., 1999. Epileptiform activity can be initiated in various neocortical layers: an optical imaging study. J. Neurophysiol. 82, 1965–1973. https://doi.org/10.1152/jn.1999.82.4.1965.
Venkadesh, S., Komendantov, A.O., Wheeler, D.W., Hamilton, D.J., Ascoli, G.A., 2019. Simple models of quantitative firing phenotypes in hippocampal neurons: comprehensive coverage of intrinsic diversity. PLoS Comput. Biol. 15, e1007462. https://doi.org/10.1371/journal.pcbi.1007462.
Venkataramani, V., Tanev, D.I., Strahle, C., Studier-Fischer, A., Fankhauser, L., Kessler, T., Korber, ¨ C., Kardorff, M., Ratliff, M., Xie, R., Horstmann, H., Messer, M., Paik, S.P., Knabbe, J., Sahm, F., Kurz, F.T., Acikgoz, ¨ A.A., Herrmannsdorfer, ¨ F., Agarwal, A., Bergles, D.E., Chalmers, A., Miletic, H., Turcan, S., Mawrin, C., H¨anggi, D., Liu, H.-K., Wick, W., Winkler, F., Kuner, T., 2019. Glutamatergic synaptic input to glioma cells drives brain tumour progression. Nature 573, 532–538. https://doi.org/10.1038/s41586-019-1564-x.
Venkataramani, V., Yang, Y., Schubert, M.C., Reyhan, E., Tetzlaff, S.K., Wißmann, N., Botz, M., Soyka, S.J., Beretta, C.A., Pramatarov, R.L., Fankhauser, L., Garofano, L., Freudenberg, A., Wagner, J., Tanev, D.I., Ratliff, M., Xie, R., Kessler, T., Hoffmann, D.C., Hai, L., Dorflinger, ¨ Y., Hoppe, S., Yabo, Y.A., Golebiewska, A., Niclou, S.P., Sahm, F., Lasorella, A., Slowik, M., Doring, ¨ L., Iavarone, A., Wick, W., Kuner, T., Winkler, F., 2022. Glioblastoma hijacks neuronal mechanisms for brain invasion. Cell 185, 2899–2917.e31. https://doi.org/10.1016/j.cell.2022.06.054.
Venkatesh, H.S., Johung, T.B., Caretti, V., Noll, A., Tang, Y., Nagaraja, S., Gibson, E.M., Mount, C.W., Polepalli, J., Mitra, S.S., Woo, P.J., Malenka, R.C., Vogel, H., Bredel, M., Mallick, P., Monje, M., 2015. Neuronal activity promotes glioma growth through neuroligin-3 secretion. Cell 161, 803–816. https://doi.org/10.1016/j. cell.2015.04.012.
Venkatesh, H.S., Tam, L.T., Woo, P.J., Lennon, J., Nagaraja, S., Gillespie, S.M., Ni, J., Duveau, D.Y., Morris, P.J., Zhao, J.J., Thomas, C.J., Monje, M., 2017. Targeting neuronal activity-regulated neuroligin-3 dependency in high-grade glioma. Nature 549, 533–537. https://doi.org/10.1038/nature24014.
Wang, Y., Jiang, T., 2013. Understanding high grade glioma: molecular mechanism, therapy and comprehensive management. Cancer Lett. 331, 139–146. https://doi. org/10.1016/j.canlet.2012.12.024.
Watts, D.J., Strogatz, S.H., 1998. Collective dynamics of ‘small-world’ networks. Nature 393, 440–442. https://doi.org/10.1038/30918.
Wu, E.G., Rudzite, A.M., Bohlen, M.O., Li, P.H., Kling, A., Cooler, S., Rhoades, C., Brackbill, N., Gogliettino, A.R., Shah, N.P., Madugula, S.S., Sher, A., Litke, A.M., Field, G.D., Chichilnisky, E.J., 2025. Decomposition of retinal ganglion cell electrical images for cell type and functional inference. J. Neural Eng. 22, 046007. https://doi. org/10.1088/1741-2552/ade344.
Zhao, E.T., Hull, J.M., Mintz Hemed, N., Ulus¸ an, H., Bartram, J., Zhang, A., Wang, P., Pham, A., Ronchi, S., Huguenard, J.R., Hierlemann, A., Melosh, N.A., 2023. A CMOSbased highly scalable flexible neural electrode interface. Sci. Adv. 9, eadf9524. https://doi.org/10.1126/sciadv.adf9524.