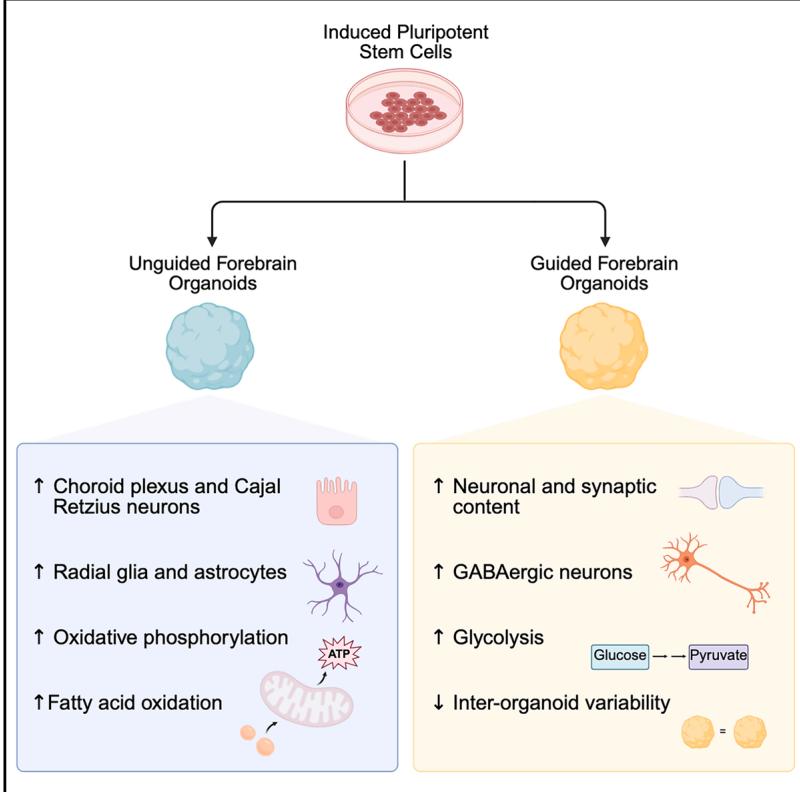
¶ Multi-omic analysis of guided and unguided forebrain organoids reveals differences in cellular composition and metabolic profiles
¶ Graphical abstract
¶ Authors
Marie Sejberg Øhlenschlæger, Pia Jensen, Jesper Foged Havelund, …, Madeline A. Lancaster, Martin Røssel Larsen, Helle Bogetofte
Correspondence
hbogetofte@bmb.sdu.dk
¶ In brief
Øhlenschlæger et al. perform a multiomic analysis of forebrain organoids generated by two key methods, guided and unguided differentiation. They document significant differences in the cell type composition and metabolic profiles of the two forebrain organoid types, providing a resource and methodological guide for the neural organoid field.
¶ Highlights
• We present a broad multi-omic analysis of guided and unguided forebrain organoids
• We demonstrate significant differences in neuronal and glial cell type compositions
• Guided and unguided forebrain organoids have different metabolic profiles
• Modeling of disease-relevant phenotypes may be influenced by choice of organoid method
¶ Cell reports Methods
¶ Resource Multi-omic analysis of guided and unguided forebrain organoids reveals differences in cellular composition and metabolic profiles
Marie Sejberg Øhlenschlæger,1 Pia Jensen,1 Jesper Foged Havelund,1 Sissel Ida Schmidt,1
Fadumo Abdullahi Mohamed,2 Magdalena Sutcliffe,3 Sofie Blomberg Elmkvist,1 Lucrezia Criscuolo,1 Steven W. Wingett,3 Ilaria Chiaradia,3 Elif Bayram,4,5 Jeppe Allen Abildsten Nicolaisen,1 Lene Andrup Jakobsen,1 Jonathan Brewer,6 Michael Eriksen Benros,4,5 Kristine Freude,2 Nils Joakim Færgeman,1 Madeline A. Lancaster,3 Martin Røssel Larsen,1 and Helle Bogetofte1,7, *
1 Department of Biochemistry and Molecular Biology, University of Southern Denmark, 5230 Odense M, Denmark
2 Department for Veterinary and Animal Science, Faculty of Health and Medical Sciences, University of Copenhagen, 1870 Frederiksberg C, Denmark
3 MRC Laboratory of Molecular Biology, Cambridge Biomedical Campus, Cambridge CB2 0QH, UK
4 Department of Clinical Medicine, Faculty of Health and Medical Sciences, University of Copenhagen, 2200 Copenhagen N, Denmark
5 Copenhagen Research Centre for Biological and Precision Psychiatry, Mental Health Centre Copenhagen, Copenhagen University Hospital, 2900 Hellerup, Denmark
6 DaMBIC, Department of Biochemistry and Molecular Biology, University of Southern Denmark, 5230 Odense M, Denmark
7 Lead contact
*Correspondence: hbogetofte@bmb.sdu.dk
https://doi.org/10.1016/j.crmeth.2025.101295
¶ MOTIVATION
Human forebrain organoids, generated by either guided or unguided differentiation, are important model systems for human brain development. However, the differences arising from the two differentiation approaches are not fully elucidated. To address this, we performed a large-scale multi-omic analysis of guided and unguided forebrain organoids, identifying significant differences in their cellular composition and metabolic activity.
¶ SUMMARY
Neural organoids are invaluable model systems for studying neurodevelopment, generated by either guided or unguided approaches. Despite the importance for the field, the resulting differences between these models are unclear. To obtain an unbiased comparison, we performed a multi-omic analysis of forebrain organoids generated in parallel with two widely applied guided and unguided protocols. The guided forebrain organoids contained a larger proportion of neurons, including GABAergic interneurons, whereas the unguided organoids contained significantly more choroid plexus, radial glia, and astrocytes at later stages. Substantial differences in metabolic profiles were identified, pointing to increased levels of oxidative phosphorylation and fatty acid β-oxidation in the unguided forebrain organoids and a higher reliance on glycolysis in the guided forebrain organoids. Overall, our study comprises a thorough description of the multi-omic differences between these guided and unguided forebrain organoids and provides an important resource for the neural organoid field studying neurodevelopment and disease.
¶ INTRODUCTION
The development of 3D cell culture techniques has greatly advanced the complexity of in vitro models. This has benefited the modeling of neuronal tissue, improving the recapitulation of key cellular events in early brain development.1–3 Neural organoids have been used in studies of developmental disorders4–7 and neurodegenerative diseases.8–10 Since their introduction, a variety of 3D neural organoid protocols have been developed producing an array of models.11–13
Neural organoids can be generated via unguided or guided differentiation. The undirected differentiation technique, introduced as cerebral organoids by Lancaster et al. in 2013,7 relies on the intrinsic ability of pluripotent stem cells (PSCs) to generate neuroectoderm in the absence of extrinsic signals.7,14 The early organoids are embedded in an extracellular matrix (ECM), which supports the formation of neuroepithelial buds that develop into cortical structures.2,7,14 The resulting unguided neural organoids can give rise to various brain region identities and contain, e.g., retinal tissue and non-neural tissue such as the choroid plexus (ChP).1,15 However, further optimization of the protocol has resulted in the reliable generation of cerebral organoids with forebrain identity, which is why we here refer to these organoids as unguided forebrain organoids (FOs). 16
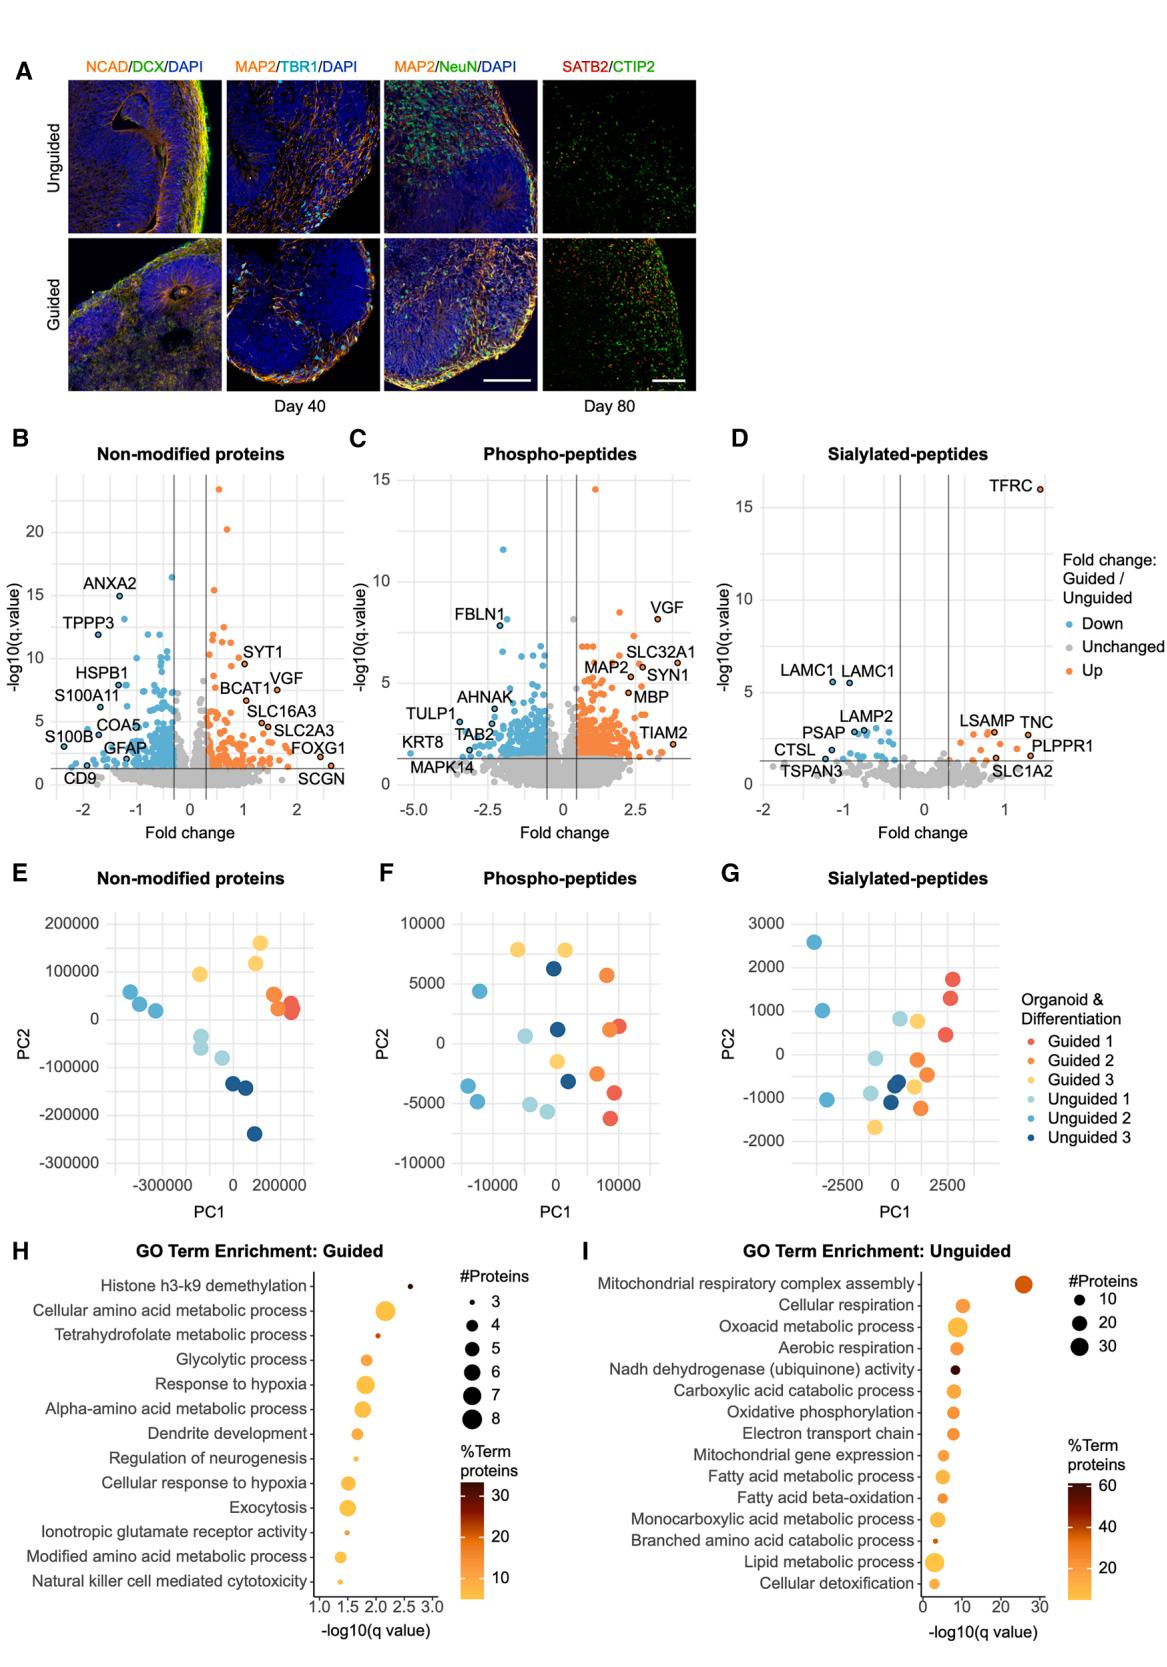
Figure 1. Proteomic/post-translational modification profiles distinguish guided and unguided FOs based on neuronal and metabolic proteins (A) ICC for N-cadherin (NCAD, orange), doublecortin (DCX, green), microtubule-associated protein 2 (MAP2, orange), T-box brain transcription factor 1 (TBR1, cyan), neuronal nuclear protein (NeuN, green), DNA-binding protein SATB2 (red), and CTIP2 (green) of day 40 and 80 FOs with DAPI (dark blue). Scale bars, 100 μm. (B–D) Volcano plots showing the fold change and − log10 (q value) for (B) non-modified proteins, © phospho-peptides, and (D) sialylated N-glycopeptides in day 40 FOs from three differentiations (n = 9 FOs, q ≤ 0.05 and fold change±0.3 considered significant, rank products test). (E–G) PCA on (E) the non-modified proteins, (F) the phospho-peptides, and (G) the sialylated N-glycopeptides in guided (blue) vs. unguided FOs (orange) labeled according to the differentiation (1–3). (H–I) GO term enrichment analysis on non-modified proteins with (H) increased abundance and (I) decreased abundance (q ≤ 0.05, fold change±0.3) in guided vs.unguided FOs. Dot size signifies the number of significantly different proteins, and color indicates their percentage out of total number of pathway proteins (two-sided hypergeometric test with Bonferroni step-down). See also Table S1.
Guided organoid differentiation on the other hand uses small molecules and growth factors to induce regional specification and promote neuronal maturation.17,18 This includes dual SMAD inhibition for neural induction, epidermal growth factor (EGF) and fibroblast growth factor (FGF) for neural expansion, and later brain-derived neurotrophic factor (BDNF) and neurotrophin 3 for maturation in the guided organoid protocol.19 This enables the formation of brain-region specific organoids resembling the dorsal or ventral forebrain, midbrain, or hindbrain.19–22 A commonly used guided protocol is the dorsal FO protocol developed by Pasca et al. in 2015.18,19
The development of commercially available differentiation kits for these specific dorsal forebrain and cerebral organoid protocols have further facilitated their availability and use.
FOs of both types have been shown to resemble fetal brain tissue on the gene expression level,1,18,23 replicate cellular events in cortical plate development, and mimic the timing and architecture of early cortical layer formation.7,14,18
However, our general understanding of the differences arising from different guided and unguided FO protocols is limited as only few studies have included both.24,25
To establish a more informed foundation for the choice of model system and to examine the potential influence of model choice on experimental results, we performed a direct comparison of the two most widely used approaches using a multiomics methodology. The comparison was performed from differentiation day 40 to day 120, intending to detect early differences in trajectories.
The analyses collectively showed increased neuronal content, including GABAergic interneurons, in guided FOs compared to a higher proportion of astrocytes, ChP, and Cajal Retzius neurons26 in unguided FOs. Distinct metabolic profiles were revealed with higher levels of oxidative phosphorylation (OXPHOS) and fatty acid β-oxidation (FAO) in unguided FOs and increased glycolysis reliance in guided FOs. We confirmed these results in FOs generated from schizophrenia (SCZ) patient induced pluripotent stem cells (iPSCs) and age-matched controls (CTLs) and observed different proteomic disease signatures with each FO type.
These results highlight key differences between the outcome of these guided and unguided FO protocols and demonstrate the need for in-depth characterization and comparison of organoid models to enable informed decisions on their applications.
¶ RESULTS
¶ Proteomic analysis identifies differences in expression of neuronal and metabolic proteins
To examine the differences between FOs generated with the guided or unguided approach using commercially available kits from STEMCELL Technologies, we performed both protocols in parallel starting from the same iPSCs (Figure S1A). We initially chose to maintain the guided FOs in static culture, while the unguided FOs were agitated from day 10, as specified in the protocols. The cellular architecture and distribution of key neurodevelopmental markers were overall comparable in guided and unguided FOs at day 40 and day 80 as examined by immunocytochemistry (ICC) (Figure 1A). Despite starting from a lower number of iPSCs per organoid, the unguided FOs were significantly larger than the guided ones (Figures S1A–S1C) with a larger protein content per organoid at day 40 (Figure S1D). Despite the higher variation in the morphology of unguided organoids, we observed no differences in ventricular lengths (Figure S1E). Both protocols result mainly in forebrain specification as demonstrated by expression of forkhead box G1 (FOXG1), an essential transcription factor for forebrain development27 (Figure S1F).
To obtain an unbiased comparison between the guided and unguided FOs, we subjected day 40 FOs from three independent differentiations to large-scale proteomic analysis (n = 9). Using our previously published post-translational modification (PTM) proteomics method,28 we quantified levels of 7,082 proteins, 15,775 phospho-peptides (from 4,238 proteins), and 663 sialylated N-glycopeptides (from 441 proteins) (Figures 1B–1D). Principal-component analysis (PCA) clearly separated the unguided and guided FOs based on the non-modified proteins and, although less concisely, also the PTM peptides (Figures 1E–1G). Levels of 757 proteins, 1,079 phosphopeptides and 44 sialylated N-glycopeptides were significantly different between the guided and unguided FOs, highlighting that the differentiation approach can clearly affect the proteomic outcome (Table S1).
The differentially abundant proteins (DAPs), which were increased in guided FOs, included FOXG1 and other neuronspecific proteins such as synaptotagmin 1 and the neurosecretory protein VGF, whereas the glial markers glial fibrillary acidic protein (GFAP) and S100B were more abundant in unguided FOs (Figure 1B; Tables S1A and S1B). Gene Ontology (GO) term enrichment on increased DAPs in guided FOs accordingly included ‘‘dendrite development,’’ ‘‘regulation of neurogenesis,’’ and ‘‘ionotropic glutamate receptor activity’’ (Figure 1H).
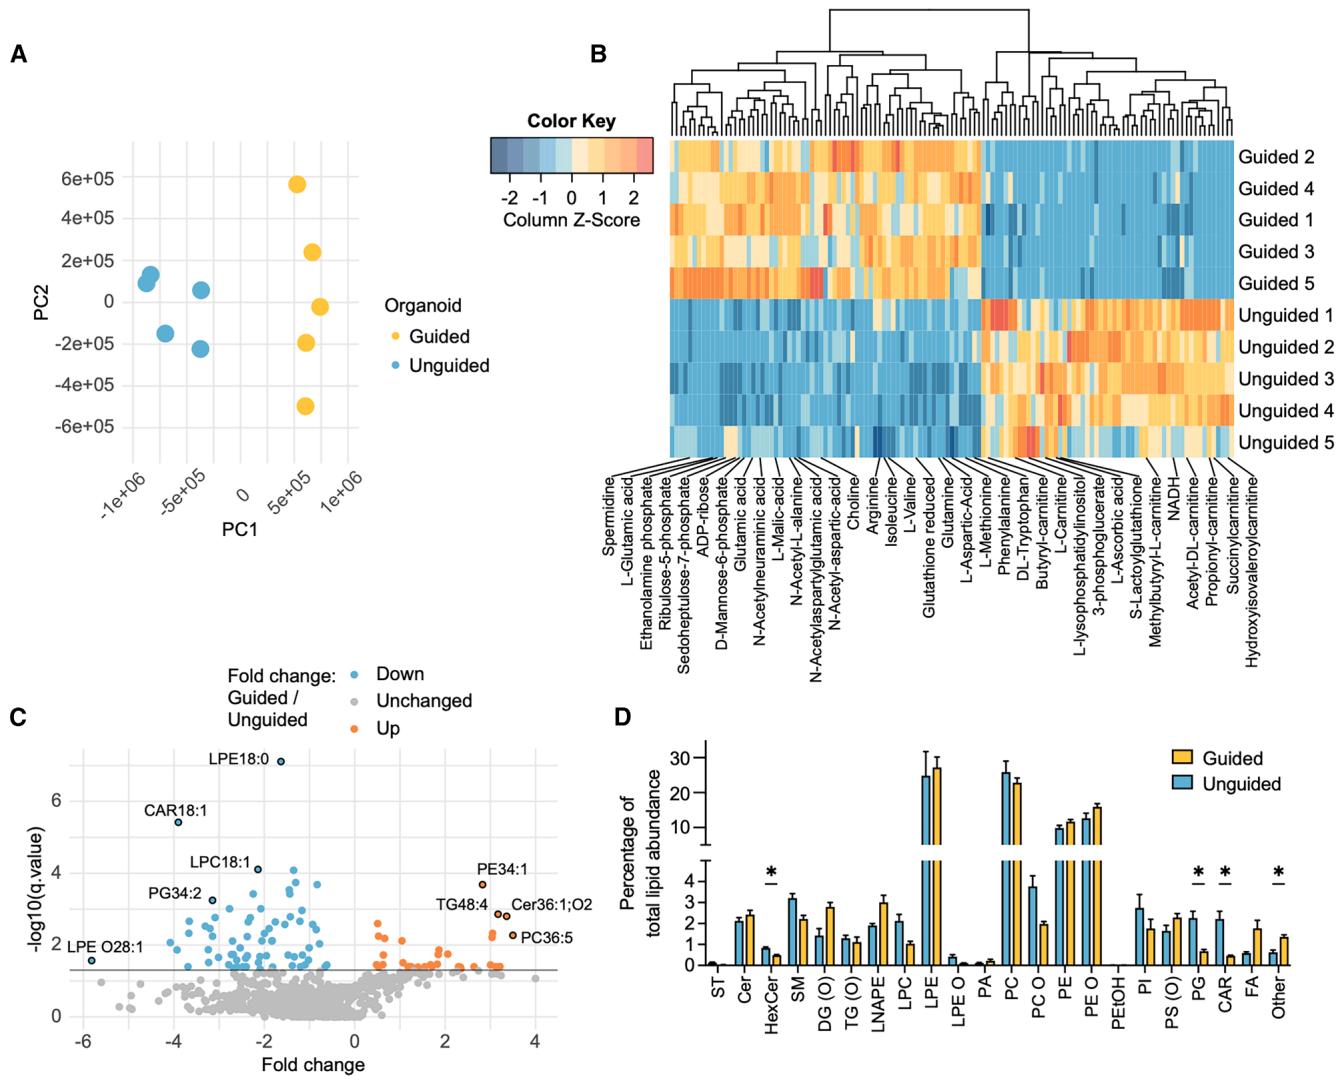
Figure 2. Guided and unguided FOs have different metabolomic/lipidomic profiles
(A) PCA on metabolomic data in guided (blue) vs. unguided (orange) day 40 FOs (n = 5 FOs, one differentiation). (B) Heatmap of significantly different metabolites (q ≤ 0.05) in guided vs. unguided FOs ordered by hierarchical clustering (n = 5 FOs, rank products test). © Volcano plots of lipidomic data showing the fold change and − log10 (q value) of guided vs. unguided FOs (n = 5 FOs, q ≤ 0.05 considered significant, rank products test). (D) Identified and annotated lipids sorted in lipid classes with levels of each lipid class as percentage of total lipid abundance in each organoid. Mean ± SEM (n = 5 FOs, Student’s t test, Benjamini-Hochberg correction). *q ≤ 0.05.
See also Tables S2 and S3.
Numerous neuronal/synaptic proteins including VGF, MAP2, and synapsin 1 (SYN1) had increased phosphorylation levels in guided FOs (Figure 1C; Tables S1C and S1D). Proteins with significantly higher sialylation abundance in guided FOs are related to axogenesis, including LSAMP, a protein that promotes neuronal growth and axon targeting, and SLC1A2, a glutamate transporter in the synaptic cleft (Figure 1D; Tables S1E and S1F).
Surprisingly, GO term enrichment on DAPs, which were increased in unguided FOs, indicated these to be mainly involved in energy metabolism such as ‘‘mitochondrial respiratory complex assembly,’’ ‘‘OXPHOS,’’ and ‘‘FAO’’ (Figure 1I). Correspondingly, ‘‘glycolytic process’’ was enriched in DAPs increased in guided FOs (Figure 1H).
Overall, the proteomic analysis pointed to key differences in abundances and PTMs of neuronal and metabolic proteins between guided and unguided FOs.
¶ Metabolomic and lipidomic profiles differ between the guided and unguided FOs
Given the differences in energy metabolism proteins, we performed metabolomic/lipidomic analysis of five unguided and five guided FOs differentiated from a new batch of iPSCs. From the analysis, 300 metabolites and 794 lipid species were annotated and quantified (Tables S2 and S3). The metabolite profiles clearly separated the guided and unguided FOs on PCA (Figures 2A and 2B). The lipidomic profiles also differed with 35 lipids significantly increased in guided FOs and 68 in unguided FOs (Figure 2C). Four lipid classes showed significant differences with higher percentages of hexocylceramides, phosphatidylglycerols, and carnitines in the unguided FOs and higher percentage mainly of oleamide (in the ‘‘other’’ subgroup) in the guided FOs (Figure 2D; Table S3C). Oleamide is a fatty acid amide, which interacts with cannabinoid receptors and other neurotransmitter systems,29 and can potentially stimulate neurogenesis.30 Hexocylceramides are critical to the structure and function of myelin and enriched in oligodendrocytes.31 Combining the metabolomic/lipidomic analysis of the guided and unguided FOs supported the finding of different metabolic protein expression levels in the FOs.
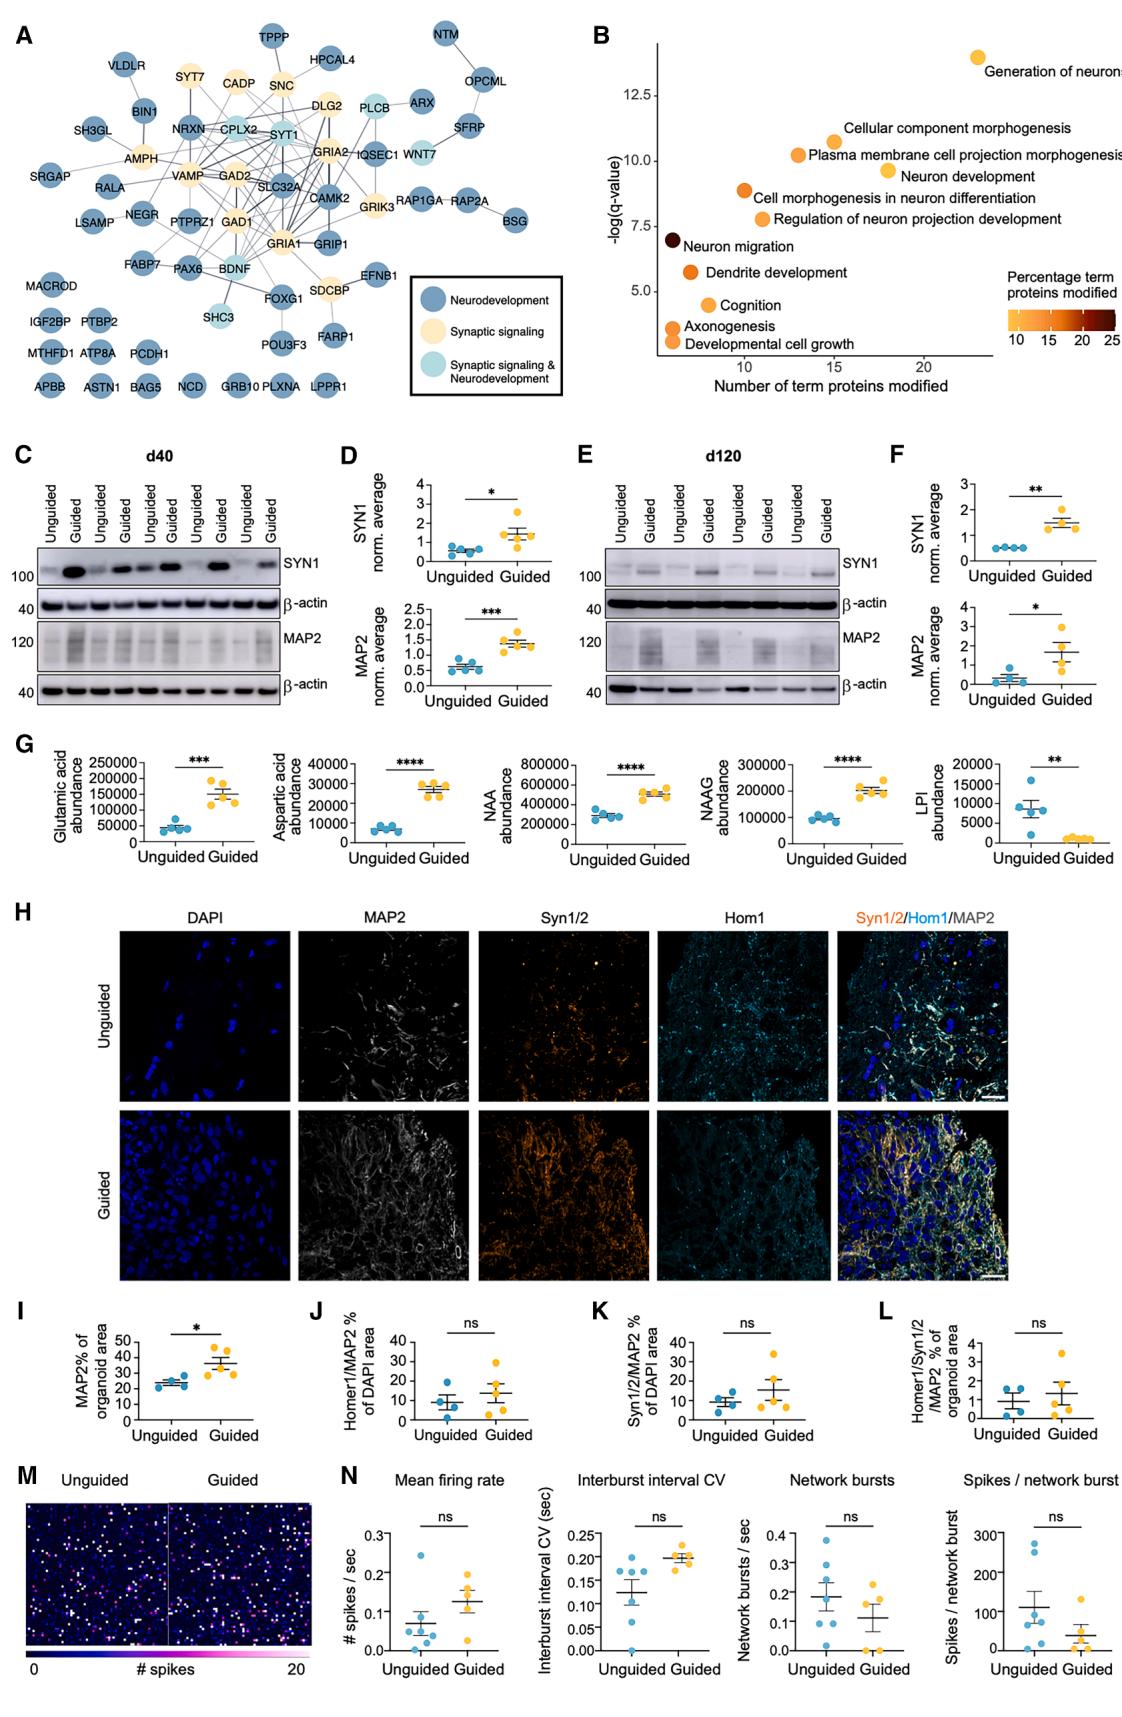
Figure 3. Higher abundance of neuronal and synaptic proteins in early and late-stage guided FOs
(A) String network of significant proteins involved in synaptic signaling and/or neurodevelopment (q ≤ 0.05, fold change±0.3) in guided vs. unguided FOs in the proteomic analysis (n = 9 FOs, from 3 differentiations, rank products test).
(B) GO term enrichment analysis on proteins with significantly increased (q value≤0.05, fold change±0.3) phosphorylation levels in guided vs. unguided FOs, showing the number of significant proteins in each pathway/term. Dot color indicates the percentage these constitute out of total number of pathway proteins (two-sided hypergeometric test, Bonferroni step-down).
(C–F) Representative western blots and quantification of synapsin 1 (SYN1) and microtubule-associated protein 2 (MAP2) levels in (C and D) day 40 and (E and F) day 120 FOs. Protein expression normalized to β-actin and average of all samples in each blot. Mean ± SEM (n = 4–5 FOs, Student’s t test).
(G) Abundance levels of neurotransmitters quantified by metabolomics. NAA, N-acetylaspartate; NAAG, N-acetylaspartylglutamate; LPI, lysophosphatidylinositol. Mean ± SEM (n = 5 FOs, one differentiation, rank products test).
(H–L) ICC of day 80 (H) FOs for DAPI (dark blue), MAP2 (white), Synapsin Syn1/2 (orange), and Homer1 (Hom1, cyan), and quantification of (I) MAP2+, (J) Hom1+/ MAP2+, (K) Syn1/2+/MAP2+, and (L) Syn1/2+/Hom1+/MAP2+ area as percentage of organoid or DAPI area as indicated. Scale bars, 20 μm. Mean ± SEM (n = 4–5 FOs from two differentiations, Student’s t test).
(M and N) MEA recordings from day 120 FOs showing the mean firing rate (spikes/sec), interburst interval coefficient of variance (CV), number of network bursts, and number of spikes per network burst over 2 min. Mean ± SEM (n = 5–6 FOs, from two differentiations, Student’s t test). *p ≤ 0.05, **p ≤ 0.01, ***p ≤ 0.001, ****p ≤ 0.0001.
See also Figure S1.
¶ Increased neuronal content in the guided FOs compared to the unguided FOs
The synapse- and neuronal-related DAPs increased in guided FOs included glutamate receptors (GRIK3 and GRIA2), important proteins in GABA signaling (GAD1, GAD2, and SLC32A), BDNF, and key transcription factors in brain development (FOXG1, PAX6, and POU3F3) (Figure 3A). GO term enrichment of the proteins with increased phosphorylation in the guided FOs further supported enhanced generation of neurons and neuronal projections (Figure 3B). To confirm this, we performed western blotting for SYN1 and MAP2, finding significantly increased levels of both in day 40 guided FOs (Figures 3C and 3D). Interestingly, these differences persisted in day 120 FOs (Figures 3E and 3F). Accordingly, levels of four out of five neurotransmitters identified by the metabolomic analysis, including glutamate (glutamic acid), were significantly increased in the guided FOs (Figure 3G). To evaluate if synaptic contacts were present, we performed ICC for co-localization of the presynaptic protein Synapsin 1/2 (Syn1/2) and the postsynaptic protein Homer1 on MAP2+ processes. At day 40, levels of Syn1/2 and Homer1 appeared similar in both organoid types, and limited punctate co-localization was observed (Figures S1G and S1H). At day 80, total MAP2 levels were significantly increased in guided FOs whereas total Syn1/2 and Homer1 levels and synapse numbers were comparable (Figures 3H, 3L, and S1G). To assess their spontaneous electrophysiological activity, day 100 guided and unguided FOs were placed on multi-electrode array (MEA) chips, where they were cultured for 20 days generating an extended axonal network as seen from the spike activity maps (Figure 3M). In accordance with the similar synapse numbers observed by ICC, MEA recordings on day 120 did not reveal any significant differences between the groups (Figure 3N). Overall, we found substantial evidence for increased neuronal content in the guided FOs both at early and later time points.
¶ Increased radial glia/astrocytic content with cytoplasmic FOXG1 localization in the unguided FOs
Based on the increased levels of GFAP and S100B in unguided FOs, we hypothesized that the increased neuronal content in the guided FOs was at the expense of decreased radial glia (RG) content and perhaps at later stages also decreased astrocyte numbers. ICC indicated sparse GFAP staining at day 40 in both groups (Figure 4A; Figure S1I). However, at day 80, significantly lower GFAP expression was observed in guided FOs (Figures 4B and 4C). This was confirmed by western blotting for GFAP at day 40 (Figures 4D and 4E) and GFAP and S100B at day 120 where a substantial difference was seen (Figures 4F–4H). Surprisingly, the subcellular localization of FOXG1 in GFAP+ cells differed markedly between the two FO types at day 80. In the unguided FOs, FOXG1 co-localized with the cytoplasmic GFAP staining, while in the guided FOs FOXG1 was nuclear (Figure 4B). The cytoplasmic FOXG1 expression was not seen in the neuronal population as identified by MAP2 (Figure 4B), indicating that this transition was specific for the GFAP+ cells. As FOXG1 is nuclear in progenitor cells but cytoplasmic in differentiating cells,32 this might indicate a difference in the differentiation stage of GFAP+ cells. Overall, this indicated a substantial difference in the amount of RG cells at the early time point (day 40), possibly influencing the amount of glial progenitors and astrocytes at later stages (day 80 and 120).
¶ Increased mitochondrial content and OXPHOS proteins in unguided FOs
Perhaps resulting from differences in cellular compositions, the proteomic analysis had identified several energy metabolismrelated DAPs. Numerous TCA cycle, complex I, FAO, and other mitochondrial proteins were found significantly increased in the unguided FOs, while in the guided FOs glycolysis proteins were significantly increased (Figure 5A). Interestingly, the metabolomic analysis identified significantly higher levels of glycolysis/ pentose phosphate pathway (PPP) metabolites in the guided FOs (Figure 5B). Corresponding with the increase in FAO proteins, the unguided FOs had significantly elevated levels of various carnitines (Figures 2B and 5B). The main function of carnitines is to transfer long-chain fatty acids to mitochondria for β-oxidation.33
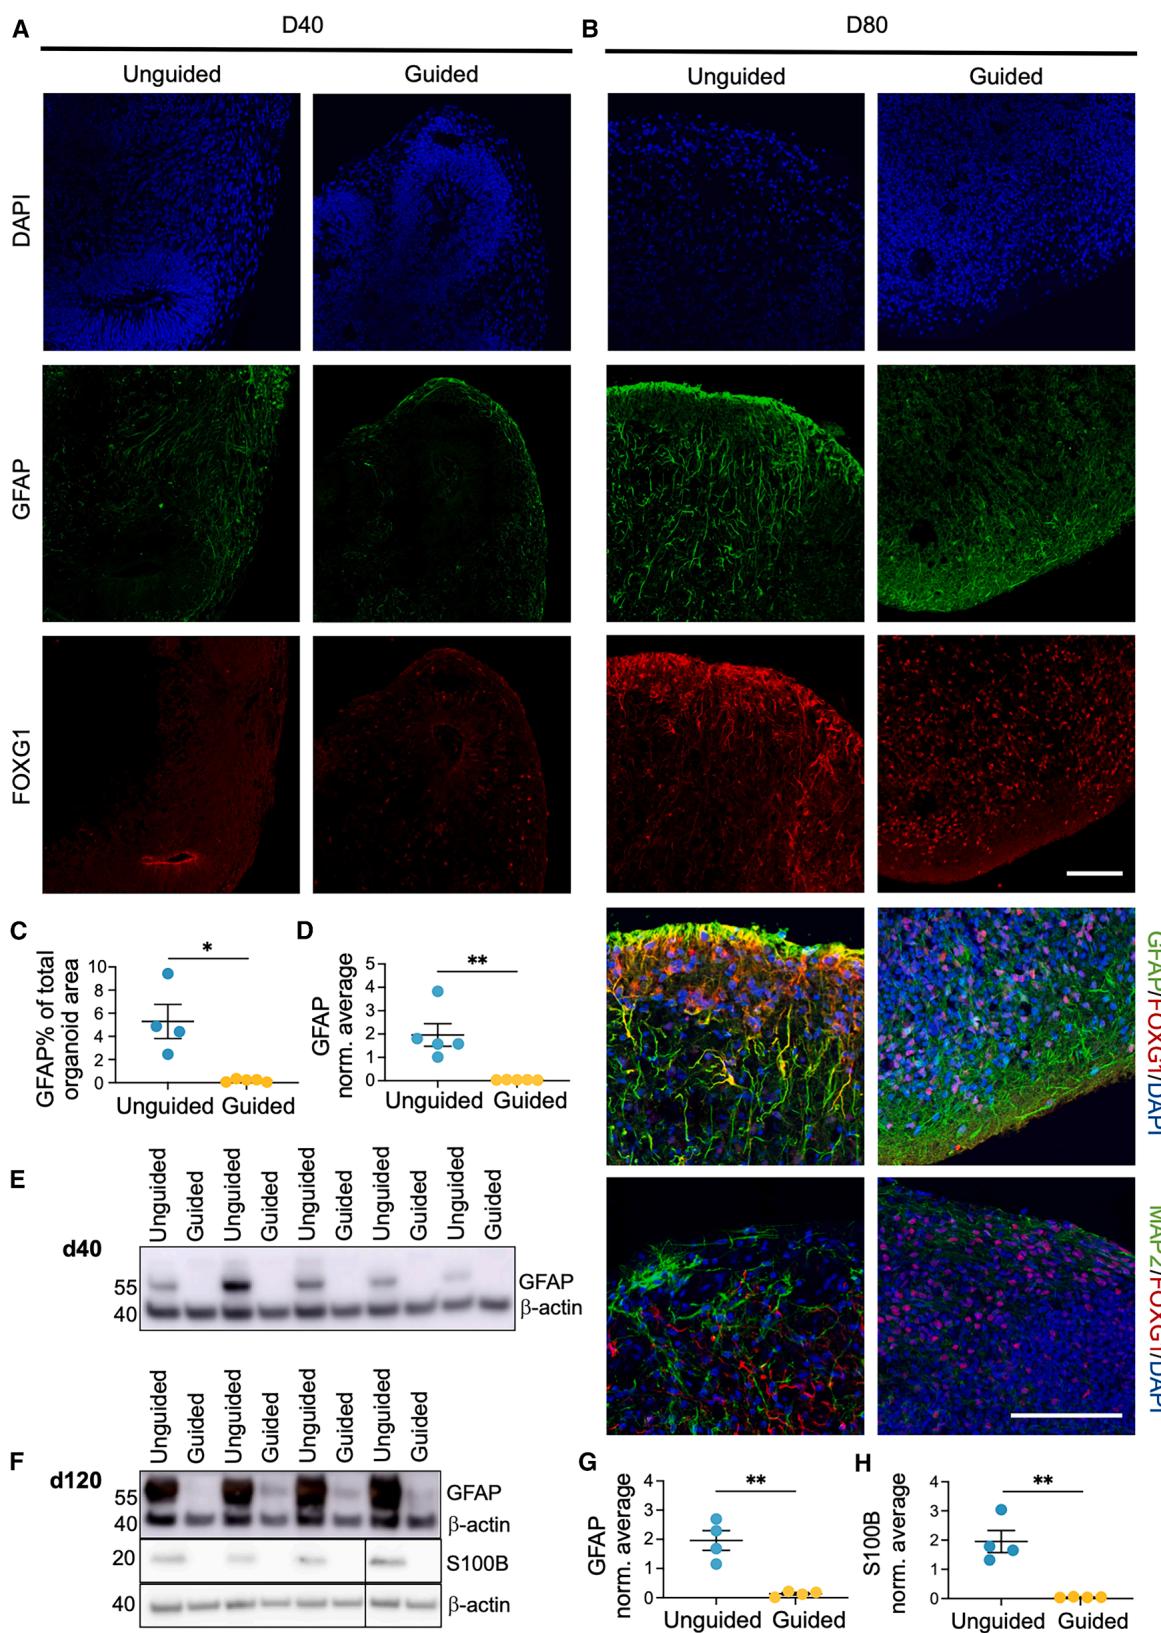
Figure 4. Higher abundance of S100B and GFAP+ cells with altered subcellular FOXG1 localization in unguided FOs
(A–C) ICC of FOs at (A) day 40 and (B) day 80 for DAPI (dark blue), forkhead box G1 (FOXG1, red), glial fibrillary acidic protein (GFAP, green), or microtubuleassociated protein 2 (MAP2, green). Scale bars, 100 μm. © Quantification of day 80 GFAP+ cell area as percentage of total DAPI+ organoid area. Mean ± SEM (n = 4–5 FOs from two differentiations, Student’s t test).
(D–H) Representative western blots and quantification of GFAP levels in (D and E) day 40 and (F and G) day 120 and (F and H) S100B in day 120 FOs. Protein
expression normalized to β-actin and average of all samples in each blot. Mean ± SEM (n = 4–5 FOs, Student’s t test). *p ≤ 0.05, **p ≤ 0.01.
See also Figure S1.
To address whether the increase in OXPHOS-related proteins was caused by enhanced mitochondrial content in the unguided FOs, we examined levels of the mitochondrial marker TOMM20. Western blotting showed significantly elevated levels of TOMM20 at both day 40 and 120 (Figures 5C–5E), supporting that the unguided FOs contain relatively more mitochondria. In line with this, the total ATP production, as measured by Seahorse analysis, was significantly higher in unguided FOs (Figure 5F). This correlated with a significantly larger NADH/NAD ratio in the unguided FOs as identified by the metabolomic analysis (Figure 5G). Perhaps due to higher OXPHOS levels in the unguided FOs, the ability to reduce reactive oxygen species (ROS) and the levels of reduced glutathione were significantly decreased compared to the guided FOs (Figures 5H and 5I).
Taken together, our results indicated that the unguided FOs had increased mitochondrial content and relied more heavily on OXPHOS than the guided FOs, which were utilizing glycolysis more.
¶ Glycolysis protein levels do not correlate with HIF1α levels in the guided and unguided FOs
The increased mitochondrial content and OXPHOS in unguided FOs seemed counterintuitive considering the results indicating accelerated neuronal differentiation in guided FOs. During normal differentiation from neural precursors to postmitotic neurons, a metabolic switch from glycolysis to OXPHOS and increased mitochondrial content occurs.34,35 Besides the difference in mitochondrial content, we also observed changes related to lysosomes. Proteins involved in ‘‘lysosomal transport’’ and ‘‘protein targeting to lysosomes’’ had significantly increased sialylation levels in the unguided FOs (Figure 5J). Western blotting for the glycosylated form of LAMP1, a lysosomal marker, showed significantly increased abundance at day 40, confirming the proteomics data (Figures 5K and 5L). Lysosomal proteins such as LAMP1 require N-linked glycosylation, including sialylation, for proper targeting to and function in lysosomes,36 and their upregulation likely indicates increased lysosomal content.
The guided FOs had significantly higher levels of monocarboxylate transporter 4 (MCT4) and hexokinase 2 (HK2) (Tables S1A and S1B), which are upregulated in highly glycolytic cells.37 Based on increased abundance of these and other glycolytic proteins, the GO term enrichment of guided FO proteins included ‘‘response to hypoxia’’ (Figure 1H). As hypoxia-inducible factor 1α (HIF1α) can upregulate expression of HK2, MCT4, and other glycolytic proteins,37 we aimed to test whether differences in hypoxia levels were present. Consistent with their larger size, HIF1α levels were significantly enhanced in unguided FOs at day 40 and 120 (Figures 5M–5O). Differences in hypoxia could therefore not explain the discrepancy in OXPHOS/glycolysis reliance between guided and unguided FOs.
¶ Differences in cellular composition of the guided and unguided FOs
To examine the cellular composition of the FOs, we performed single-cell RNA sequencing (scRNA-seq) on a total of 9,913 cells from day 20 and day 40 guided and unguided FOs (n = 3 per group) generated from a new batch of iPSCs (Figures S2A– S2C). Clustering and differential gene expression analysis revealed 12 cell clusters of progenitors and neurons, resembling the main populations found in early forebrain development and comparable to earlier scRNA-seq analyses of FOs (Figures 6A and 6B, Data S1; Table S4).13,19,24 Separating the cells on time points and organoid type (Figures 6C–6E) revealed that markers of cortical hem (CH) (Figure 6D; LMX1A; Figure S2D; RSPO1) and ChP (Figure 6D; transthyretin [TTR]; Figure S2E; chloride intracellular channel protein 6 [CLIC6]) and the corresponding cell clusters were found at noticeably higher levels in the unguided FOs at day 40 (Figures 6C–6E). Correspondingly, reelin, a key marker of Cajal Retzius cells (CR), which mainly arise from CH,26 was more highly expressed in unguided FOs (Figure 6D; RELN). Surprisingly, the cell populations expressing markers of medial ganglionic eminence (mGE) and interneurons (INs) were found only in guided FOs as demonstrated by markers for mGE, migrating (Figure 6D; DLX2; Figure S2D; DLX1, ASCL1), and mature interneurons (Figure 6D; GAD2). However, the proteomic analysis identified GAD1 and GAD2 protein expression in the unguided FOs albeit at significantly lower levels than in the guided FOs (Tables S1A and S1B).
In accordance with the proteomic and ICC findings, GFAP was more widely expressed in the unguided FOs, and FOXG1 levels were higher in guided FOs (Figure S2E). Lower levels of FOXG1 expression in the unguided organoids could be caused by their proportionally higher content of CH and ChP, which are characterized by the absence of FOXG1 expression.38 Furthermore, given that FOXG1 is more highly expressed in the ventral forebrain than the dorsal, this is also consistent with the increased numbers of inhibitory neurons in the guided FOs.39
To determine differences in the developmental trajectories, we performed pseudotime analysis on the scRNA-seq data from both organoid types separately (Figures S2G–S2J). This supported a unique lineage from mitotic RG via mGE to migratory and mature interneurons in the guided FOs (Figures S2G and S2H). In the unguided FOs, a trajectory from RG through intermediate progenitor cells (IPCs) to Cajal Retzius and deep-layer neurons, corresponding to indirect neurogenesis, was identified (Figures S2I and S2J). This was not seen in the guided FOs, where the RG population connecting to IPCs was not present (Figures S2G and S2H). This might indicate that the formation of IPCs happens prior to day 20 in the guided FOs as the lineage from IPCs to Cajal Retzius and deep-layer neurons was preserved. In both organoid types, a population of neurons with high expression of glycolytic genes and stress markers such as HSPH1 and NEAT1 (glycoNeuron) (Figures 6B and 6F; Table S4) appeared to be generated through direct neurogenesis from RG (Figures S2G and S2H). The proportion of glycoNeurons in guided and unguided FOs was similar and as such could not explain the higher levels of glycolytic proteins in guided FOs. Expression of key glycolysis proteins HK2 and PDK1 appeared universally increased in the guided FOs at day 40 across cell types (Figure 6F). In contrast, levels of OXPHOS-related transcripts, NDUFA4 and UQCRB, were more uniform between the four conditions and mainly varied between cell types with the highest expression in ChP and glycoNeurons (Figure 6G). Given the increased expression of OXPHOS transcripts in ChP, the presence of this cell population in mainly unguided FOs could contribute to their increased OXPHOS. In support of this, transcripts for PGC-1α (PPARGC1A), a master regulator of mitochondrial biogenesis, were at the highest levels in ChP in the day 40 unguided FOs (Figure S2F).34
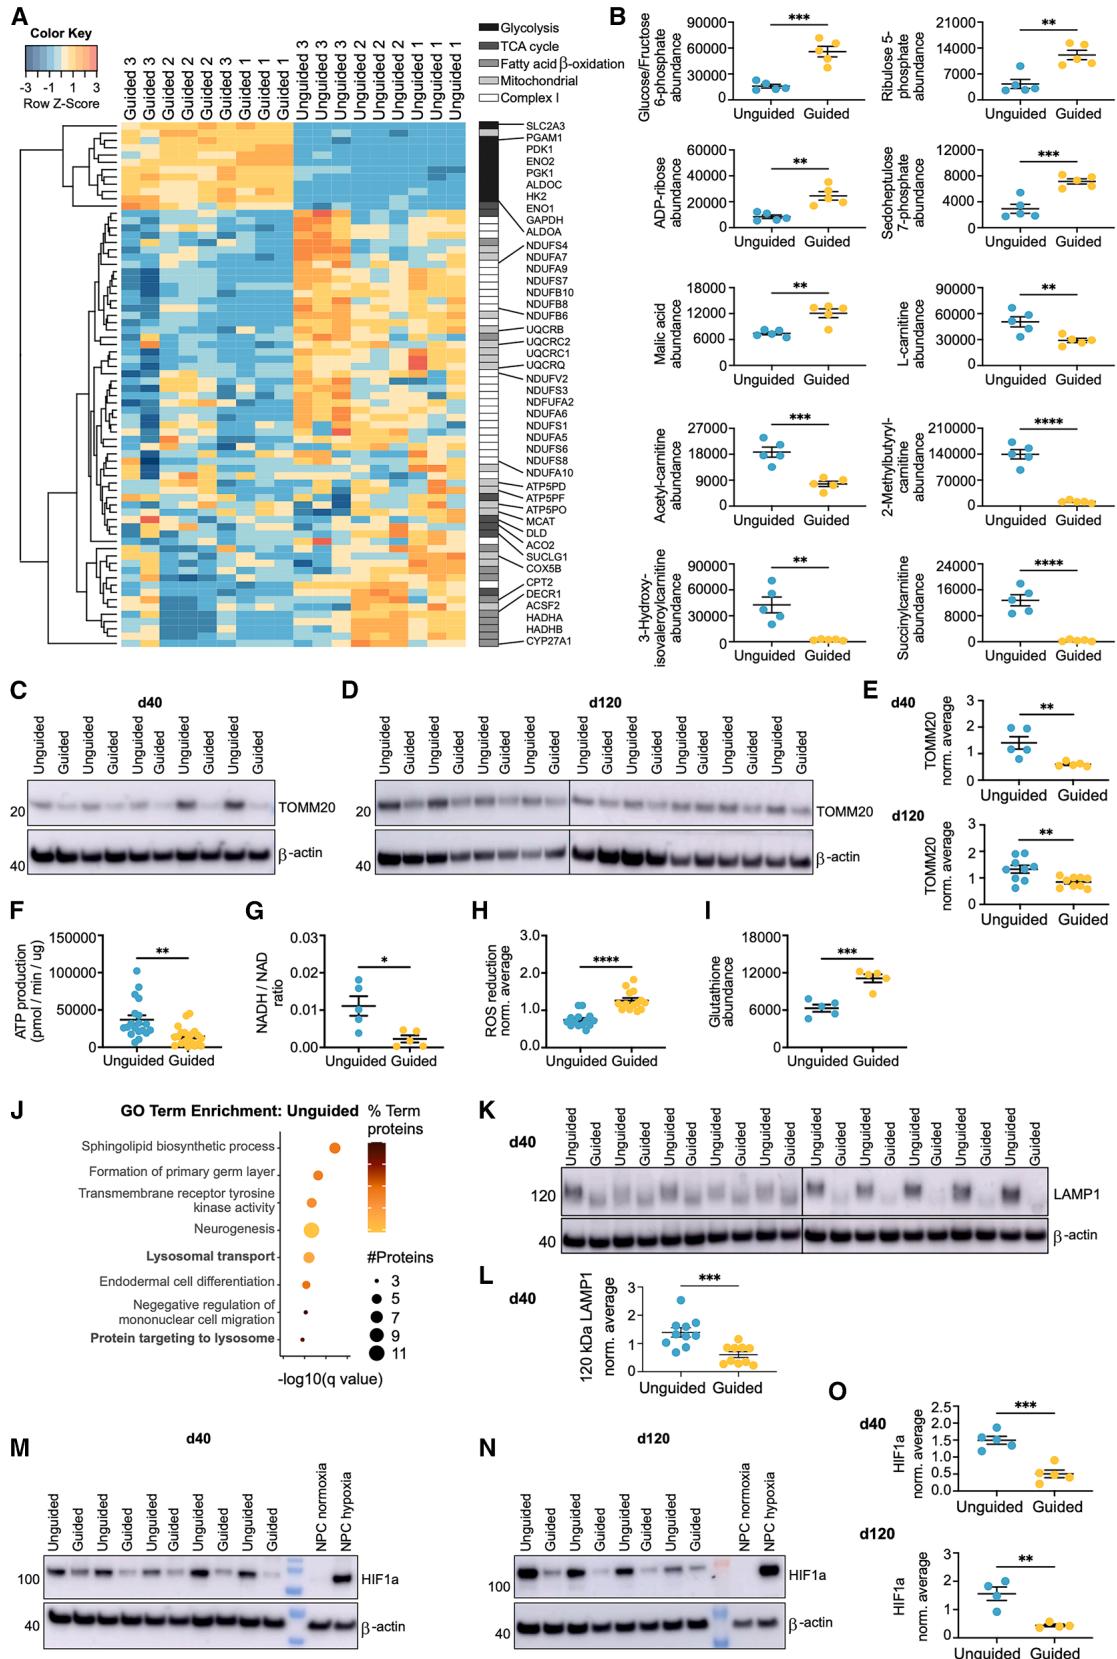
Figure 5. Increased levels of mitochondria and OXPHOS in guided vs. unguided FOs
(A) Heatmap of significant proteins related to glycolysis, TCA cycle, fatty acid β-oxidation (FAO), mitochondria, and complex I (q value≤0.05, fold change±0.3) abundances in guided vs. unguided FOs ordered by hierarchical clustering (n = 9 FOs from 3 differentiations, rank products test).
(B) Abundance levels of metabolites related to glycolysis/pentose phosphate pathway or FAO quantified by metabolomics. Mean ± SEM (rank products test). (C–E) Representative western blots and quantification of TOMM20 levels in (C and E) day 40 and (D and E) day 120 FOs. Protein expression normalized to β-actin and average of all samples in each blot. Mean ± SEM (n = 5/9 FOs from one or two differentiations, Student’s t test).
(F) ATP production in pmol/min normalised to protein content (μg) on day 80 FOs. Mean ± SEM (n = 20 FOs from 3 differentiations, Student’s t test). (G) Ratio of NADH/NAD as quantified by metabolomics. Mean ± SEM (n = 5 FOs from one differentiation, rank products test).
(H) Reduction of reactive oxygen species (ROS) by FOs, relative fluorescent units normalized to average of all samples per differentiation. Mean ± SEM (n = 14 FOs from three differentiations, Student’s t test).
(I) Abundance levels of reduced glutathione as quantified by metabolomics. Mean ± SEM (n = 5 FOs from one differentiation, rank products test). (J) GO term enrichment analysis of proteins with increased sialylation levels (q ≤ 0.05) in unguided vs. guided FOs with the dot size signifying the number of significant proteins in the pathway and color indicating their percentage of the total number of pathway proteins (two-sided hypergeometric test with Bonferroni step-down).
(K–O) Representative western blots and quantification of (K and L) glycosylated 120 kDa LAMP1 levels in day 40 FOs and HIF1α levels in (M and O) day 40 and (N and O) day 120 FOs. Neural precursor cells (NPCs) cultured in 2D under normoxic (20% oxygen) or hypoxic (1% oxygen) conditions for 4 h as controls. Protein expression levels normalized to β-actin and average of all samples in each blot. Mean ± SEM (n = 4–5 FOs, Student’s t test). *p ≤ 0.05, **p ≤ 0.01, ***p ≤ 0.001, ****p ≤ 0.0001.
Overall, the scRNA-seq identified differences in the cellular content, which could partly explain the observed metabolic differences, but also supported a general increase in glycolysis transcripts across cell types in the guided FOs.
¶ Culturing guided FOs with agitation does not alter hypoxia levels or metabolic differences from the unguided FOs
A potential contributing factor to the general increase in glycolysis in the guided FOs could be their static culture conditions when following the protocol from STEMCELL Technologies. The unguided FOs are cultured on an orbital shaker starting from day 10, which might increase oxygenation and limit hypoxia. We therefore compared guided FOs grown under static conditions to ones cultured on an orbital shaker from day 6 to day 40. We noticed a significant increase in the size of the guided FOs when cultured with shaking (Figure 7A). However, comparing levels of HIF1α and TOMM20, we found no differences in hypoxia levels or mitochondrial content (Figures 7B–7D), suggesting that the metabolic differences between guided and unguided FOs were not caused by static vs. agitation culture conditions.
To ascertain this and explore how the choice of organoid model can affect results in a disease context, we generated guided and unguided FOs, both cultured with agitation, from iPSCs from three patients with SCZ and three age-matched CTLs (Figures S3 and S4). All six iPSC lines gave rise to guided and unguided FOs with comparable levels of cortical neuronal progenitors as shown by expression of TBR2, SOX2, and HuC/ D at day 20 and no significant differences in their size at day 40 (Figures 7E and S4). Correspondingly, PCA on day 40 proteomics clustered the guided and unguided FOs separately, independent of their originating iPSC identity (Figure 7F). Interestingly, the variation between individual iPSC lines within the guided and unguided FO groups appeared similar (Figure 7F). Comparing the guided and unguided FOs from all six iPSC lines, 1,156 proteins had significantly different abundance levels. Neuronal proteins such as glutamate receptor 1, MAP2, FOXG1, and SOX1 were more abundant in the guided FOs, and ChP-related proteins such as TTR and CLIC6 were more abundant in the unguided FOs (Figure 7G; Tables S5A and S5B). GO term enrichment on DAPs confirmed the earlier results, with ‘‘cerebral cortex development,’’ ‘‘dendrite development,’’ and ‘‘regulation of axon extension’’ being enriched in the guided FOs and ‘‘mitochondrial translation,’’ ‘‘aerobic respiration,’’ and ‘‘FAO’’ in the unguided FOs (Figures 7H and 7I). This confirmed that the results from the initial experiments were not cell linebut rather protocol-specific. Furthermore, as both types of FOs were now cultured with agitation, this excluded the original static culture conditions of guided FOs as the cause of the observed metabolic differences.
To understand how the protein expression profiles of FOs compared to the developing human forebrain, we performed a correlation analysis to gestational week 9 (GW9) proteomic data on human fetal frontal lobe (Zhao et al.).40 Our study identified 90% of the proteins present in the GW9 fetal frontal lobe (Figure S5A; Table S6) and showed significant positive correlation between fetal and FO protein abundance, similar for the guided and unguided FOs (Figures S5B and S5C). Proteins with high normalized abundance in FOs relative to the fetal frontal lobe did not enrich particular functions or pathways. However, the proteins with the lowest normalized abundance in FOs compared to fetal frontal lobe were enriched for ECM proteins. This was most pronounced in the guided FOs whereas the unguided FOs also showed relatively lower abundance of key forebrain/cortex transcription factors including FOXG1, TBR1, and SOX2 (Figures S5D and S5E). Overall, both FO types showed a high and comparable degree of correlation to GW9 fetal frontal lobe in their protein expression.
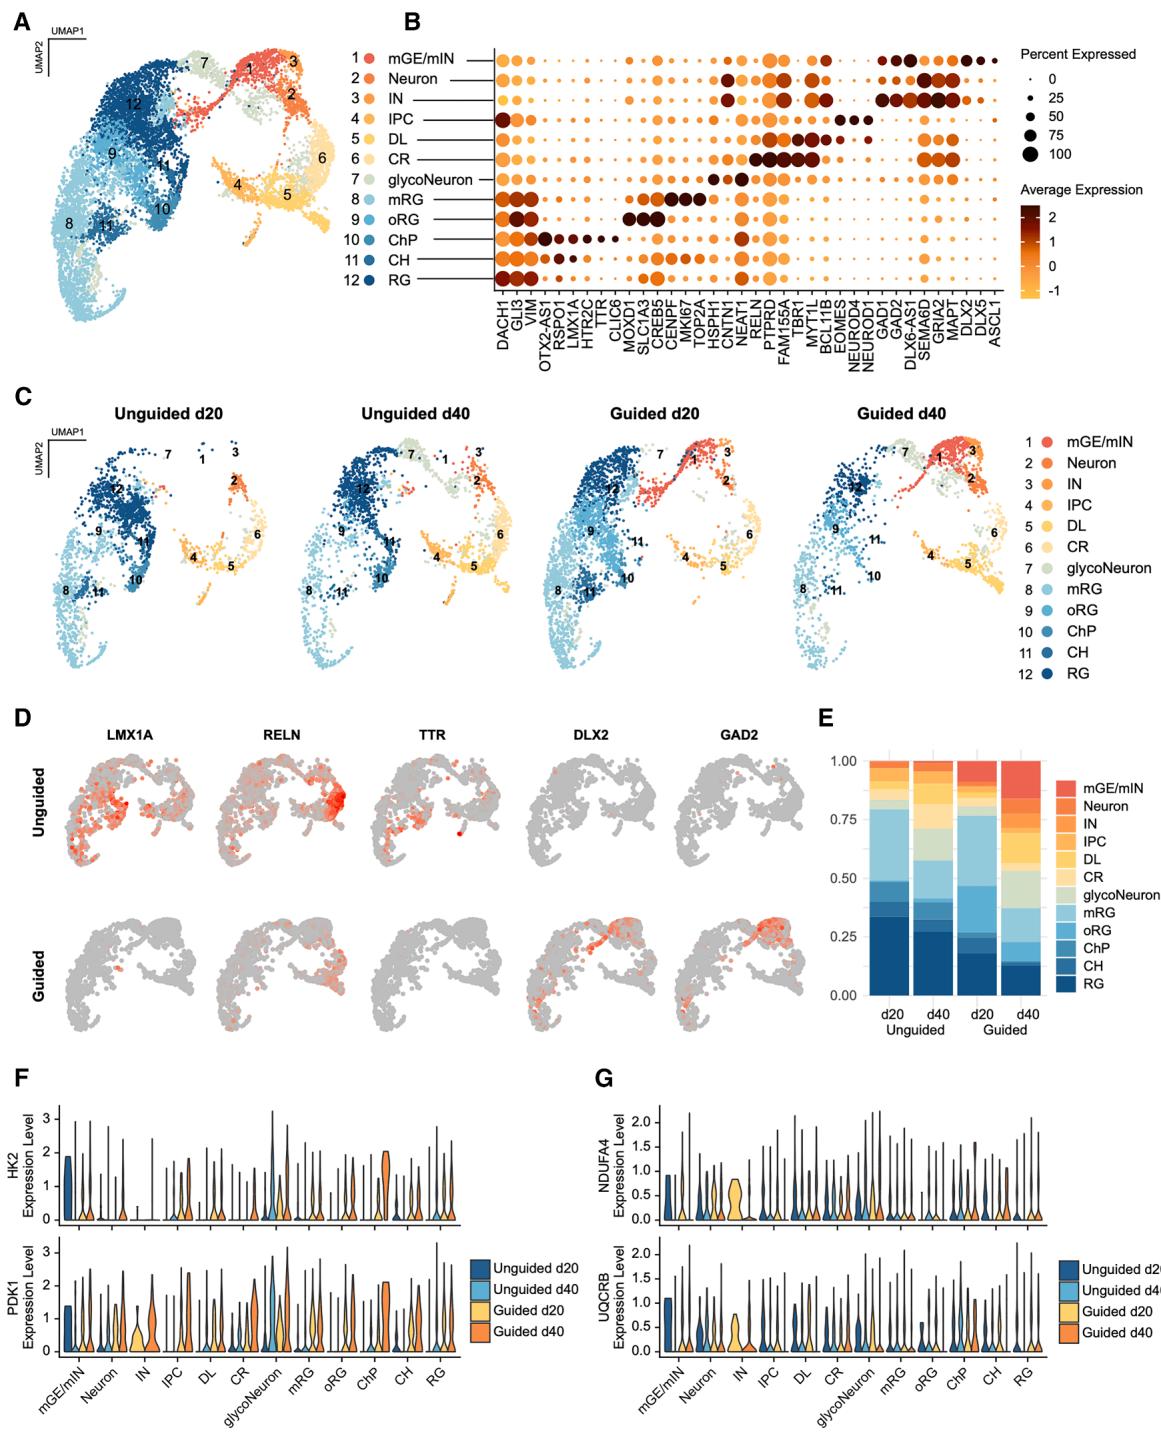
Figure 6. scRNA-seq reveals differences in cellular composition and expression of glycolytic markers in guided vs. unguided FOs (A) Uniform manifold approximation and projection (UMAP) of single-cell RNA sequencing (scRNA-seq) data from day 20 and 40 g FOs (n = 3 FOs per time point from one differentiation) identifying 12 clusters: CR, Cajal Retzius cells; RG, radial glia; oRG, outer RG; mRG, mitotic RG; CH, cortical hem; ChP, choroid plexus; DL, deep-layer neurons; IPCs, intermediate progenitor cells; INs, interneurons; mGE/mIN, medial ganglionic eminence/migratory INs. (B) Expression of key markers for each cluster with color indicating average expression levels and dot size depicting percentage of cells expressing the marker. © UMAP split based on cell origin; unguided or guided, day 20 and day 40. (D) Feature plots showing expression levels for markers of cortical hem (LMX1A), Cajal Retzius cells (RELN), choroid plexus (TTR), and interneurons (DLX2, GAD2) in day 40 FOs.
¶ Different proteomic disease signatures in the guided and unguided FOs from patients with SCZ and CTLs
Examining data from guided and unguided FOs separately, we compared the proteomic differences between SCZ and agematched CTLs. No proteins had a q value ≤ 0.05 when correcting for multiple testing, highlighting the need for larger cohorts of patients and CTLs in future studies. However, with a fold change cutoff of ±0.3 and p value ≤ 0.05, 84, and 104 proteins were differentially abundant between SCZ and CTLs in the guided and unguided FOs, respectively (Figures 7J–7M; Tables S5C and S5D). Five of these (PLXNB1, MTERF3, NFX1, LYRM2, and KLHL22) overlapped between guided and unguided FOs, all with decreased abundance in SCZ FOs. GO term enrichment analysis pointed to different pathways being affected in SCZ FOs of the two types: in the guided FOs, ‘‘positive regulation of JUN kinase activity’’ was enriched based on MAP3K7, DVL3, and GBE1 (Figures 7J and 7L). In unguided FOs, ‘‘tRNA aminoacetylation of protein translation’’ was enriched based on SARS2, LARS1, and EPRS1, which were all more abundant in SCZ (Figures 7K and 7M). In the SCZ-guided FOs, a notable decrease in glycosphingolipid-related proteins (GALC, IDUA, and ARSA) was also observed (Figure 7J). Taken together, this demonstrates how the chosen organoid system can substantially affect the outcome when comparing SCZ and CTL FOs.
¶ DISCUSSION
This study compared two widely used guided and unguided FO protocols to inform their applications in neurological research. Both were generated in parallel starting from the same iPSC batches and analyzed with multi-omics assessing morphology, cellular composition, and metabolism.
Unguided FOs showed higher within-batch and batch-tobatch variability than guided FOs and were significantly larger by day 40, despite starting from a smaller number of iPSCs. This was likely due to slower neuronal differentiation and the use of agitation culture, increasing nutrient flow. Supporting this, guided FOs grown under agitation showed significant size increases, bringing both types to similar sizes.
Guided FOs exhibited sustained increases in neuronal and synaptic proteins and neurotransmitters, though without clear late-stage differences in synapse numbers or electrical activity. How the presence of interneurons in guided FOs is affecting the overall activity levels is unclear.41 In contrast, unguided FOs contained more RG, glial progenitors, and astrocytic markers, consistent with lower FOXG1 levels and greater ChPlike content.3 8 In unguided FOs, cytoplasmic translocation of FOXG1 in GFAP+ cells was observed at day 80, indicating differentiation of RG progenitors into astrocytes, 32 potentially driven by FGF2 signaling from the ChP.42,43
ScRNA-seq revealed a striking difference in neuronal cell type composition, with the unguided FOs containing very few interneurons. This aligns with previous studies showing that unguided FOs develop interneurons and their precursors later during differentiation.1,12,13 However, the proteomic analysis, performed on independent differentiations, identified GAD1 and GAD2 expression in both FO types, suggesting variability in interneuron contributions across differentiations. The development of interneurons in guided FOs points to some degree of ventralization; however, this has also been observed in other studies using guided, dorsally patterned organoids.12,44 Furthermore, interneurons, expressing ventral markers including DLX isoforms, have been shown to develop from dorsal ventricular zone/subventricular zone areas.45
Both FO types correlated well with GW9 fetal frontal lobe tissue,4 0 though ECM proteins were lower particularly in the guided FOs, possibly due to the embedding of the unguided FOs in Matrigel during early differentiation.46
Unexpectedly, the unguided FOs showed increased mitochondrial content and OXPHOS activity, despite the enhanced neuronal differentiation in guided FOs. Neuronal differentiation typically involves a metabolic shift from glycolysis to OXPHOS, accompanied by increased mitochondrial mass.47,48 This process is regulated by transcription factors like PGC-1α and TFAM, which also promote lysosomal biogenesis,34,35,49 perhaps explaining the concomitant increased lysosomal abundance in the unguided FOs. Alternatively, the increased presence of ChP cells, known for their high mitochondrial activity, may further explain the higher mitochondrial content in the unguided FOs.50
Additionally, the larger proportion of RG and perhaps astrocytic lineages in the unguided FOs could also contribute to the observed metabolic differences. Astrocyte mitochondria are enriched in FAO enzymes and efficiently metabolize long-chain fatty acids.51,52 Furthermore, studies also suggest that FAO is key for neural stem cell self-renewal.53,54
The guided FOs exhibited higher glycolysis and PPP activity, consistent with their increased neuronal and synaptic protein expression. Aerobic glycolysis and PPP support biosynthesis for synapse and neurite formation and maintain reduced glutathione levels through NADPH production.34,55 Several of the glycolytic proteins increased in the guided FOs are also regulated by hypoxia including MCT4, HK2, and PDK1.37,56,57 However, hypoxia markers such as HIF1α were higher in the unguided FOs, potentially due to their larger size and increased oxygen demand from elevated mitochondrial activity.58 Interestingly, hypoxia can promote astrocytic differentiation, further supporting the increased glial content in the unguided FOs.59
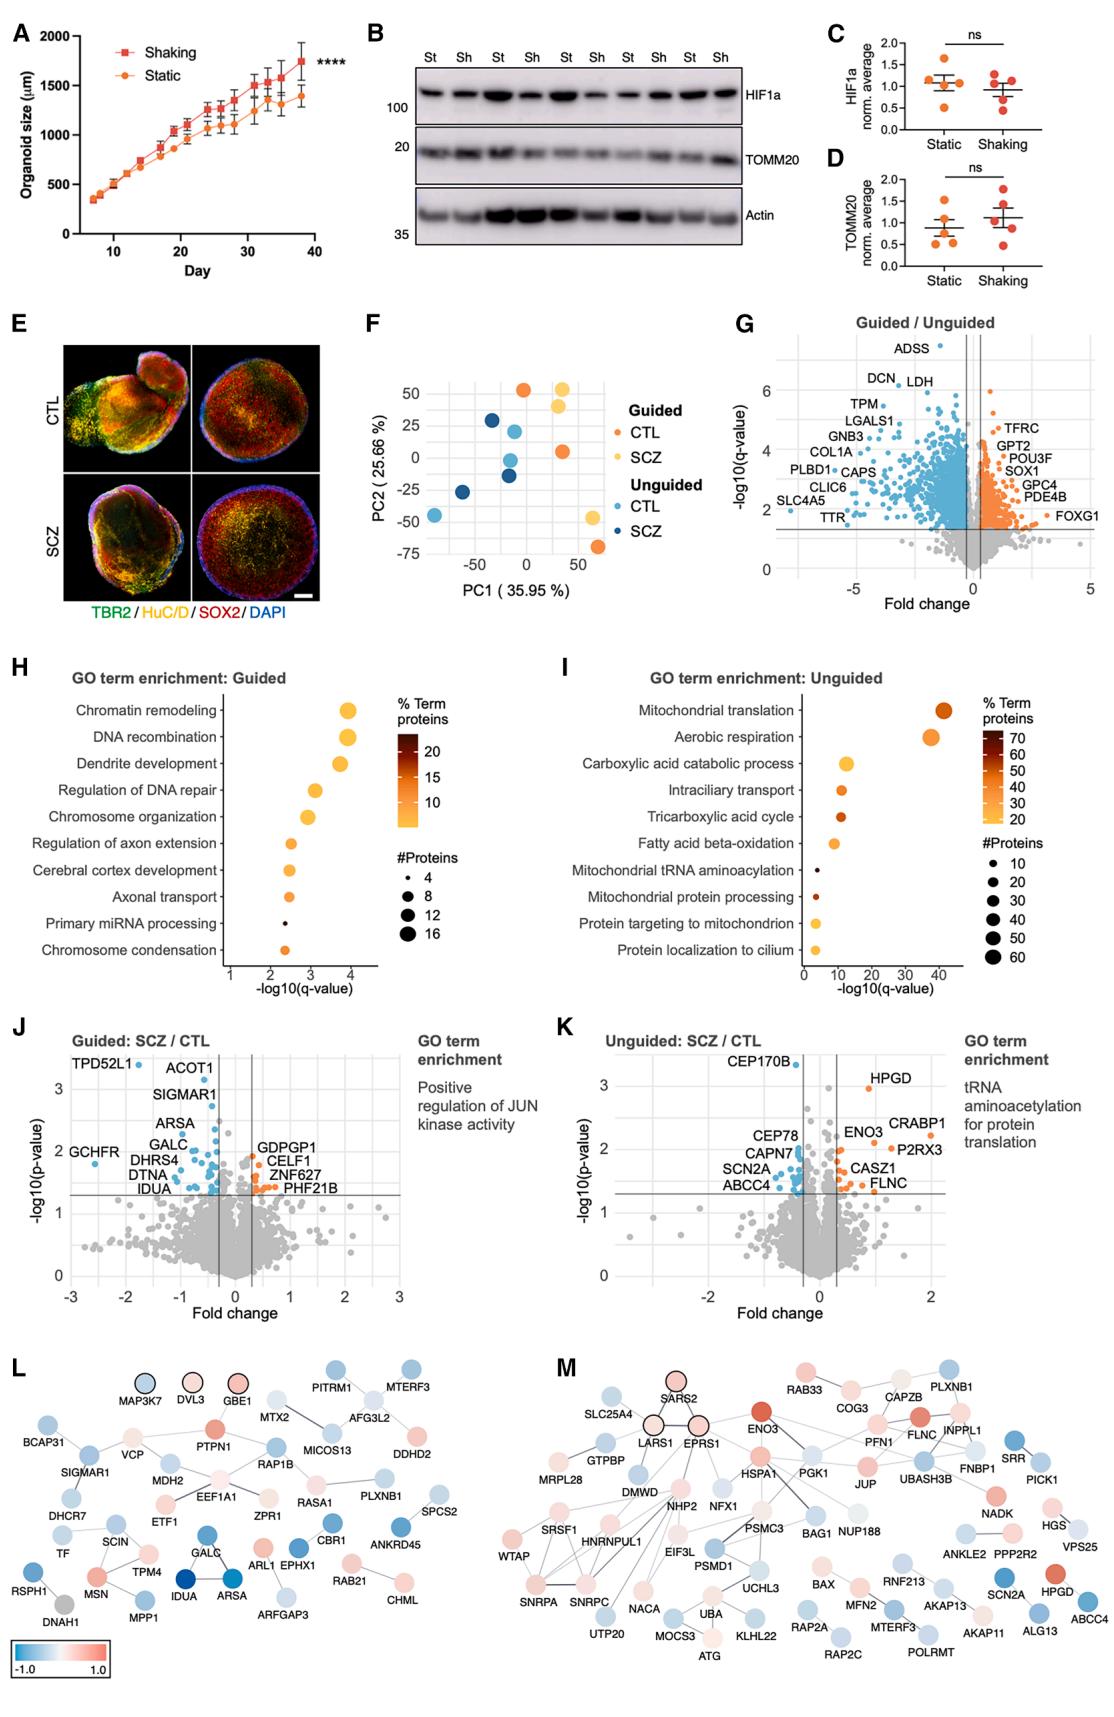
Figure 7. Guided and unguided FOs from patients with SCZ and CTLs reveal different proteomic disease signatures
(A) Size of guided FOs cultured under static or shaking conditions. Mean ± SEM, ****p ≤ 0.0001 (n = 3–11 FOs per time point, from two differentiations, two-way ANOVA).
(B–D) Representative western blots and quantification of (B and C) HIF1 and (B and D) TOMM20 levels in day 40 guided FOs cultured under static (st) or shaking(sh) conditions. Protein expression normalized to β-actin and average of all samples in each blot. Mean ± SEM (n = 5 FOs from one differentiation, Student’s t test).
(E) Representative ICC of day 20 guided and unguided FOs from SCZ and CTLs for DAPI (dark blue), SRY-box 2 (SOX2, red), T-box brain protein 2 (TBR2, green), and HuC/D (yellow). Scale bars, 250 μm.
(F) PCA of proteins quantified by proteomics on day 40 guided and unguided FOs (n = 6 FOs, combining SCZ/CTLs, from one differentiation).
(G) Volcano plots showing the protein fold change and − log10 (q value) comparing day 40 guided vs. unguided FOs using proteomics (n = 6 FOs, combining SCZ/CTLs, q ≤ 0.05 and fold change±0.3 considered significant, rank products test).
(H and I) GO term enrichment analysis on significant (H) increased and (I) decreased proteins (q ≤ 0.05, fold change±0.3) in guided vs. unguided FOs from (n = 6 FOs, combining SCZ/CTLs) with dot size signifying a number of significant proteins and color indicating their percentage of the total number of pathway proteins
(two-sided hypergeometric test with Bonferroni step-down).
(J and K) Volcano plots showing protein fold change and − log10 (p value) comparing SCZ vs. CTL (J) guided and (K) unguided FOs (n = 3 FOs, p ≤ 0.05 and fold change±0.3 considered significant, rank products test) and their GO term enrichments.
(L and M) String network of significant proteins in (L) guided and (M) unguided SCZ vs. CTL FOs with color indicating the fold change. Proteins with black outlines belong to the enriched GO terms. (L) MAP3K7 and DVL3 have been manually added to the network.
See also Figures S4 and S5; Table S5.
The glycoNeurons, present in both FO types, appeared to arise directly from RG, resembling direct neurogenesis. Whether they are more susceptible to hypoxia-induced stress or represent premature differentiation of neural progenitors remains unclear.24,60
The proteomic analysis of SCZ and CTL FOs confirmed consistent neuronal and metabolic differences between the guided and unguided FOs, regardless of whether they were cultured with agitation or not, and revealed comparable inter-individual organoid variability. However, our earlier data suggested higher batch-to-batch variability with unguided FOs, which could impact their reliability for disease modeling.
The choice of FO model should depend on the research focus. The accelerated maturation and overall lower variability of the FO protocol are obvious advantages for disease modeling. However, if faster development is at the expense of astroglial lineage content, the slower pace of the unguided FOs might reveal important disease-relevant features that would otherwise be missed. From the present comparison, the unguided FOs are likely better suited for studying glia development and astrocyte-neuron interactions, ECM functions, and perhaps energy metabolism, while the guided FOs are preferable for applications requiring enhanced neuronal and synaptic content and consistent interneuron contributions. These differences were evident when applied to SCZ patient iPSC lines, where proteomic analyses revealed distinct disease-related perturbations between FO types. The guided SCZ FOs showed changes in JUN kinase-related pathways, which have been implicated in SCZ.61 In contrast, the unguided SCZ FOs highlighted perturbations in tRNA aminoacetylation, another pathway linked to neuropsychiatric disorders.62 The decrease in glycosphingolipid-related proteins in guided SCZ FOs was also of interest, given evidence of perturbed sphingolipid metabolisms in postmortem brain tissues from patients with SCZ.63,64 Of the five proteins with lower abundance in both guided and unguided SCZ FOs, only PLXNB1 has earlier been implicated in SCZ.61 Notably, MTERF3 and LYRM2, regulators of mitochondrial function,65–67 were among the shared differentially expressed proteins. Given the strong link between mitochondrial dysfunction and SCZ,68,69 these proteins are relevant targets for future studies.
In conclusion, this study provides a comprehensive comparison of a guided and an unguided FO protocol, highlighting significant differences in neuronal differentiation, cellular composition, and metabolic activity. These differences can likely influence disease modeling outcomes, underscoring the importance of selecting the appropriate FO model for specific research goals. By providing a detailed resource, this study contributes to the optimization of FO applications in modeling neurological diseases using patient-derived iPSCs.
¶ Limitations of the study
The present results cannot directly be extrapolated to other guided/unguided FO protocols, partly because the media compositions are undisclosed by STEMCELL Technologies.
For the comparison of SCZ and CTL FOs, the number of biological replicates was limited to three, which restricts statistical power. Nominal p values are reported, and reproduction of these findings in a larger cohort and/or validation with orthogonal methods is needed to infer disease biology.
¶ RESOURCE AVAILABILITY
¶ Lead contact
Requests for further information,resources, and reagents must be directed to and will be fulfilled by the lead contact, Helle Bogetofte (hbogetofte@bmb.sdu.dk).
¶ Materials availability
The IMR90 iPSC line is commercially available from WiCell. There are restrictions to the availability of the CTL and SCZ patient iPSC lines generated for this study owing to project-related ethical regulations.
¶ Data and code availability
• The mass spectrometry proteomics data have been deposited to the ProteomeXchange Consortium via the PRIDE partner repository (dataset identifier PRIDE: PXD048559). The scRNA-seq data have been deposited in NCBI’s Gene Expression Omnibus (accession number: GEO: GSE253889). Data are publicly available as of the date of publication.
• This study does not report original code.
• Any additional information required to reanalyze the data reported in this paper is available from the lead contact upon request.
¶ ACKNOWLEDGMENTS
This study was supported by the Lundbeck Foundation (grant nos. R336+2020-1113 and R380-2021-1425), the PLATO research infrastructure: Danish National Mass Spectrometry Platform for Proteomics and Biomolecular Imaging (grant no. 5229-00012B, www.sdu.dk/PLATO), and the Villum Center for Bioanalytical Sciences at University of Southern Denmark. Image acquisition was performed at the Danish Molecular Biomedical Imaging Center (DaMBIC, University of Southern Denmark), supported by the Novo Nordisk Foundation (grant agreement no. NNF18SA0032928).
The graphical abstract was created in BioRender. Bogetofte, H. (2025) https://BioRender.com/3cjc4ja.
¶ AUTHOR CONTRIBUTIONS
Conceptualization, M.S.O., P.J., M.A.L., M.R.L., and H.B.; data curation, M.S.O., J.F.H., S.W.W., and H.B.; formal analysis, M.S.O., P.J., J.F.H., S.I.S., F.A.M., M.S., S.W.W., I.C., and H.B.; funding acquisition, J.B., M.E.B., K.F., N.J.F., M.A.L., M.R.L., and H.B.; investigation, M.S.O., P.J., J.F.H., S.I.S., F.A.M., M.S., S.B.E., L.C., E.B., J.A.A.N., L.A.J., and H.B.; methodology, M.S.O., P.J., M.A.L., M.R.L., and H.B.; project administration, P.J., M.R.L., and H.B.; resources, J.B., M.E.B., K.F., N.J.F., M.A.L., M.R.L., and H.B.; validation, M.S.O., P.J., S.I.S., F.A.M., E.B., L.A.J., J.B., M.E.B., K.F., N.J.F., M.A.L., M.R.L., and H.B.; visualization, M.S.O., S.I.S., F.A.M., and H.B.; writing – original draft, M.S.O., F.A.M., and H.B.; writing – review & editing, M.S.O., P.J., M.A.L., M.R.L., and H.B. All co-authors approved the final version.
¶ DECLARATION OF INTERESTS
The authors declare no competing interests.
¶ STAR★METHODS
Detailed methods are provided in the online version of this paper and include the following:
• KEY RESOURCES TABLE
EXPERIMENTAL MODEL AND STUDY PARTICIPANT DETAILS
○ iPSC maintenance
○ Schizophrenia patients and healthy controls
• METHOD DETAILS
○ Peripheral blood mononuclear cell isolation
○ Episomal reprogramming
○ Check of hiPSC line differentiation potential
○ Copy number variation
○ Forebrain organoid (FO) differentiation
○ Immunocytochemistry and imaging
○ Protein lysis and digestion
○ TMT-labelling for proteomic analysis
○ Enrichment of phospho-and glycopeptides
○ High pH fractionation
○ Nano liquid chromatography-mass spectrometry
○ Protein identification and quantification
○ Lipid and metabolite extraction
○ Metabolomic and lipidomic analysis
○ Western blotting
○ Multi-electrode array (MEA) analysis
○ Functional assays for LDH and ROS
○ Seahorse analysis
○ Single-cell RNA sequencing (scRNAseq)
○ Fetal frontal lobe proteomic comparison
• QUANTIFICATION AND STATISTICAL ANALYSIS ○ Image and WB quantification ○ Statistical analyses
¶ SUPPLEMENTAL INFORMATION
Supplemental information can be found online at https://doi.org/10.1016/j.
crmeth.2025.101295.
Received: January 21, 2025
Revised: March 14, 2025
Accepted: December 12, 2025
¶ REFERENCES
- Camp, J.G., Badsha, F., Florio, M., Kanton, S., Gerber, T., WilschBra¨ uninger, M., Lewitus, E., Sykes, A., Hevers, W., Lancaster, M., et al. (2015). Human cerebral organoids recapitulate gene expression programs of fetal neocortex development. Proc. Natl. Acad. Sci. USA 112, 15672–
- https://doi.org/10.1073/pnas.1520760112.
- Lancaster, M.A., Corsini, N.S., Wolfinger, S., Gustafson, E.H., Phillips, A.W., Burkard, T.R., Otani, T., Livesey, F.J., and Knoblich, J.A. (2017). Guided self-organization and cortical plate formation in human brain organoids. Nat. Biotechnol. 35, 659–666. https://doi.org/10.1038/nbt.3906.
- Gordon, A., Yoon, S.-J., Tran, S.S., Makinson, C.D., Park, J.Y., Andersen, J., Valencia, A.M., Horvath, S., Xiao, X., Huguenard, J.R., et al. (2021). Long-term maturation of human cortical organoids matches key early postnatal transitions. Nat. Neurosci. 24, 331–342. https://doi.org/10.1038/s41593-021-00802-y.
- Mariani, J., Coppola, G., Zhang, P., Abyzov, A., Provini, L., Tomasini, L., Amenduni, M., Szekely, A., Palejev, D., Wilson, M., et al. (2015). FOXG1- Dependent Dysregulation of GABA/Glutamate Neuron Differentiation in Autism Spectrum Disorders. Cell 162, 375–390. https://doi.org/10.1016/ j.cell.2015.06.034.
- Li, C., Fleck, J.S., Martins-Costa, C., Burkard, T.R., Themann, J., Stuempflen, M., Peer, A.M., Vertesy, A´ ., Littleboy, J.B., Esk, C., et al. (2023). Single-cell brain organoid screening identifies developmental defects in autism. Nature 621, 373–380. https://doi.org/10.1038/s41586-023-06473-y.
- Kathuria, A., Lopez-Lengowski, K., Jagtap, S.S., McPhie, D., Perlis, R.H., Cohen, B.M., and Karmacharya, R. (2020). Transcriptomic Landscape and Functional Characterization of Induced Pluripotent Stem Cell-Derived Cerebral Organoids in Schizophrenia. JAMA Psychiatry 77, 745–754. https:// doi.org/10.1001/jamapsychiatry.2020.0196.
- Lancaster, M.A., Renner, M., Martin, C.-A., Wenzel, D., Bicknell, L.S., Hurles, M.E., Homfray, T., Penninger, J.M., Jackson, A.P., and Knoblich, J.A. (2013). Cerebral organoids model human brain development and microcephaly. Nature 501, 373–379. https://doi.org/10.1038/ nature12517.
- Choi, S.H., Kim, Y.H., Hebisch, M., Sliwinski, C., Lee, S., D’Avanzo, C., Chen, H., Hooli, B., Asselin, C., Muffat, J., et al. (2014). A three-dimensional human neural cell culture model of Alzheimer’s disease. Nature 515, 274–278. https://doi.org/10.1038/nature13800.
- Zhao, J., Fu, Y., Yamazaki, Y., Ren, Y., Davis, M.D., Liu, C.-C., Lu, W., Wang, X., Chen, K., Cherukuri, Y., et al. (2020). APOE4 exacerbates synapse loss and neurodegeneration in Alzheimer’s disease patient iPSCderived cerebral organoids. Nat. Commun. 11, 5540. https://doi.org/10.1038/s41467-020-19264-0.
- Wulansari, N., Darsono, W.H.W., Woo, H.-J., Chang, M.-Y., Kim, J., Bae, E.-J., Sun, W., Lee, J.-H., Cho, I.-J., Shin, H., et al. (2021). Neurodevelopmental defects and neurodegenerative phenotypes in human brain organoids carrying Parkinson’s disease-linked DNAJC6 mutations. Sci. Adv. 7, eabb1540. https://doi.org/10.1126/sciadv.abb1540.
- Qian, X., Nguyen, H.N., Song, M.M., Hadiono, C., Ogden, S.C., Hammack, C., Yao, B., Hamersky, G.R., Jacob, F., Zhong, C., et al. (2016). Brain-Region-Specific Organoids Using Mini-bioreactors for Modeling ZIKV Exposure. Cell 165, 1238–1254. https://doi.org/10.1016/j.cell.2016.04.032.
- Velasco, S., Kedaigle, A.J., Simmons, S.K., Nash, A., Rocha, M., Quadrato, G., Paulsen, B., Nguyen, L., Adiconis, X., Regev, A., et al. (2019). Individual brain organoids reproducibly form cell diversity of the human cerebral cortex. Nature 570, 523–527. https://doi.org/10.1038/s41586- 019-1289-x.
- Giandomenico, S.L., Mierau, S.B., Gibbons, G.M., Wenger, L.M.D., Masullo, L., Sit, T., Sutcliffe, M., Boulanger, J., Tripodi, M., Derivery, E., et al. (2019). Cerebral organoids at the air-liquid interface generate diverse nerve tracts with functional output. Nat. Neurosci. 22, 669–679. https:// doi.org/10.1038/s41593-019-0350-2.
- Renner, M., Lancaster, M.A., Bian, S., Choi, H., Ku, T., Peer, A., Chung, K., and Knoblich, J.A. (2017). Self-organized developmental patterning and differentiation in cerebral organoids. EMBO J. 36, 1316–1329. https:// doi.org/10.15252/embj.201694700.
- Quadrato, G., Nguyen, T., Macosko, E.Z., Sherwood, J.L., Min Yang, S., Berger, D.R., Maria, N., Scholvin, J., Goldman, M., Kinney, J.P., et al. (2017). Cell diversity and network dynamics in photosensitive human brain organoids. Nature 545, 48–53. https://doi.org/10.1038/nature22047.
- Giandomenico, S.L., Sutcliffe, M., and Lancaster, M.A. (2021). Generation and long-term culture of advanced cerebral organoids for studying later stages of neural development. Nat. Protoc. 16, 579–602. https://doi.org/ 10.1038/s41596-020-00433-w.
- Kadoshima, T., Sakaguchi, H., Nakano, T., Soen, M., Ando, S., Eiraku, M., and Sasai, Y. (2013). Self-organization of axial polarity, inside-out layer pattern, and species-specific progenitor dynamics in human ES cellderived neocortex. Proc. Natl. Acad. Sci. USA 110, 20284–20289. https://doi.org/10.1073/pnas.1315710110.
- Pas‚ca, A.M., Sloan, S.A., Clarke, L.E., Tian, Y., Makinson, C.D., Huber, N., Kim, C.H., Park, J.-Y., O’Rourke, N.A., Nguyen, K.D., et al. (2015). Functional cortical neurons and astrocytes from human pluripotent stem cells in 3D culture. Nat. Methods 12, 671–678. https://doi.org/10.1038/ nmeth.3415.
- Birey, F., Andersen, J., Makinson, C.D., Islam, S., Wei, W., Huber, N., Fan, H.C., Metzler, K.R.C., Panagiotakos, G., Thom, N., et al. (2017). Assembly of functionally integrated human forebrain spheroids. Nature 545, 54–59. https://doi.org/10.1038/nature22330.
- Sloan, S.A., Andersen, J., Pașca, A.M., Birey, F., and Pașca, S.P. (2018). Generation and Assembly of Human Brain Region-Specific Three-Dimensional Cultures. Nat. Protoc. 13, 2062–2085. https://doi.org/10.1038/ s41596-018-0032-7.
- Jo, J., Xiao, Y., Sun, A.X., Cukuroglu, E., Tran, H.-D., Go¨ ke, J., Tan, Z.Y., Saw, T.Y., Tan, C.-P., Lokman, H., et al. (2016). Midbrain-like Organoids from Human Pluripotent Stem Cells Contain Functional Dopaminergic and Neuromelanin-Producing Neurons. Cell Stem Cell 19, 248–257. https://doi.org/10.1016/j.stem.2016.07.005.
- Muguruma, K., Nishiyama, A., Kawakami, H., Hashimoto, K., and Sasai, Y. (2015). Self-organization of polarized cerebellar tissue in 3D culture of human pluripotent stem cells. Cell Rep. 10, 537–550. https://doi.org/10. 1016/j.celrep.2014.12.051.
- Uzquiano, A., Kedaigle, A.J., Pigoni, M., Paulsen, B., Adiconis, X., Kim, K., Faits, T., Nagaraja, S., Anto´ n-Bolan˜ os, N., Gerhardinger, C., et al. (2022). Proper acquisition of cell class identity in organoids allows definition of fate specification programs of the human cerebral cortex. Cell 185, 3770–3788.e27. https://doi.org/10.1016/j.cell.2022.09.010. Resource
- Bhaduri, A., Andrews, M.G., Mancia Leon, W., Jung, D., Shin, D., Allen, D., Jung, D., Schmunk, G., Haeussler, M., Salma, J., et al. (2020). Cell stress in cortical organoids impairs molecular subtype specification. Nature 578, 142–148. https://doi.org/10.1038/s41586-020-1962-0.
- Chiaradia, I., Imaz-Rosshandler, I., Nilges, B.S., Boulanger, J., Pellegrini, L., Das, R., Kashikar, N.D., and Lancaster, M.A. (2023). Tissue morphology influences the temporal program of human brain organoid development. Cell Stem Cell 30, 1351–1367.e10. https://doi.org/10.1016/j.stem.2023. 09.003.
- Moore, S.A., and Iulianella, A. (2021). Development of the mammalian cortical hem and its derivatives: the choroid plexus, Cajal-Retzius cells and hippocampus. Open Biol. 11, 210042. https://doi.org/10.1098/rsob. 210042.
- Hou, P.-S., hAilı´n, D.O´ ., Vogel, T., and Hanashima, C. (2020). Transcription and Beyond: Delineating FOXG1 Function in Cortical Development and Disorders. Front. Cell. Neurosci. 14, 35. https://doi.org/10.3389/fncel. 2020.00035.
- Kang, T., Jensen, P., Huang, H., Lund Christensen, G., Billestrup, N., and Larsen, M.R. (2018). Characterization of the Molecular Mechanisms Underlying Glucose Stimulated Insulin Secretion from Isolated Pancreatic β-cells Using Post-translational Modification Specific Proteomics (PTMomics). Mol. Cell. Proteomics 17, 95–110. https://doi.org/10.1074/ mcp.RA117.000217.
- Fedorova, I., Hashimoto, A., Fecik, R.A., Hedrick, M.P., Hanus, L.O., Boger, D.L., Rice, K.C., and Basile, A.S. (2001). Behavioral evidence for the interaction of oleamide with multiple neurotransmitter systems. J. Pharmacol. Exp. Ther. 299, 332–342.
- Roy, A., Kundu, M., Chakrabarti, S., Patel, D.R., and Pahan, K. (2021). Oleamide, a sleep-inducing supplement, upregulates doublecortin in hippocampal progenitor cells via PPARα. J. Alzheimers Dis. 84, 1747–1762. https://doi.org/10.3233/JAD-215124.
- Fitzner, D., Bader, J.M., Penkert, H., Bergner, C.G., Su, M., Weil, M.-T., Surma, M.A., Mann, M., Klose, C., and Simons, M. (2020). Cell-Typeand Brain-Region-Resolved Mouse Brain Lipidome. Cell Rep. 32, 108132. https://doi.org/10.1016/j.celrep.2020.108132.
- Regad, T., Roth, M., Bredenkamp, N., Illing, N., and Papalopulu, N. (2007). The neural progenitor-specifying activity of FoxG1 is antagonistically regulated by CKI and FGF. Nat. Cell Biol. 9, 531–540. https://doi.org/10.1038/ ncb1573.
- Jogl, G., Hsiao, Y.-S., and Tong, L. (2004). Structure and function of carnitine acyltransferases. Ann. N. Y. Acad. Sci. 1033, 17–29. https://doi.org/ 10.1196/annals.1320.002.
- Agostini, M., Romeo, F., Inoue, S., Niklison-Chirou, M.V., Elia, A.J., Dinsdale, D., Morone, N., Knight, R.A., Mak, T.W., and Melino, G. (2016). Metabolic reprogramming during neuronal differentiation. Cell Death Differ. 23, 1502–1514. https://doi.org/10.1038/cdd.2016.36.
- Fame, R.M., Shannon, M.L., Chau, K.F., Head, J.P., and Lehtinen, M.K. (2019). A concerted metabolic shift in early forebrain alters the CSF proteome and depends on MYC downregulation for mitochondrial maturation. Dev. Camb. Engl. 146, dev182857. https://doi.org/10.1242/dev.182857.
- Helenius, A., and Aebi, M. (2001). Intracellular functions of N-linked glycans. Science 291, 2364–2369.
- Brix, B., Mesters, J.R., Pellerin, L., and Jo¨ hren, O. (2012). Endothelial cellderived nitric oxide enhances aerobic glycolysis in astrocytes via HIF1α-mediated target gene activation. J. Neurosci. 32, 9727–9735. https:// doi.org/10.1523/JNEUROSCI.0879-12.2012.
- Subramanian, L., Remedios, R., Shetty, A., and Tole, S. (2009). Signals from the edges: the cortical hem and antihem in telencephalic development. Semin. Cell Dev. Biol. 20, 712–718. https://doi.org/10.1016/j. semcdb.2009.04.001.
- Martynoga, B., Morrison, H., Price, D.J., and Mason, J.O. (2005). Foxg1 is required for specification of ventral telencephalon and region-specific regulation of dorsal telencephalic precursor proliferation and apoptosis. Dev. Biol. 283, 113–127. https://doi.org/10.1016/j.ydbio.2005.04.005.
- Zhao, X., Liang, W., Wang, W., Liu, H., Zhang, X., Liu, C., Zhu, C., Cui, B., Tang, Y., and Liu, S. (2022). Changes in and asymmetry of the proteome in the human fetal frontal lobe during early development. Commun. Biol. 5, 1031. https://doi.org/10.1038/s42003-022-04003-6.
- Isaacson, J.S., and Scanziani, M. (2011). How inhibition shapes cortical activity. Neuron 72, 231–243. https://doi.org/10.1016/j.neuron.2011. 09.027.
- Qian, X., Davis, A.A., Goderie, S.K., and Temple, S. (1997). FGF2 concentration regulates the generation of neurons and glia from multipotent cortical stem cells. Neuron 18, 81–93. https://doi.org/10.1016/s0896- 6273(01)80048-9.
- Greenwood, S., Swetloff, A., Wade, A.M., Terasaki, T., and Ferretti, P. (2008). Fgf2 is expressed in human and murine embryonic choroid plexus and affects choroid plexus epithelial cell behaviour. Cerebrospinal Fluid Res. 5, 20. https://doi.org/10.1186/1743-8454-5-20.
- Yoon, S.-J., Elahi, L.S., Pașca, A.M., Marton, R.M., Gordon, A., Revah, O., Miura, Y., Walczak, E.M., Holdgate, G.M., Fan, H.C., et al. (2019). Reliability of human cortical organoid generation. Nat. Methods 16, 75–78. https://doi.org/10.1038/s41592-018-0255-0.
- Yu, X., and Zecevic, N. (2011). Dorsal Radial Glial Cells Have the Potential to Generate Cortical Interneurons in Human But Not in Mouse Brain. J. Neurosci. 31, 2413–2420. https://doi.org/10.1523/JNEUROSCI.5249- 10.2011.
- Jain, A., Gut, G., Sanchis-Calleja, F., Okamoto, R., Streib, S., He, Z., Zenk, F., Santel, M., Seimiya, M., Holtackers, R., et al. (2023). Morphodynamics of human early brain organoid development. Preprint at bioRxiv. https:// doi.org/10.1101/2023.08.21.553827.
- Zheng, X., Boyer, L., Jin, M., Mertens, J., Kim, Y., Ma, L., Ma, L., Hamm, M., Gage, F.H., and Hunter, T. (2016). Metabolic reprogramming during neuronal differentiation from aerobic glycolysis to neuronal oxidative phosphorylation. eLife 5, e13374. https://doi.org/10.7554/eLife.13374.
- Beckervordersandforth, R., Ebert, B., Scha¨ ffner, I., Moss, J., Fiebig, C., Shin, J., Moore, D.L., Ghosh, L., Trinchero, M.F., Stockburger, C., et al. (2017). Role of Mitochondrial Metabolism in the Control of Early Lineage Progression and Aging Phenotypes in Adult Hippocampal Neurogenesis. Neuron 93, 560–573.e6. https://doi.org/10.1016/j.neuron.2016.12.017.
- Deus, C.M., Yambire, K.F., Oliveira, P.J., and Raimundo, N. (2020). Mitochondria-Lysosome Crosstalk: From Physiology to Neurodegeneration. Trends Mol. Med. 26, 71–88. https://doi.org/10.1016/j.molmed.2019. 10.009.
- Cornford, E.M., Varesi, J.B., Hyman, S., Damian, R.T., and Raleigh, M.J. (1997). Mitochondrial content of choroid plexus epithelium. Exp. Brain Res. 116, 399–405. https://doi.org/10.1007/pl00005768.
- Eraso-Pichot, A., Braso´ -Vives, M., Golbano, A., Menacho, C., Claro, E., Galea, E., and Masgrau, R. (2018). GSEA of mouse and human mitochondriomes reveals fatty acid oxidation in astrocytes. Glia 66, 1724–1735. https://doi.org/10.1002/glia.23330.
- Fecher, C., Trovo` , L., Mu¨ ller, S.A., Snaidero, N., Wettmarshausen, J., Heink, S., Ortiz, O., Wagner, I., Ku¨ hn, R., Hartmann, J., et al. (2019). Cell-type-specific profiling of brain mitochondria reveals functional and molecular diversity. Nat. Neurosci. 22, 1731–1742. https://doi.org/10. 1038/s41593-019-0479-z.
- Xie, Z., Jones, A., Deeney, J.T., Hur, S.K., and Bankaitis, V.A. (2016). Inborn Errors of Long-Chain Fatty Acid β-Oxidation Link Neural Stem Cell Self-Renewal to Autism. Cell Rep. 14, 991–999. https://doi.org/10. 1016/j.celrep.2016.01.004.
- Guo, N., McDermott, K.D., Shih, Y.-T., Zanga, H., Ghosh, D., Herber, C., Meara, W.R., Coleman, J., Zagouras, A., Wong, L.P., et al. (2022). Transcriptional regulation of neural stem cell expansion in the adult hippocampus. eLife 11, e72195. https://doi.org/10.7554/eLife.72195.
- Goyal, M.S., Hawrylycz, M., Miller, J.A., Snyder, A.Z., and Raichle, M.E. (2014). Aerobic glycolysis in the human brain is associated with development and neotenous gene expression. Cell Metab. 19, 49–57. https://doi. org/10.1016/j.cmet.2013.11.020.
- Kim, J.w., Tchernyshyov, I., Semenza, G.L., and Dang, C.V. (2006). HIF-1- mediated expression of pyruvate dehydrogenase kinase: a metabolic switch required for cellular adaptation to hypoxia. Cell Metab. 3, 177–185. https://doi.org/10.1016/j.cmet.2006.02.002.
- Papandreou, I., Cairns, R.A., Fontana, L., Lim, A.L., and Denko, N.C. (2006). HIF-1 mediates adaptation to hypoxia by actively downregulating mitochondrial oxygen consumption. Cell Metab. 3, 187–197. https://doi. org/10.1016/j.cmet.2006.01.012.
- O’Hagan, K.A., Cocchiglia, S., Zhdanov, A.V., Tambuwala, M.M., Cummins, E.P., Monfared, M., Agbor, T.A., Garvey, J.F., Papkovsky, D.B., Taylor, C.T., and Allan, B.B. (2009). PGC-1α is coupled to HIF-1α-dependent gene expression by increasing mitochondrial oxygen consumption in skeletal muscle cells. Proc. Natl. Acad. Sci. 106, 2188–2193. https://doi.org/ 10.1073/pnas.0808801106.
- Yasui, T., Uezono, N., Nakashima, H., Noguchi, H., Matsuda, T., Noda-Andoh, T., Okano, H., and Nakashima, K. (2017). Hypoxia Epigenetically Confers Astrocytic Differentiation Potential on Human Pluripotent CellDerived Neural Precursor Cells. Stem Cell Rep. 8, 1743–1756. https:// doi.org/10.1016/j.stemcr.2017.05.001.
- Pas‚ca, A.M., Park, J.-Y., Shin, H.-W., Qi, Q., Revah, O., Krasnoff, R., O’Hara, R., Willsey, A.J., Palmer, T.D., and Pas‚ ca, S.P. (2019). Human 3D cellular model of hypoxic brain injury of prematurity. Nat. Med. 25, 784–791. https://doi.org/10.1038/s41591-019-0436-0.
- McGuire, J.L., Depasquale, E.A., Funk, A.J., O’Donnovan, S.M., Hasselfeld, K., Marwaha, S., Hammond, J.H., Hartounian, V., Meador-Woodruff, J.H., Meller, J., and McCullumsmith, R.E. (2017). Abnormalities of signal transduction networks in chronic schizophrenia. NPJ Schizophr. 3, 30. https://doi.org/10.1038/s41537-017-0032-6.
- Blaze, J., and Akbarian, S. (2022). The tRNA regulome in neurodevelopmental and neuropsychiatric disease. Mol. Psychiatry 27, 3204–3213. https://doi.org/10.1038/s41380-022-01585-9.
- Narayan, S., Head, S.R., Gilmartin, T.J., Dean, B., and Thomas, E.A. (2009). Evidence for Disruption of Sphingolipid Metabolism in Schizophrenia. J. Neurosci. Res. 87, 278–288. https://doi.org/10.1002/jnr.21822.
- Castillo, R.I., Rojo, L.E., Henriquez-Henriquez, M., Silva, H., Maturana, A., Villar, M.J., Fuentes, M., and Gaspar, P.A. (2016). From Molecules to the Clinic: Linking Schizophrenia and Metabolic Syndrome through Sphingolipids Metabolism. Front. Neurosci. 10, 488. https://doi.org/10.3389/fnins. 2016.00488.
- Huang, Q., Chen, Z., Cheng, P., Jiang, Z., Wang, Z., Huang, Y., Yang, C., Pan, J., Qiu, F., and Huang, J. (2019). LYRM2 directly regulates complex I activity to support tumor growth in colorectal cancer by oxidative phosphorylation. Cancer Lett. 455, 36–47. https://doi.org/10.1016/j.canlet. 2019.04.021.
- Dibley, M.G., Formosa, L.E., Lyu, B., Reljic, B., McGann, D., MuellnerWong, L., Kraus, F., Sharpe, A.J., Stroud, D.A., and Ryan, M.T. (2020). The Mitochondrial Acyl-carrier Protein Interaction Network Highlights Important Roles for LYRM Family Members in Complex I and Mitoribosome Assembly. Mol. Cell. Proteomics 19, 65–77. https://doi.org/10. 1074/mcp.RA119.001784.
- Park, C.B., Asin-Cayuela, J., Ca´ mara, Y., Shi, Y., Pellegrini, M., Gaspari, M., Wibom, R., Hultenby, K., Erdjument-Bromage, H., Tempst, P., et al. (2007). MTERF3 is a negative regulator of mammalian mtDNA transcription. Cell 130, 273–285. https://doi.org/10.1016/j.cell.2007.05.046.
- Roberts, R.C. (2021). Mitochondrial dysfunction in schizophrenia: with a focus on postmortem studies. Mitochondrion 56, 91–101. https://doi. org/10.1016/j.mito.2020.11.009.
- Kondo, M.A., Norris, A.L., Yang, K., Cheshire, M., Newkirk, I., Chen, X., Ishizuka, K., Jaffe, A.E., Sawa, A., and Pevsner, J. (2022). Dysfunction of mitochondria and GABAergic interneurons in the anterior cingulate cortex of individuals with schizophrenia. Neurosci. Res. 185, 67–72. https://doi. org/10.1016/j.neures.2022.09.011.
- Heissel, S., Bunkenborg, J., Kristiansen, M.P., Holmbjerg, A.F., Grimstrup, M., Mørtz, E., Kofoed, T., and Højrup, P. (2018). Evaluation of spectral libraries and sample preparation for DIA-LC-MS analysis of host cell proteins: A case study of a bacterially expressed recombinant biopharmaceutical protein. Protein Expr. Purif. 147, 69–77. https://doi.org/10.1016/j.pep. 2018.03.002.
- Barrett, T., Wilhite, S.E., Ledoux, P., Evangelista, C., Kim, I.F., Tomashevsky, M., Marshall, K.A., Phillippy, K.H., Sherman, P.M., Holko, M., et al. (2013). NCBI GEO: archive for functional genomics data sets–update. Nucleic Acids Res. 41, D991–D995. https://doi.org/10.1093/nar/gks1193.
- Schmidt, S.I., Bogetofte, H., Ritter, L., Agergaard, J.B., Hammerich, D., Kabiljagic, A.A., Wlodarczyk, A., Lopez, S.G., Sørensen, M.D., Jørgensen, M.L., et al. (2021). Microglia-Secreted Factors Enhance Dopaminergic Differentiation of Tissue- and iPSC-Derived Human Neural Stem Cells. Stem Cell Rep. 16, 281–294. https://doi.org/10.1016/j.stemcr.2020.12.011.
- UniProt Consortium (2021). UniProt: the universal protein knowledgebase in 2021. Nucleic Acids Res. 49, D480–D489. https://doi.org/10.1093/nar/ gkaa1100.
- Schwa¨ mmle, V., Hagensen, C.E., Rogowska-Wrzesinska, A., and Jensen, O.N. (2020). PolySTest: Robust Statistical Testing of Proteomics Data with Missing Values Improves Detection of Biologically Relevant Features. Mol. Cell. Proteomics MCP 19, 1396–1408. https://doi.org/10.1074/mcp. RA119.001777.
- Doncheva, N.T., Morris, J.H., Gorodkin, J., and Jensen, L.J. (2019). Cytoscape StringApp: Network Analysis and Visualization of Proteomics Data. J. Proteome Res. 18, 623–632. https://doi.org/10.1021/acs.jproteome. 8b00702.
- Bindea, G., Mlecnik, B., Hackl, H., Charoentong, P., Tosolini, M., Kirilovsky, A., Fridman, W.-H., Page` s, F., Trajanoski, Z., and Galon, J. (2009). ClueGO: a Cytoscape plug-in to decipher functionally grouped gene ontology and pathway annotation networks. Bioinformatics 25, 1091– 1093. https://doi.org/10.1093/bioinformatics/btp101.
- R Core Team (2021). R: A Language and Environment for Statistical Computing (R Foundation for Statistical Computing). https://www.Rproject.org.
- Wickham, H. (2016). ggplot2: Elegant Graphics for Data Analysis (Springer-Verlag). https://ggplot2.tidyverse.org.
- Kind, T., Liu, K.-H., Lee, D.Y., DeFelice, B., Meissen, J.K., and Fiehn, O. (2013). LipidBlast - in-silico tandem mass spectrometry database for lipid identification. Nat. Methods 10, 755–758. https://doi.org/10.1038/ nmeth.2551.
- Ruttkies, C., Schymanski, E.L., Wolf, S., Hollender, J., and Neumann, S. (2016). MetFrag relaunched: incorporating strategies beyond in silico fragmentation. J. Cheminform. 8, 3. https://doi.org/10.1186/s13321-016- 0115-9.
- Chong, J., Wishart, D.S., and Xia, J. (2019). Using MetaboAnalyst 4.0 for Comprehensive and Integrative Metabolomics Data Analysis. Curr. Protoc. Bioinforma. 68, e86. https://doi.org/10.1002/cpbi.86.
- Rosenberg, A.B., Roco, C.M., Muscat, R.A., Kuchina, A., Sample, P., Yao, Z., Graybuck, L.T., Peeler, D.J., Mukherjee, S., Chen, W., et al. (2018). Single-cell profiling of the developing mouse brain and spinal cord with splitpool barcoding. Science 360, 176–182. https://doi.org/10.1126/science. aam8999.
- Hao, Y., Hao, S., Andersen-Nissen, E., Mauck, W.M., Zheng, S., Butler, A., Lee, M.J., Wilk, A.J., Darby, C., Zager, M., et al. (2021). Integrated analysis of multimodal single-cell data. Cell 184, 3573–3587.e29. https://doi.org/ 10.1016/j.cell.2021.04.048.
- Trapnell, C., Cacchiarelli, D., Grimsby, J., Pokharel, P., Li, S., Morse, M., Lennon, N.J., Livak, K.J., Mikkelsen, T.S., and Rinn, J.L. (2014). The dynamics and regulators of cell fate decisions are revealed by pseudotemporal ordering of single cells. Nat. Biotechnol. 32, 381–386. https://doi. org/10.1038/nbt.2859.
- Luan, H., Ji, F., Chen, Y., and Cai, Z. (2018). statTarget: A streamlined tool for signal drift correction and interpretations of quantitative mass spectrometry-based omics data. Anal. Chim. Acta 1036, 66–72. https://doi. org/10.1016/j.aca.2018.08.002.
- Konala, V.B.R., Nandakumar, S., Surendran, H., and Pal, R. (2022). Derivation of Induced Pluripotent Stem Cell (iPSC) Lines from Patient-Specific Peripheral Blood Mononuclear Cells (PBMC) Using Episomal Vectors. In Induced Pluripotent Stem Cells and Human Disease: Methods and Protocols, K. Turksen, ed. (Springer US), pp. 137–151. https://doi.org/10.1007/ 7651_2021_385.
- Schneider, C.A., Rasband, W.S., and Eliceiri, K.W. (2012). NIH Image to ImageJ: 25 years of image analysis. Nat. Methods 9, 671–675. https:// doi.org/10.1038/nmeth.2089.
- Perez-Riverol, Y., Bai, J., Bandla, C., Garcı´a-Seisdedos, D., Hewapathirana, S., Kamatchinathan, S., Kundu, D.J., Prakash, A., Frericks-Zipper, A., Eisenacher, M., et al. (2022). The PRIDE database resources in 2022: a hub for mass spectrometry-based proteomics evidences. Nucleic Acids Res. 50, D543–D552. https://doi.org/10.1093/nar/gkab1038.
¶ STAR★METHODS
¶ KEY RESOURCES TABLE
| REAGENT or RESOURCE | SOURCE | IDENTIFIER |
|---|---|---|
| Rat monoclonal anti-CTIP2 | Abcam | Cat# ab18465, RRID: AB_2064130 |
| Rabbit polyclonal anti-DCX | Cell Signaling Technology | Cat# 4604, RRID: AB_561007 |
| Rabbit monoclonal anti-FOXG1 | Thermo Fischer Scientific | Cat# 702554, RRID: AB_2686304 |
| Mouse monoclonal anti-MAP2ab | Millipore Sigma | Cat# M1406, RRID: AB_477171 |
| Mouse monoclonal anti-GFAP | Invitrogen | Cat# MA5-15086, RRID: AB_10981734 |
| Mouse monoclonal anti-N-Cadherin | Cell Signaling Technology | Cat# 14215, RRID: AB_2798427 |
| Rabbit monoclonal anti-NeuN | Cell Signaling Technology | Cat# 24307, RRID: AB_2651140 |
| Rabbit polyclonal anti-Homer1 | Synaptic Systems | Cat# 160 003, RRID: AB_887730 |
| Rabbit polyclonal anti-SATB2 | Abcam | Cat# ab34735, RRID: AB_2304117 |
| Guinea pig polyclonal anti-SYN1/2 | Synaptic Systems | Cat# 106 004, RRID: AB_1106784 |
| Rabbit recombinant monoclonal anti-TBR1 | Abcam | Cat# ab183032, RRID: AB_2936859 |
| Rabbit recombinant monoclonal anti-TOMM20 | Abcam | Cat# ab186735, RRID: AB_2889972 |
| Rabbit polyclonal anti-SOX2 | Abcam | Cat# ab97959, RRID: AB_2341193 |
| Sheep polyclonal anti-TBR2 | R&D Systems | Cat# AF6166, RRID: AB_10569705 |
| Mouse monoclonal anti-HuC/D | Thermo Fisher Scientific | Cat# A-21271, RRID: AB_221448 |
| Mouse monoclonal anti-OCT3/4 | Santa Cruz Biotechnology | Cat# sc-5279, RRID: AB_628051 |
| Goat polyclonal anti-NANOG | R&D Systems | Cat# AF1997, RRID: AB_355097 |
| Mouse monoclonal anti-TRA-1-60 | BioLegend | Cat# 330602, RRID: AB_1186144 |
| Mouse monoclonal anti-Nestin | Millipore | Cat# MAB5326, RRID: AB_2251134 |
| Mouse monoclonal anti-SMA | Agilent | Cat# M0851, RRID: AB_23500 |
| Rabbit polyclonal anti-AFP | Agilent | Cat# A0008, RRID: AB_2650473 |
| Goat anti-Rabbit IgG (H + L), Alexa Fluor 488 | Thermo Fisher Scientific | Cat# A-11008, RRID: AB_143165 |
| Goat anti-Rat IgG (H + L), Alexa Fluor 568 | Thermo Fisher Scientific | Cat# A-11077, RRID: AB_2534121 |
| Goat anti-Mouse IgG (H + L), Alexa Fluor 568 | Thermo Fisher Scientific | Cat# A-11004, RRID: AB_2534072 |
| Goat anti-Rabbit IgG (H + L), Alexa Fluor 647 | Thermo Fisher Scientific | Cat# A-21245, RRID: AB_2535813 |
| Goat anti-Mouse IgG (H + L), Alexa Fluor 647 | Thermo Fisher Scientific | Cat# A-21202, RRID: AB_141607 |
| Donkey anti-Rabbit IgG (H + L), Alexa Fluor 647 | Thermo Fisher Scientific | Cat# A-31573, RRID: AB_2536183 |
| Donkey anti-Goat IgG (H + L), Alexa Fluor 568 | Thermo Fisher Scientific | Cat# A-11057, RRID: AB_2534104 |
| Donkey anti-Sheep IgG (H + L), Alexa Fluor 488 | Thermo Fisher Scientific | Cat# A-11015, RRID: AB_2534082 |
| Donkey anti-Goat IgG (H + L), Alexa Fluor 594 | Thermo Fisher Scientific | Cat# A-11058, RRID: AB_2534105 |
| Donkey anti-Mouse IgG (H + L), Alexa Fluor 594 | Thermo Fisher Scientific | Cat# A-21203, RRID: AB_2535789 |
| Donkey anti-Rabbit IgG (H + L), Alexa Fluor 488 | Thermo Fisher Scientific | Cat# A-21206, RRID: AB_2535792 |
| Goat anti-Guinea pig IgG (H + L), Alexa Fluor 488 | Abcam | Cat# ab150185, RRID: AB_2736871 |
| Mouse monoclonal HRP Anti-γ-antibody | Abcam | Cat# ab49900, RRID: AB_867494 |
| Rabbit monoclonal anti-GAPDH | Cell Signaling Technology | Cat# 21185, RRID: AB_561053 |
| Rabbit recombinant monoclonal anti-SYN1 | Abcam | Cat# ab254349, RRID: AB_2920663 |
| Rabbit polyclonal anti-HIF1alpha | Abcam | Cat# ab51608, RRID: AB_880418 |
| Rabbit polyclonal anti-GFAP | Agilent | Cat# Z0334, RRID: AB_10013382 |
| Rabbit recombinant monoclonal anti-S100B | Cell Signaling Technology | Cat# 90939, RRID: AB_3678716 |
| Rabbit polyclonal anti-LAMP1 | Abcam | Cat# ab24170, RRID: AB_775978 |
| Goat anti-Rabbit IgG, HRP-linked Antibody | Cell Signaling Technology | Cat# 7074, RRID: AB_2099923 |
| Rabbit anti-Mouse IgG H&L, HRP-linked | Abcam | Cat# ab6728, RRID: AB_955440 |
| Matrigel® Growth factor reduced | Corning | 356230 |
| mTESR1 medium | Stem Cell Technologies | 85870 |
| Gentle cell dissociation reagent | Stem Cell Technologies | 07174 |
| Cerebral Organoid Kit | Stem Cell Technologies | 08570 |
| Y-27632, ROCK Inhibitor | Stem Cell Technologies | 72302 |
| Anti-Adherence Rinsing Solution | Stem Cell Technologies | 07010 |
| Matrigel® | Corning | 356234 |
| Penicillin/Streptomycin | Gibco | 15400 |
| Amphotericin B | Thermo Fisher Scientific | 15290026 |
| STEMdiff Dorsal FO Differentiation Kit | Stem Cell Technologies | 08620 |
| STEMdiff Neural Organoid Maintenance Kit | Stem Cell Technologies | 100-0120 |
| Distilled Phosphate Buffered Saline | Thermo Fisher Scientific | 14190 |
| Methylated trypsin | Made in-house, Protein Research Group, University of Southern Denmark¹⁰ | N/A |
| TMTpro 16plex | Thermo Fisher Scientific | A44520 |
| TMTpro-134C & TMTpro-135N Label Reagents | Thermo Fisher Scientific | A52046 |
| Titanium dioxide beads, 5 μm | GL Science | 5020-75010 |
| PNGaseF | New England BioLabs | P0705L |
| Sialidase A | Prozyme | GK80040 |
| SPLASH LIPIDOMIX MS standard | Merck | 330707-1EA |
| NuPage LDS Sample buffer | Thermo Fisher Scientific | NP0007 |
| NuPage Sample Reducing agent | Thermo Fisher Scientific | NP0004 |
| PageRuler Plus pre-stained protein ladder | Thermo Fisher Scientific | 26620 |
| SeeBlue® Plus2 Pre-stained Protein Standard | Invitrogen | LC5925 |
| Immobilion ECL Ultra Western HRP Substrate | Millipore | WBKULS0100 |
| Agriose base | Sigma | 93352 |
| Trizma, low-gelling temperature | Sigma | A9414 |
| Hanks’ Balanced Salt Solution (HBSS) | Thermo Fisher Scientific | 14025 |
| Poly-L-lysine hydrobromide | Sigma | P1274 |
| Laminin | Sigma | L2020 |
| Formaldehyde Solution 16% w/v | Thermo Fisher Scientific | 28908 |
| Phosphate buffered saline | Gibco | 70011-036 |
| OCT Mounting media | VWR | 361603E |
| Triton X-100 | Plusone | 17-1315-01 |
| Donkey serum | BioWest | S2170-100 |
| Goat serum | Gibco | 16210064 |
| ProLong Diamond Antifade mount | Invitrogen | P36965 |
| Dulbecco’s Phosphate Buffered Saline (PBS-/-) | Sigma Aldrich | D8537 |
| Fetal bovine serum | Thermo Fisher Scientific | 11573397 |
| Lymphoprep™ Density Gradient Medium | Stem Cell Technologies | 07801 |
| StemPro-34 SFM | Thermo Fisher Scientific | 10639011 |
| Human Stem Cell Factor (SCF) Synthetic Peptide | Peprotech | 300-07 |
| Recombinant Human Flt3-Ligand | Peprotech | 300-19 |
| Interleukin-3 | Cell Guidance system | GFH180-100 |
| Recombinant Human GM-CSF | Peprotech | 300-03 |
| L-glutamine | Thermo Fisher Scientific | 25030081 |
| Penicillin/Streptomycin | Sigma Aldrich | P0781 |
| ROCK inhibitor (ROCKi) | Sigma Aldrich | Y0503 |
| Sodium Butyrate | Sigma Aldrich | 303410 |
| DMEM/F12 | Thermo Fisher Scientific | 11320033 |
| Bovine serum albumin (BSA) | Sigma Aldrich | A3059 |
| Critical commercial assays | ||
| LDH-Glo™ Cytotoxicity Assay | Promega | J2380 |
| ROS-Glo® H2O2 Assay | Promega | G8820 |
| Seahorse XF Real-Time ATP Rate Assay Starter Pack | Agilent | 103677-100 |
| Seahorse XFe96 FluxPak | Agilent | 102601-100 |
| P3 Primary Cell 4D X Nucleofector Kit L | BioNordika | LZG-V4XP-3024 |
| DNeasy Blood and Tissue Kit | Qiagen | 69506 |
| Evercode™ Cell fixation kit | Parse Biosciences | ECF2001 |
| Evercode™ WT Mini v2 kit | Parse Biosciences | https://www.parsebiosciences.com/products/evercode-wt-mini/ |
| Deposited data | ||
| Proteomics raw data | This paper | PRIDE: PXD048559 |
| scRNAseq raw data | This paper | Gene Expression Omnibus,⁷¹ GEO: GSE253889 |
| Fetal frontal lobe proteomic dataset | Zhao et al.⁴⁰ | https://www.nature.com/articles/s42003-022-04003-6 |
| Experimental models: Cell lines | ||
| IMR90 clone 4 | WiCell | iPS(IMR90)-4; RRID: CVCL_C437 |
| SCZ002 (schizophrenia, male) | This paper | N/A |
| SCZ003 (schizophrenia, male) | This paper | N/A |
| SCZ013 (schizophrenia, male) | This paper | N/A |
| CTL005 (healthy, female) | This paper | N/A |
| CTL014 (healthy, male) | This paper | N/A |
| CTL024 (healthy, female) | This paper | N/A |
| hVM-bcl-xl midbrain neural precursor line | Schmidt et al.⁷² | https://doi.org/10.1016/j.stemcr.2020.12.011 |
| Recombinant DNA | ||
| pCXLE-hOCT3/4-shp53 | Addgene | RRID: Addgene_27077 |
| pCXLE-hSK | Addgene | RRID: Addgene_27078 |
| pCXLE-hUL | Addgene | RRID: Addgene_27080 |
| pCXBB-EBNA1 | Addgene | RRID: Addgene_41857 |
| Software and algorithms | ||
| BrainWave 5 software | 3Brain | N/A |
| ImageJ (v1.53t and 1.54p) | NIH | https://imagej.net/ij/index.html |
| GraphPad Prism (v.) | Graph Pad Software, LLC | https://www.graphpad.com/features |
| Motic Images Plus (v3.0) | Motic | https://www.motic.com/Eur_EuropeDownload/ |
| Xcalibur (v3.0) | Thermo Fisher Scientific | Thermo Fisher Scientific |
| Proteome Discoverer (v2.4) | Thermo Fisher Scientific | https://www.thermofisher.com/dk/en/home/institutional/mass-spectrometry/liquid-chromatography-mass-spectrometry-lc-ms/lc-ms-software/multi-omics-data-analysis/proteome-discoverer-software.html.html?erpType=Global_E1 |
| Mascot server (v2.6) | Matrix Science Ltd. | https://www.matrixscience.com/server.html |
| UniProt database | The UniProt Consortium⁷³ | https://www.uniprot.org/ |
| REAGENT or RESOURCE | SOURCE | IDENTIFIER |
| PolyTest | Schwämmle et al.⁷⁴ | https://computproteomics.bmb.sdu.dk/app_direct/PolyTest/ |
| Cytoscape (v3.9.1) | Cytoscape Consortium | https://cytoscape.org/ |
| StringApp, Cytoscape app | Doncheva et al.⁷⁵ | https://apps.cytoscape.org/apps/stringapp |
| ClueGO, Cytoscape app | Bindea et al.⁷⁶ | https://apps.cytoscape.org/apps/cluego |
| R software (v2025.09.2 + 418) | R Core Team⁷⁷ | https://cloud.r-project.org/bin/windows/base/ |
| ggplot2, R package | Wickham⁷⁸ | https://cran.r-project.org/web/packages/ggplot2/index.html |
| Metaboscape (v2023) | Bruker | https://www.bruker.com/en/products-and-solutions/mass-spectrometry/ms-software/metaboscape.html |
| LipidBlast MS2 library | Kind et al.⁷⁹ | https://doi.org/10.1038/nmeth.2551 |
| MetaboBase MS/MS library | Bruker | https://www.bruker.com/en/products-and-solutions/mass-spectrometry/ms-software/metabolomics-spectral-libraries.html |
| NIST17 MS/MS library | Bruker | https://chemdata.nist.gov/ |
| MassBank of North America (MoNA) | MoNA | https://mona.fiehnlab.ucdavis.edu/ |
| MetFrag | Ruttkies et al.⁸⁰ | https://ipb-halle.github.io/MetFrag/ |
| Metabo-pipe (v0.3.1) | Chong et al.⁸¹ | |
| Split-pipe (v1.0.6p) | Hao et al.⁸², Parse Biosciences | https://www.encodeproject.org/software/split-pipe/ |
| Seurat, R package | Hao et al.⁸³, Trapnell et al.⁸⁴ | https://cran.r-project.org/web/packages/Seurat/index.html |
| StatTarget | Luan et al.⁸⁵ | https://bioconductor.org/packages//release/bioc/html/StatTarget.html |
| Monocle3 | Hao et al.⁸³, Trapnell et al.⁸⁴ | https://cole-trapnell-lab.github.io/monocle3/ |
| Image Lab software | Bio-Rad | https://www.bio-rad.com/en-dk/product/image-lab-software?ID=KRE6P5E8Z |
| Other | ||
| Aggrewell™800 24-well plates | Stem Cell Technologies | 34815 |
| NanoPhotometer N60/N50 | Implen | N/A |
| Oasis HLB column | Waters | 186000132 |
| Empore™ SPE disks C8 | Sigma | 66882-U |
| Empore™ SPE disks C18 | Sigma | 66883-U |
| Oligo™ R3 material | Applied Biosystems | 1-1339-03 |
| Acquity UPLC®-Class CSHTM C18 column | Waters | N/A |
| Dionex Ultimate 3000 HPLC system | Thermo Fisher Scientific | SKU: 20773 |
| Bolt 4-12% Bis-Tris Plus Gels | Thermo Fisher Scientific | NW04125BOX |
| Trans-Blot® Turbo™ Transfer System | BioRad | 1704150 |
| CCD camera, Amersham 680 Imager | GE Healthcare | 29270769 |
| Fluostar Omega Plate reader | BMG Labtech | N/A |
| Leica VT1000S Vibratome | Leica Biosystems | N/A |
| BioCam Duplex MEA system | 3Brain | N/A |
| CorePlate 1W 38/60 microchip plates | 3Brain | N/A |
| Leica CM1860 cryostat | Leica Biosystems | N/A |
| Superfrost® Plus Microscope slides | Thermo Fisher Scientific | J1800AMNZ |
| SepMate™-50 columns | Stem Cell Technologies | 85450 |
| 4D-Nucleofector™ X Unit | BioNordika | LZG-AAF-1003X |
| 70 µm Cell Strainer | Fisherbrand | 11597522 |
| Zeiss LSM 700 confocal microscope | Zeiss | N/A |
| CytoScan 750K Suite | Thermo Fisher Scientific | N/A |
| Nikon A1R confocal unit | Nikon | N/A |
| Nikon Ti-2 LFOV microscope | Nikon | N/A |
| Motic AE2000 microscope | Motic® | N/A |
| Reprosil-Pur 120 C18-AQ, 5 μm | Dr. Maisch GmbH | https://dr-maisch.com/dr-maisch-phases/reprosil-pur/reprosil-pur-120-c18-aq |
| Reprosil-Pur 120 C18-AQ, 3 μm | Dr. Maisch GmbH | https://dr-maisch.com/dr-maisch-phases/reprosil-pur/reprosil-pur-120-c18-aq |
| EASY-nLC | Thermo Fischer Scientific | N/A |
| Orbitrap Exploris 480 | Thermo Fischer Scientific | N/A |
| Vanquish Horizon UPLC | Thermo Fischer Scientific | N/A |
| TimsTOF Flex | Bruker | N/A |
| Trans-Blot® Turbo™ Transfer System | Bio-Rad | N/A |
| Amersham 680 Imager | GE Healthcare | N/A |
| BioCam Duplex MEA system | 3Brain | N/A |
| NextSeq 2000 sequencer | Illumina | N/A |
| P2 flowcell | Illumina | N/A |
¶ EXPERIMENTAL MODEL AND STUDY PARTICIPANT DETAILS
¶ iPSC maintenance
The human iPSC line IMR90 clone 4 was purchased from WiCell and maintained on growth factor reduced Matrigel-coated plates (Corning) in mTESR1 medium (Stem Cell Technologies). Passaging was performed using Gentle cell dissociation reagent (Stem Cell Technologies). Cell culture and differentiation was performed by multiple experimenters, ensuring that the observed differences were not attributable to a single researcher’s approach.
¶ Schizophrenia patients and healthy controls
The inclusion of patients with schizophrenia and age matched healthy controls for generation of hiPSC lines is approved by The Regional Committee on Health Research Ethics in the Southern Region of Denmark (j.no: S-20220037) and The Danish Data Protection Agency (j.no: P-2022-765). Patients diagnosed with schizophrenia were recruited from psychiatric in- and outpatient clinics in the Capital Region of Denmark, whereas healthy controls were recruited via a Danish website (Forsøgsperson.dk). All participants had to be 18–50 years of age and came from the same community. Patients and healthy controls all had thorough psychiatric evaluation including WHO Schedules for Clinical Assessment in Neuropsychiatry (SCAN, version 2.1), covering the last 4 weeks and performed by certified interviewers. For patients, the interview was used to validate the schizophrenia diagnosis given by clinical doctors prior to inclusion (according to the International Classification of Diseases, Tenth Revision (ICD10) F20), while for healthy controls the purpose was to rule out psychiatric disorders. Healthy controls were age matched to the included patients with schizophrenia. Venous blood samples were collected from all participants with at least 34 mL of blood collected at the research facilities of the Copenhagen Research Center for Biological and Precision Psychiatry, Mental Health Center Copenhagen, Copenhagen University Hospital and immediately transported to the facilities at the Department for Veterinary and Animal Science, University of Copenhagen, for further processing.
¶ METHOD DETAILS
¶ Peripheral blood mononuclear cell isolation
34 mL of whole blood was diluted 1:1 in Dulbecco′ s Phosphate Buffered Saline (PBS− /− ) (Sigma Aldrich) supplemented with 2% Fetal bovine serum (FBS) (Thermo Fisher Scientific) and then added slowly into 2 separate SepMate-50 columns (Stem Cell Technologies), containing 15 mL Lymphoprep(Stem Cell Technologies). The samples were then centrifuged at 1200 x g for 10 min at room temperature. Following centrifugation, the top layer was transferred to a 50 mL falcon tube, diluted with PBS supplemented with 2% FBS, and centrifuged again. This step was performed twice to ensure thorough removal of any residual contaminants from the isolated peripheral blood mononuclear cells (PBMCs).
¶ Episomal reprogramming
hiPSCs were established using episomal reprogramming of PBMCs obtained from three schizophrenia individuals and their age and sex matched controls (Figure S4D).
4 × 10⁶ isolated PBMCs were cultured in PBMC media consisting of StemPro-34 SFM (Thermo Fisher Scientific) media supplemented with 100 ng/mL Human Stem Cell Factor Synthetic Peptide (Peprotech), 100 ng/mL Recombinant Human Flt3-Ligand (Peprotech), 20 ng/mL Interleukin-3 (Cell Guidance system), 1 ng/mL Recombinant Human GM-CSF - 20μg (Peprotech), 2mM L-glutamine (Thermo Fisher Scientific) and 1% penicillin/streptomycin (P/S) (Sigma Aldrich) in low-attachment 6-well plates for 2 days. A day prior to the reprogramming 1 million cells were counted for each cell line and cultured in PBMC media without P/S. The cells were reprogrammed into hiPSCs using a modified protocol.86 Approximately 1 million PBMCs per line were transfected with 1 μg/μL in the dilution ratio 1:1:1:1 of pCXLE-hOCT3/4-shp53 (Addgene) pCXLE-hSK (Addgene), pCXLE-hUL (Addgene) pCXB-EBNA1 (Addgene) using the P3 Primary Cell 4D X Nucleofector Kit L and the Nucleofector Lonza Machine (BioNordika). The program used for the nucleofection was EO-100. Post electroporation the cells were kept at room temperature for 3 min followed by dropwise addition of 300 μL of prepared PBMC media with 1% P/S and 10 M ROCK inhibitor (ROCKi) (Sigma Aldrich), followed by 10 min incubation at 37◦C with 5% CO2 humidity. After incubation each cell line was further cultured on Matrigel (Corning) in PBMC medium. The day after reprogramming the media was changed to fresh PBMC media with 1% P/S by tilting the plate and slowly removing 1 mL spent media and slowly adding 1 mL of fresh media. On day 3 post reprogramming half of the media was changed to stem cell media, mTeSR1 medium (Stem Cell Technologies) with 0.1% P/S and 250 μM Sodium Butyrate (Sigma Aldrich). After this the stem cell media was changed every second day until colonies emerged. Picking of colonies was performed manually on average at day 16 post reprogramming. Picked colonies were cultured on Matrigel with stem cell media and supplemented with 10 μM ROCK inhibitor. A minimum of 6 colonies were expanded to generate hiPSCs clones and banked. The hiPSC clones from each line were assessed by immunocytochemistry as described in the immunocytochemistry method section, using primary antibodies for the pluripotency markers NANOG (goat, 1:200), OCT-3/4 (mouse, 1:200) and TRA-1-60 (mouse, 1:200) (Figures S3A and S3B).
¶ Check of hiPSC line differentiation potential
The potential of differentiating into the three germ layers (endoderm, ectoderm and mesoderm) of the hiPSCs clones derived from PBMCs was assessed via embryonic body formation and spontaneous differentiation. Briefly, a well of an AggreWell 800 24-well plate was treated with 500μL of Anti-Adherent Rinsing Solution (Stem Cell Technologies) and centrifuged at 1800 rpm for 3 min. The solution was subsequently aspirated from the well and replaced with 1 mL of mTeSR1 basal medium supplemented with 10 μM ROCKi and placed in at 37◦C until use. In the meantime, hiPSCs were incubated with 0.5mM EDTA for 3 min and then collected with mTeSR1basal medium. 1 × 10⁶ hiPSCs were transferred to a new falcon tube and centrifuged for 3 min at 1000 rpm to obtain a cell pellet, resuspended in 1 mL mTeSR1 basal medium supplemented with 10 μM ROCKi and seeded into the prepared AggreWell plate. The plate was subsequently centrifuged at 400 RPM for 5 min. Media was changed by carefully aspirating 1 mL of spent medium and carefully replaced with fresh mTeSR1 basal medium. This step was repeated two times to ensure full media change. On day 4 EBs were transferred to a Matrigel-coated 4-well plate containing 12 mm double-acid treated glass coverslips. The medium was changed to fibroblast media 80% DMEM/F12 (Thermo Fisher Scientific) supplemented with 20% FBS and 1% P/S. The fibroblast media was changed every second day for three weeks. Differentiated cells were characterized by immunocytochemistry as described in the immunocytochemistry method section, with 3% bovine serum albumin (BSA) (Sigma Aldrich) as blocking solution, assessing markers for the three germ layers: nestin (ectoderm), alpha-fetoprotein (endoderm), and smooth muscle actin (mesoderm) (Figures S3D and S3E). Dilutions of primary antibodies were as follows: Nestin (mouse, 1:200), alpha-fetoprotein (AFP, rabbit, 1:500), smooth muscle actin (SMA, mouse, 1:1000). Images were acquired on a Zeiss LSM 700 confocal microscope and processed using Fiji ImageJ version 1.53t. 87
¶ Copy number variation
To assess the genomic integrity of the established cell lines, DNA was extracted from 1 confluent well of a 6 well plate for each hiPSC clone. The DNA extraction was carried out using the DNeasy Blood and Tissue Kit (Qiagen), following the manufacturing instructions for cultured cells. The extracted DNA was measured using Nanodrop and sent to the Department of Clinical Genetics Odense University Hospital, University of Southern Denmark where the CytoScan 750K Suite from Thermo Fisher Scientific was used for copy number variation analysis.
¶ Forebrain organoid (FO) differentiation
Unguided FOs were generated with the Cerebral Organoid Kit (Stem Cell Technologies) according to manufacturer instructions with the following modifications: On day 0, 600,000 iPSCs per well were seeded in Aggrewell800 24-well plates (Stem Cell Technologies) pre-treated with Anti-Adherence Rinsing Solution (Stem Cell Technologies) in embryoid body (EB) Seeding medium with 50 μM ROCK inhibitor (Y27632, Stem Cell Technologies). On day 7 EBs were transferred from Aggrewell800 24-well plates using widebore p1000 pipette tips and embedded in Matrigel by gently mixing around 30 EBs in 100 μL Expansion medium with 150 μL cold Matrigel (Corning) using wide-bore p200 tips and plating the mixture in a circle (diameter around 10 mm) in 60 mm culture dishes. Following 30 min incubation at 37◦C to polymerize the Matrigel, 4 mL Expansion medium was added per dish. On day 10 the dishes were moved to an INFORS HT Celltron orbital shaker set to 57 rpm in a 37◦C incubator. On day 15, the FOs were released from the Matrigel by gentle pipetting with wide-bore p1000 tips and around 16 FOs per dish cultured in 5 mL medium.
Guided FOs were generated using the STEMdiff Dorsal FO Differentiation Kit (Stem Cell Technologies) and maintained with the STEMdiff Neural Organoid Maintenance Kit (Stem Cell Technologies) according to manufacturer protocols with the following modifications: during the expansion period guided FOs were cultured in low-binding 24-well plates with 4–5 FOs per well to minimise fusion of the FOs. At around day 20, the FOs were moved to 60 mm low-binding culture dishes with 16 FOs per dish.
For both FO differentiations 1% Penicillin/Streptomycin (Pen/Strep, Gibco) and 1 μg/mL Amphotericin B (Amp B, Thermo Fisher Scientific) was added to the medium from day 10 onwards. The number of FOs per dish was gradually decreased from 16 to 5 with increasing size of the FOs.
¶ Immunocytochemistry and imaging
FOs from 2 or 3 independent differentiations were fixed using 4% paraformaldehyde (Thermo Fisher Scientific) in PBS (Gibco) for 1 h at room temperature (RT) and subsequently soaked in 30% sucrose at 4◦C for at least one night in PBS and until embedding. The FOs were embedded in OCT mounting medium, frozen in ethanol at below − 50◦C and stored at − 70◦C. FOs were sectioned on a Leica CM1860 cryostat at − 17 to − 20◦C in 30 μm sections and plated on glass Superfrost Plus Microscope slides. The slides were stored at − 20◦C.
The slices were hydrated with PBS, washed 2 × 5 min in 0.1% Triton X-100 (Plusone) in PBS and incubated for 30 min with permeabilization and blocking buffer (5% donkey or goat serum and 0.1% Triton X-100 in PBS). The slices were incubated overnight (ON) at 4◦C with primary antibodies in 1% serum and 0.1% Triton X-100 in PBS. Primary antibodies were used in the following concentrations: CTIP2 (rat, 1:500), DCX (rabbit, 1:800), FOXG1 (rabbit, 1:250), GFAP (mouse, 1:500), Map2 (mouse, 1:2000), NCAD (mouse, 1:500), NEUN (rabbit, 1:50), Homer1(goat, 1:250), SATB2 (rabbit, 1:500), SYN1/2 (guinea pig, 1:250), TBR1 (rabbit, 1:100), TOMM20 (rabbit, 1:250), SOX2 (rabbit, 1:500), TBR2 (sheep, 1:200) and HuC/D (mouse, 1:500).The samples were washed 3 × 10 min with 0.1% Triton X-100 in PBS and incubated with secondary antibodies for 1h in the dark at RT. Secondary antibodies were used in the following dilutions: Alexa Fluor 488 goat-anti-rabbit (1:500), donkey-anti-mouse (1:5000), donkey-antisheep (1:500), donkey-anti-rabbit (1:1000), and goat-anti-guinea pig (1:500); Alexa Fluor 568 goat-anti-rat (1:1000), goat-antimouse (1:1000), and donkey-anti-goat (1:1000); Alexa Fluor 594 donkey-anti-goat (1:1000) and donkey-anti-mouse (1:1000); Alexa Fluor 647 goat-anti-rabbit (1:1000) and donkey-anti-rabbit (1:500). The slices were washed 3 × 10 min with PBS and mounted with DAPI-containing ProLong Diamond Antifade mountant (Invitrogen). For day 20 whole-mount staining, uncut organoids were stained free-floating under rotation prior to mounting on glass slides. Slices were kept at 4◦C in the dark until image acquisition.
Images were acquired using a Nikon A1R confocal unit on a Ti-2 LFOV microscope with equal settings between the two organoid types. The images shown were edited using ImageJ version 1.53t.87
Growth curves were generated from bright field images of live organoids acquired with a Motic AE2000 microscope and organoid size quantified using the Motic Images Plus 3.0 software.
| Secondary antibodies | Company | Cat. No. | Dilution |
| Alexa Fluor 488 goat-anti-rabbit | Life Technologies | A11008 | 1:500 |
| Alexa Fluor 568 goat-anti-rat | Invitrogen | A11077 | 1:1000 |
| Alexa Fluor 568 goat-anti-mouse | Life Technologies | A11004 | 1:1000 |
| Alexa Fluor 647 goat-anti-rabbit | Invitrogen | A21245 | 1:1000 |
| Alexa Fluor 488 donkey-anti-mouse IgG (H + L) | Life Technologies | A21202 | 1:5000 |
| Alexa Fluor 647 donkey-anti-rabbit IgG (H + L) | Life Technologies | A31573 | 1:500 |
| Alexa Fluor 568 donkey-anti-goat | Life Technologies | A11057 | 1:1000 |
| Alexa Flour 488 donkey-anti-sheep | Invitrogen | A11015 | 1:500 |
| Alexa Flour 594 donkey anti-goat | Thermo Fisher | A11058 | 1:1000 |
| Alexa Flour 594 donkey anti-mouse | Thermo Fisher | A21203 | 1:1000 |
| Alexa Flour 488 donkey anti-rabbit | Thermo Fisher | A21206 | 1:1000 |
| Alexa Fluor 488 goat anti-guinea pig IgG (H + L) | Abcam | ab150185 | 1:500 |
¶ Protein lysis and digestion
Day 40 FOs were transferred to low-binding eppendorf tubes, washed ×1 with PBS and snap-frozen on dry ice. FOs were lysed in 1% sodium deoxycholate (SDC, Sigma) in 50 mM TEAB (Sigma) with 10 mM DTT (Sigma), pH 8, and sonicated 2 × 10 s on ice at 35% amplitude. Following sonication, samples were centrifuged at 5000 rcf for 10 min at RT and the supernatant transferred to new Eppendorf tubes. Protein concentration was determined by Nanodrop (Implen). 40 μg protein per sample was alkylated for 30 min with 20 mM Iodoacetamide (Sigma) and digested with 5% trypsin70 (w/w) for 4 h at 37◦C.
¶ TMT-labelling for proteomic analysis
The samples were alkalised with 1 M TEAB prior to labeling with TMTpro 18-plex (Thermo Fisher Scientific) according to manufacturer instructions. The reaction was quenched with 5% hydroxylamine (Thermo Fisher Scientific) and samples combined in equal ratios as determined by running 1 μL of each sample combined on an Orbitrap Exploris 480 Mass Spectrometer (Thermo Fisher Scientific). The SDC was precipitated from the combined samples using 2% formic acid (FA, Merck).
¶ Enrichment of phospho-and glycopeptides
Phospho-peptides and sialylated N-glycopeptides were enriched as previously described.28 Briefly, peptides were dissolved in titanium dioxide (TiO2) loading buffer (80% acetonitrile (ACN, VWR), 5% Trifluoroacetic acid (TFA, Merck), 1 M glycolic acid (Sigma)) and incubated with TiO2 beads (GL Sciences Inc), which bind the negatively charged phospho-peptides and sialylated N-glycopeptides. The unbound ‘‘non-modified’’ fraction from the TiO2 enrichment was kept for quantitative proteomics and the modified fraction was eluted from the TiO2 beads using 25% ammonium hydroxide (Merck), pH 11.3, and incubated overnight with PNGase F (New England BioLabs) and sialidase A (Prozyme) for deglycosylation. The phospho-peptides were separated from the formerly sialylated N-glycopeptides with a second round of TiO2 enrichment.
The modified peptides were purified and desalted by in-house-made reversed-phase microcolumns. Peptides were acidified and loaded onto p200 pipette tips packed with Empore SPE disks C18 (Sigma) and Oligo R3 Resin (Applied Biosystems). The non-modified peptides were similarly acidified and loaded on an Oasis HLB column (Waters), activated with methanol (VWR) and 100% ACN. The columns were equilibrated by 0.1% TFA solution. All purified peptides were eluted by 60% ACN, 0.1% TFA and dried prior to high pH fractionation.
¶ High pH fractionation
The 3 fractions (non-modified peptides, phospho-peptides and sialylated N-glycopeptides) were separately dissolved in 20 mM ammonium formate, pH 9.3, loaded on an Acquity UPLC -Class CSHTM C18 column (Waters) and fractionated on a Dionex Ultimate 3000 HPLC system (Thermo Fisher Scientific). 20 concatenated fractions were collected for the non-modified peptides and 12 each for the phospho-peptides and sialylated N-glycopeptides.
¶ Nano liquid chromatography-mass spectrometry
The samples were resuspended in 0.1% FA (buffer A) and loaded onto an in-house made two-column system containing a 3 cm precolumn (100 μm inner diameter packed with Reprosil-Pur 120 C18-AQ, 5 μm (Dr. Maisch GmbH) and an 18 cm pulled emitter analytical column (75 μm inner diameter packed with Reprosil-Pur 120 C18-AQ, 3 μm (Dr. Maisch GmbH)) on an EASY-nLC system (Thermo Fisher Scientific). The peptides were eluted with an organic solvent gradient from 100% buffer A (0.1% FA) to 40% buffer B (95% ACN, 0.1% FA) at a constant flow rate of 250 nL/min for 120 min. The EASY-nLC was online connected to an Orbitrap Exploris 480 Mass Spectrometer (Thermo Fisher Scientific) operated at positive ion mode with data-dependent acquisition. All full MS was performed in the mass range of 350–1400 in the Orbitrap with a resolution of 120 000 full-width half-maximum (FWHM), a maximum ion injection time of 100 ms and a normalised automatic gain control (AGC) target of 300%.
Fragmentation was performed at high resolution (45,000 FWHM) with a normalised AGC target of 200% and a maximum injection time of 100 ms using an isolation window of 0.7 m/z and dynamic exclusion. Raw data were viewed in Xcalibur v3.0 (Thermo Fisher Scientific).
¶ Protein identification and quantification
The mass spectrometry proteomics data have been deposited to the ProteomeXchange Consortium via the PRIDE88 partner repository with the dataset identifier PRIDE: PXD048559. The raw data were processed using Proteome Discoverer (v2.4, Thermo Fisher Scientific) and searched against the Swissprot human database using an in-house Mascot server (v2.6, Matrix Science Ltd.). Database searches were performed with the following parameters: precursor mass tolerance of 10 ppm, fragment mass tolerance of 0.02 Da (HCD fragmentation), a maximum of 2 missed cleavages, TMT-Pro (K/N-term) and Carbamidomethyl © as fixed modifications, Deamidation (N) or phosphorylation (S/T/Y) as dynamic modification in the sialylated N-glycopeptides and phospho-peptides, respectively. Only proteins/peptides with q-value <0.01 (Percolator), Mascot rank 1 and cut-off value of Mascot score >15 were considered for further analysis (≤1% false discovery rate (FDR)).
Only proteins with two or more unique peptides were considered for further analysis in the non-modified group. Sialylated N-glycopeptides (NxS/T/C motif) were manually sorted based on information from UniProt73 on known glycosylation and cellular localisation (Golgi/endosome/lysosome/membrane/extracellular) to exclude spontaneous deamidations. Statistical testing to identify significant differences between the two groups was performed on all three datasets using PolyStest74 applying the Rank products test with FDR = 0.05 to correction for multiple testing.
Gene Ontology (GO) term enrichment analysis was performed in Cytoscape StringApp75 applying the ClueGO76 plug-in to identify enrichment of functionally grouped GO terms in the category ‘‘Biological process’’ on the significantly different proteins/ peptides from the three datasets. For non-modified proteins and phospho-peptides fold change cut-offs of >0.3 or < -0.3 and >0.5 or < -0.5, respectively, were applied. Enrichment was determined by two-sided hypergeometric test with Bonferroni stepdown (q-value <0.05). The Homo sapiens (9606) marker set was applied with the following settings: GO term fusion selected, network confidence score 0.5, GO tree levels 6–12 and a Kappa score threshold of 0.5. For GO term selection a minimum of 3 genes and 5% of genes were used for the non-modified and sialylated N-glycoproteins, whereas a minimum of 5 genes and 10% were used for the larger lists of phosphorylated proteins. Data visualisations were performed in R using ggplot2.77,78
String networks were created using the Cytoscape StringApp75 with confidence score cut-off 0.4 and only showing connected nodes.
¶ Lipid and metabolite extraction
Day 40 FOs were transferred to low-bind tubes, washed x 1 with 50 mM ammonium acetate (Sigma) and snap-frozen on dry ice. Metabolites and lipids were extracted using a modified Folch approach: FOs were sonicated 2 × 10 s in ice-cold 1:2 methanol/chloroform solvent containing SPLASH LIPIDOMIX MS standard internal standard mix (Merck). 1:6 H2O was added to the samples before shaking at 1000 rpm, 4◦C, for 30 min, followed by centrifugation for 10 min at 16000 rcf, 4◦C. The metabolite-containing aqueous, upper phase and the lipid-enriched organic, lower phase were collected. The aqueous phase was re-extracted with 86:14:1 chloroform/methanol/H2O solvent, shaking at 1000 rpm, 4◦C, for 20 min, and centrifuging at 16000 rcf, 4◦C, for 10 min. The aqueous phase containing metabolites was collected and dried by speed vacuum centrifugation. The lower, organic phase containing remaining lipids was added to the previous organic phase and dried under a stream of nitrogen (N2) and stored at − 20◦C until the day of analysis.
¶ Metabolomic and lipidomic analysis
Samples for metabolomics were resuspended in 0.1% formic acid 25 μL before injection of 3 μL using a Vanquish Horizon UPLC (Thermo Fisher Scientific) equipped with an analytical column (2.1 × 150 mm and 1.8 μm particle size, Agilent Technologies) operated at 40◦C. The analytes were eluted using a flow rate of 400 μL/min and the following composition of eluent A (0.1% formic acid) and eluent B (0.1% formic acid, acetonitrile) solvents: 3% B from 0 to 1.5 min, 3%–40% B from 1.5 to 3 min, 40%–95% B from 3 to 5 min, 95% B from 5 to 7.6 min and 95%–3% B from 7.6 to 8 min before equilibration for 3.5 min with the initial conditions. The flow from the UPLC was coupled to a TimsTOF Flex (Bruker) instrument for mass spectrometric analysis, scanning from 40 to 1500 mz, operated in both positive and negative ion mode using trapped ion mobility spectrometry. Collision energy of 20 and 40 Ev was applied.
Samples for lipidomics were resuspended in 25 μL chloroform/methanol (1:1) and 1 μL injected using a Vanquish Horizon UPLC (Thermo Fisher Scientific) equipped with a Waters ACQUITY Premier CSH (2.1 × 100mm, 1.7 μM) column operated at 55◦C. The analytes were eluted using a flow rate of 400 μL/min. For lipids the following composition was applied of eluent A (Acetonitrile/water (60:40), 10 mM ammonium formate, 0.1% formic acid) and eluent B (Isopropanol/acetonitrile (90:10), 10 mM ammonium formate, 0.1% formic acid): 40% B from 0 to 0.5 min, 40–43% B from 0.5 to 0.7 min, 43–65% B from 0.7 to 0.8 min, 65–70% B from 0.8 to 2.3 min, 70–99% B from 2.3 to 6 min, 99% B from 6–6.8 min, 99-40% B from 6.8–7 min before equilibration for 3 min with the initial conditions.
For metabolites the following composition was applied of eluent A (0.1% formic acid in water and eluent B (Isopropanol/acetonitrile (90:10), 0.1% formic acid in acetonitrile): 3% B from 0 to 1 min, 3–40% B from 1 to 3 min, 40–95% B from 3 to 5 min, 95% B from 5 to 7.6 min and 95 to 3% B from 7.6 to 8 min before equilibration for 3.5 min with the initial conditions.
The flow from the UPLC was coupled to a TimsTOF Flex instrument (Bruker) operated in both positive and negative ion mode using trapped ion mobility spectrometry. For lipids scanning from 100 to 1800 mz with a collision energy of 30/50 Ev in positive ion mode and 20/30 eV in negative ion mode. For metabolites scanning from 40 to 1500 mz with a collision energy of 20 and 40 Ev.
Data was processed in Metaboscape (v2023, Bruker). For lipidomics annotation was done using both an in-build rule-based annotation approach and a LipidBlast MS2 library.79
For metabolomics annotation was done by firstly searching MS2 spectra against the following MSMS libraries: Metabobase (Bruker), National Institute of Standards and Technology 17 (NIST17) and MassBank of North America (MoNA). Next the not annotated compounds were annotated using Metfrag for in silico annotation.80
Features were removed if their average signal were not >5 x more abundant in the QC samples than blanks (water extraction). The signals were normalised to internal standards in the SPLASH mix before correction for signal drift using statTarget.85 Finally, signals were normalised using the QC samples, before log transformation (base 10) and auto scaling, all done in Metaboanalyst.81
¶ Western blotting
Day 40 and day 120 FOs were lysed in 1% SDC in 50 mM TEAB, pH8, and sonicated 2 × 10 s on ice at 35% amplitude. Following sonication, samples were centrifuged at 5000 rcf for 10 min at RT and supernatant transferred to new Eppendorf tubes. Protein concentration was determined by Nanodrop (Implen). Proteins were separated using Bolt 4–12% Bis-Tris Plus Gels (Thermo Fisher Scientific) with samples loaded in NuPage LDS Sample buffer (Thermo Fisher Scientific) with NuPage Sample Reducing agent (Thermo Fisher Scientific) and PageRuler Plus pre-stained protein standard (Thermo Fisher Scientific) or SeeBlue Plus2 Pre-stained Protein Standard (Invitrogen) for size reference. Proteins were transferred to PVDF membranes using the Trans-Blot Turbo Transfer System (BioRad) and membranes were blocked with 5% skimmed milk in TBST buffer for 1 h and incubated overnight at 4◦C in TBST with the following primary antibodies: rabbit anti-TOMM20 (Abcam #ab186735) 1:1000, mouse anti-Map2a+b (Sigma #M1406) 1:500, mouse anti-β-actin HRP-linked (Abcam #ab49900) 1:50000, rabbit anti-GAPDH (Cell Signaling Technology #21185) 1:1000, rabbit anti-Synapsin 1 (SYN1, Abcam #ab254349) 1:1000, rabbit anti-HIF1α (Abcam #ab51608) 1:1000, rabbit anti-Glial Fibrillary Acidic Protein (GFAP, Dako #Z0334), rabbit anti-FOXG1 (Thermo Fisher Scientific #702554) 1:250, rabbit anti-S100B (Cell Signaling Technology #90393S) 1:1000, or rabbit anti-LAMP1 (Abcam #24170) 1:500. Following 3 x wash in TBST, the membranes were incubated for 1 h at RT in TBST with the following secondary antibodies: anti-rabbit IgG, HRP-linked (Cell Signaling Technology #7074) 1:10000 or anti-mouse IgG, HRP-linked (Abcam #ab6728) 1:10000. Following 3 x wash in TBST, the membranes were visualised with Immobilon ECL Ultra Western HRP Substrate (Millipore) using an Amersham 680 Imager (GE Healthcare). Representative full lane Western blots for all antibodies are shown in Figure S6.
As controls for the HIF1α blots, the human ventral midbrain neural precursor (NPC) line hVM-bcl-xl was differentiated to neurons for 10 days as previously described72 and incubated for 4 h at either normoxic (21% oxygen tension) or hypoxic (1%) conditions. The neurons were quickly washed once with dPBS, collected in 1% SDC in 50 mM TEAB and snap-frozen on dry ice.
¶ Multi-electrode array (MEA) analysis
MEA recordings were performed on a BioCam Duplex system (3Brain). The recording area of Accura HD-MEA cartridges (3Brain) were coated ON with 100 μg/mL poly-L-lysine (Sigma), washed x 3 with dPBS (Thermo Fisher Scientific) and coated ON with 50 μg/mL laminin (Sigma). Day 110 FOs were plated on the HD-MEA cartridges by removing the laminin, placing the FOs gently on the recording area using a sterile spatula and removing all medium. Attachment of the FOs to the recording area was promoted by stepwise addition of small amounts of medium (10–100 μL) with 5–10 min incubation periods in between. When attachment of the FOs was ensured, the cartridge reservoir was filled with 1.5 mL medium. The FOs were cultured on the HD-MEA cartridges with medium change every 3–4 days. On day 120, 2 min recordings were performed on the BioCam Duplex system with temperature set to 37◦C and spike detection in balanced mode. Analysis was performed using BrainWave 5 software.
¶ Functional assays for LDH and ROS
The LDH release from day 40 FOs was measured by incubating individual FOs in 150 μL maturation medium ON and quantifying the LDH content in the medium using the LDH-Glo Cytotoxicity Assay (Promega) according to manufacturer instructions.
The ability of day 40 FOs to eliminate ROS was measured using the ROS-Glo H2O2 Assay (Promega) by incubating individual FOs for 2 h with the H2O2 substrate and subsequently detecting H2O2 levels in the medium (with and without FOs) according to manufacturer instructions.
For both assays the relative luminescence intensity was measured using a Fluostar Omega Plate reader (BMG Labtech) and normalised to the protein content of each FO as measured by Nanodrop.
¶ Seahorse analysis
Day 55–60 FOs were embedded in 4% (w/v) low-gelling temperature agarose in HBSS and sectioned into 150 μm slices on a vibratome with the following settings: amplitude 300 μm, frequency 6 and speed 5. The slices were cultured free floating and the following day plated in Seahorse XFp Microplates (Agilent) using the same approach as described for the MEA analysis. ATP production from FO slices was measured using the Seahorse XF Real-Time ATP Rate Assay (Agilent) according to manufacturer instructions with the following modifications: the incubation time for oligomycin during the assay was increased to 15 min to allow for proper diffusion into the slices and the final toxin concentrations were increased to 5 μM for oligomycin and 2 μM for rotenone/antimycin (Agilent). The ATP production was normalised to the FO slice protein content as measured by Nanodrop (Implen).
¶ Single-cell RNA sequencing (scRNAseq)
Single-cell dissociation was performed on a total of 7–8 FOs (day 20) or 2–3 FOs (day 40) in triplicates. FOs were collected and incubated in 1 mL of Accumax (Sigma, A7089) at 37◦C for 20 min with gentle agitation. At 5 min intervals, the sample tubes were flicked, and after 15 min pipetted 1 time, followed by a final pipetting of 7 times at 20 min. Clumps were allowed to settle and the supernatant passed through a 70 μm strainer (Fisherbrand, 11597522). Cells were counted (CountessII, Invitrogen) and at least 1 × 10⁶ viable cells were collected for the following Evercode Cell fixation (Parse Biosciences, ECF2001) according to manufacturer instructions omitting bovine serum albumin in the pre-fixation buffer. The 12 samples were barcoded and sequencing libraries prepared using the Evercode WT Mini v2 kit (Parse Biosciences) according to the manufacturer’s protocol. The libraries were then sequenced on NextSeq 2000 (Illumina) using a P2 flowcell (Illumina) for 200 cycles. The Illumina sequencing generated pairs of FASTQ files. The bioinformatics pipeline split-pipe (version 1.0.6p), produced by Parse Biosciences, was used to process these files.82 The pipeline performed multiple functions, including identifying barcodes, mapping reads to the human reference genome (GRCh38/version 102) and quantifying gene expression at the single cell level. The pipeline was run with default parameters for a Parse Mini Kit using Version 2 chemistry. The scRNAseq data have been deposited in NCBI’s Gene Expression Omnibus71 and are accessible through GEO Series accession number GEO: GSE253889.
The filtered digital gene expression (DGE) matrix was analyzed in R using Seurat.77,78,82 Only cells with total transcripts >100 and <150,000, unique transcripts <12,000 and mitochondrial transcripts <10% of total were analyzed (Figure S2A). The full dataset was split into the four conditions, normalising and identifying variable features of each dataset before reintegration based on repeatedly variable features (integration anchors). The integrated dataset was scaled and dimensionality reduction performed using principal component analysis (PCA) and visualised with UMAP generated on the first 15 principal components (Figures S2B and S2C). K-Nearest Neighbor graph-based clustering, with Louvain algorithm and resolution = 1, resulted in 21 clusters, which upon differential gene expression analysis of known marker genes and literature review were combined and manually annotated to 12 clusters.
Pseudotime analysis was performed using Monocle3 on the data from guided and unguided FOs separately by subsetting and converting the integrated Seurat object.83,84 UMAP coordinates and clusters were assigned from Seurat and trajectory analysis performed not considering cluster partitions. Cells were ordered by denoting clusters of mitotic radial glia as starting points.
¶ Fetal frontal lobe proteomic comparison
Proteomic data was downloaded from (Zhao et al. 2022).40 The label free quantification (LTQ) protein intensities from left and right hemisphere of GW9 frontal lobe were averaged and log-transformed and compared to log-transformed protein abundances from guided and unguided FOs (SCZ and CTL combined). Only fetal proteins with average LTQ intensity >0 at GW9 were included. Spearman correlation analysis was performed in R.77,78
The protein log-abundance of FOs and protein log-LTQ were normalised to average in each group and compared to identify proteins with relatively high or low normalised abundance between FOs and fetal frontal lobe. Proteins with FO log-abundance/fetal log-LTQ <0.2 or >10 were selected for enrichment analysis in Cytoscape as previously described. No enrichments were seen for the proteins with high abundance in FOs relative to the fetal frontal lobe.
¶ QUANTIFICATION AND STATISTICAL ANALYSIS
¶ Image and WB quantification
One to three images were obtained for quantification with an ×10 or ×60 objective from two FO sections per organoid. Organoids (1–3 per batch) were derived from 2 to 3 batches. Images were processed and quantified in ImageJ v1.54p and converted to 8-bit before processing.
For quantification of GFAP levels at day 80, the Top Hat filter was used with a radius of 7, followed by Rolling ball subtraction of background at radius 15 and sliding paraboloid enabled, to remove background signal. Despeckle was run to remove noise.
For quantification of SYN1/2 and Homer1 levels, background was removed using the Top Hat filter (radius = 20 pixels) and the threshold method Triangle. For SYN1/2, the minimum threshold was set to 60 at day 40 and 50 at day 80; for Homer1, the minimum threshold was set to 50 at day 40 and 25 at day 80. Despeckle was run once to remove noise. MAP2 background was removed with Top Hat filter, radius = 20, and the Triangle threshold method with a minimum threshold set to 30 at day 40 and default at day 80. Despeckle was run to remove noise and Dilate was used before measuring overlapping areas. Only Homer1 or SYN1/2 areas overlapping the MAP2 signal were measured, and intensity was measured as mean gray value. For DAPI images the threshold method Huang was used, and DAPI area was used for normalization as a representative for the number of cells in images obtained with the ×10 objective.
Colocalization between Homer1, SYN1/2 and MAP2 was measured at day 80 using the ×60 objective. Top Hat filter (radius = 30 pixels) was applied to SYN1/2 and Homer1 images to remove background, followed by the Triangle threshold method with minimum threshold of 30 for SYN1/2 and 15 for Homer1. MAP2 images were thresholded using the Triangle method with minimum level set to 20 followed by Despeckle to remove noise, and application of the Dilate function to ensure inclusion of peripheral colocalization. Organoid area was measured using the polygon selection tool and used for normalization of the triple colocalization and MAP2 area measurements.
For WB quantification, the optical density of each band was quantified using Image Lab software (Bio-Rad).
¶ Statistical analyses
Statistical analyses of proteomic, metabolomic and lipidomic results were performed with the PolyStest74 applying the Rank products test (FDR = 0.05) with the in-built Benjamini Hochberg-based correction for multiple testing. The n refers to number of FOs per group and are specified in figure legends together with fold change cutoffs when relevant.
Unless otherwise stated in the above, data visualisation and statistical testing was performed in Prism (v10.0, GraphPad Software) using two-tailed paired Student’s t-tests with Benjamini-Hochberg correction for multiple testing where appropriate. Results are expressed as mean ± SEM, and p- or q-values ≤0.05 were considered statistically significant. Statistical details for each experiment can be found in the figure legend.