¶ Cell
¶ Multi-chamber cardioids unravel human heart development and cardiac defects
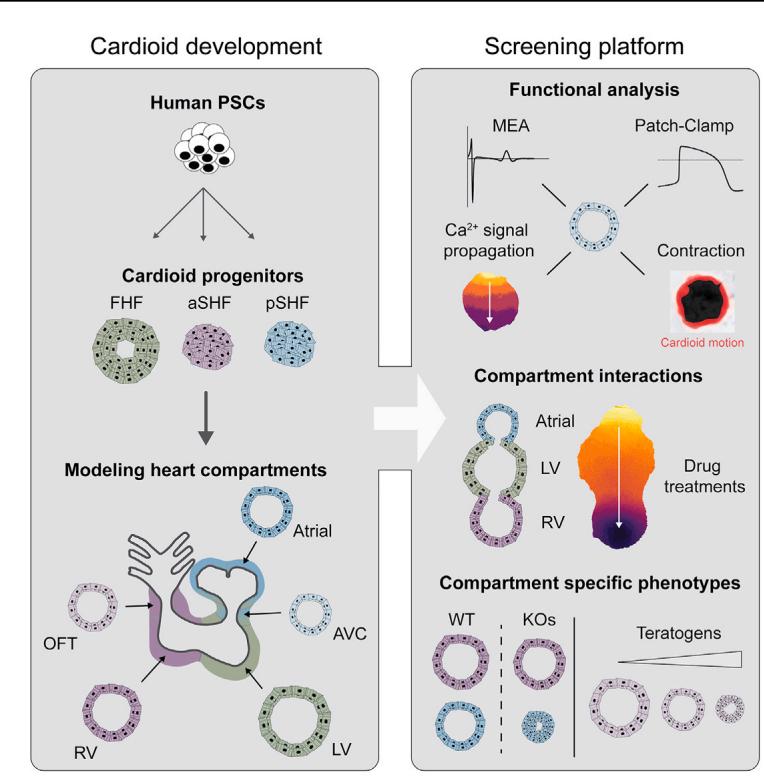
¶ Graphical abstract
¶ In brief
Multi-chamber cardioids representing all major compartments of the human embryonic heart are developed and used to investigate electrophysiological signal propagation between chambers as well as dissect genetic and teratogenic causes of human cardiac defects.
¶ Highlights
d Mesoderm induction and patterning signals specify aSHF, pSHF, and FHF progenitors
d Progenitors sort, co-develop, and functionally connect in multi-chamber cardioids
d Multi-chamber cardioids coordinate contraction propagation and share a lumen
d Multi-chamber platform dissects genetic, teratogenic, and physiological defects
¶ Multi-chamber cardioids unravel human heart development and cardiac defects
Clara Schmidt, Alison Deyett, Tobias Ilmer, Simon Haendeler, Aranxa Torres Caballero,1 Maria Novatchkova,6
Michael A. Netzer,3 Lavinia Ceci Ginistrelli, Estela Mancheno Juncosa, Tanishta Bhattacharya,1 Amra Mujadzic,1
Lokesh Pimpale,4 Stefan M. Jahnel,1 Martina Cirigliano,1 Daniel Reumann, Katherina Tavernini,1,7 Nora Papai,1,7
Steffen Hering,3 Pablo Hofbauer,4 and Sasha Mendjan1,9,*
1 Institute of Molecular Biotechnology of the Austrian Academy of Sciences (IMBA), Dr. Bohr Gasse 3, 1030 Vienna, Austria
2 Center for Integrative Bioinformatics Vienna, Max Perutz Laboratories, University of Vienna, Medical University of Vienna, 1030 Vienna,
Austria
3 Division of Pharmacology and Toxicology, University of Vienna, Josef-Holaubek-Platz 2, 1090 Vienna, Austria
4 HeartBeat.bio AG, Dr. Bohr Gasse 7, 1030 Vienna, Austria
5 FH Campus Wien, Favoritenstraße 226, 1100 Vienna, Austria
6 Institute of Molecular Pathology (IMP), Campus-Vienna-Biocenter, 1030 Vienna, Austria
7 Vienna BioCenter PhD Program, Doctoral School of the University of Vienna, and Medical University of Vienna, 1030 Vienna, Austria
8 These authors contributed equally
9 Lead contact
*Correspondence: sasha.mendjan@imba.oeaw.ac.at
https://doi.org/10.1016/j.cell.2023.10.030
¶ SUMMARY
The number one cause of human fetal death are defects in heart development. Because the human embryonic heart is inaccessible and the impacts of mutations, drugs, and environmental factors on the specialized functions of different heart compartments are not captured by in vitro models, determining the underlying causes is difficult. Here, we established a human cardioid platform that recapitulates the development of all major embryonic heart compartments, including right and left ventricles, atria, outflow tract, and atrioventricular canal. By leveraging 2D and 3D differentiation, we efficiently generated progenitor subsets with distinct first, anterior, and posterior second heart field identities. This advance enabled the reproducible generation of cardioids with compartment-specific in vivo-like gene expression profiles, morphologies, and functions. We used this platform to unravel the ontogeny of signal and contraction propagation between interacting heart chambers and dissect how mutations, teratogens, and drugs cause compartment-specific defects in the developing human heart.
¶ INTRODUCTION
Congenital heart disease (CHD) is the most common human developmental birth defect and the most prevalent cause of embryonic and fetal mortality.1,2 CHDs most often affect specific compartments of the embryonic heart, such as the outflow tract (OFT), the atria, the atrioventricular canal (AVC), and the right ventricle (RV).3 For about of diagnosed CHD cases, the underlying cause is unknown but is assumed to originate from undiscovered genetic mutations, environmental factors, or a combination of both.4 To identify possible causes and preventive measures, we need models encompassing all compartments of the developing human heart.
CHDs occur early in embryonic development, making the characterization of disease etiology particularly challenging.5,6 These difficulties are compounded by the lack of control over the interactions between genetic background and environmental factors during human embryonic development.4 Understanding the etiology of CHD solely through animal models is not feasible, given tissue complexity, developmental speed, inaccessibility, and species-specific differences.7 These differences include the disc-like shape of the human embryo, divergence in extraembryonic tissues and implantation, the gestational timing and proliferation rates, and the distinct expression of some cardiac transcription factors (TFs), structural proteins, and ion channels, resulting in specific electrophysiological characteristics and disease suspensibility. We do not have human in vivo references for some of these disparities, as there are no molecular and physiological data for the crucial cardiac developmental period between 19 and 28 days post-fertilization (dpf). Nevertheless, the general principles of heart development, such as the role of signaling, cell types, lineage architecture, and function, are conserved. Inspired and guided by in vivo cardiogenesis, recently reported human self-organizing cardiac organoids are important and complementary, as these represent experimental models of human cardiac development and thereby allow reductionist dissection of mechanisms in high throughput, obtaining results with high statistical significance.8,9 However, these systems do not yet allow the mechanistic interrogation of defects representing all interacting compartments (OFT, AVC, atria, RV, and left ventricle [LV]) of the human embryonic heart.
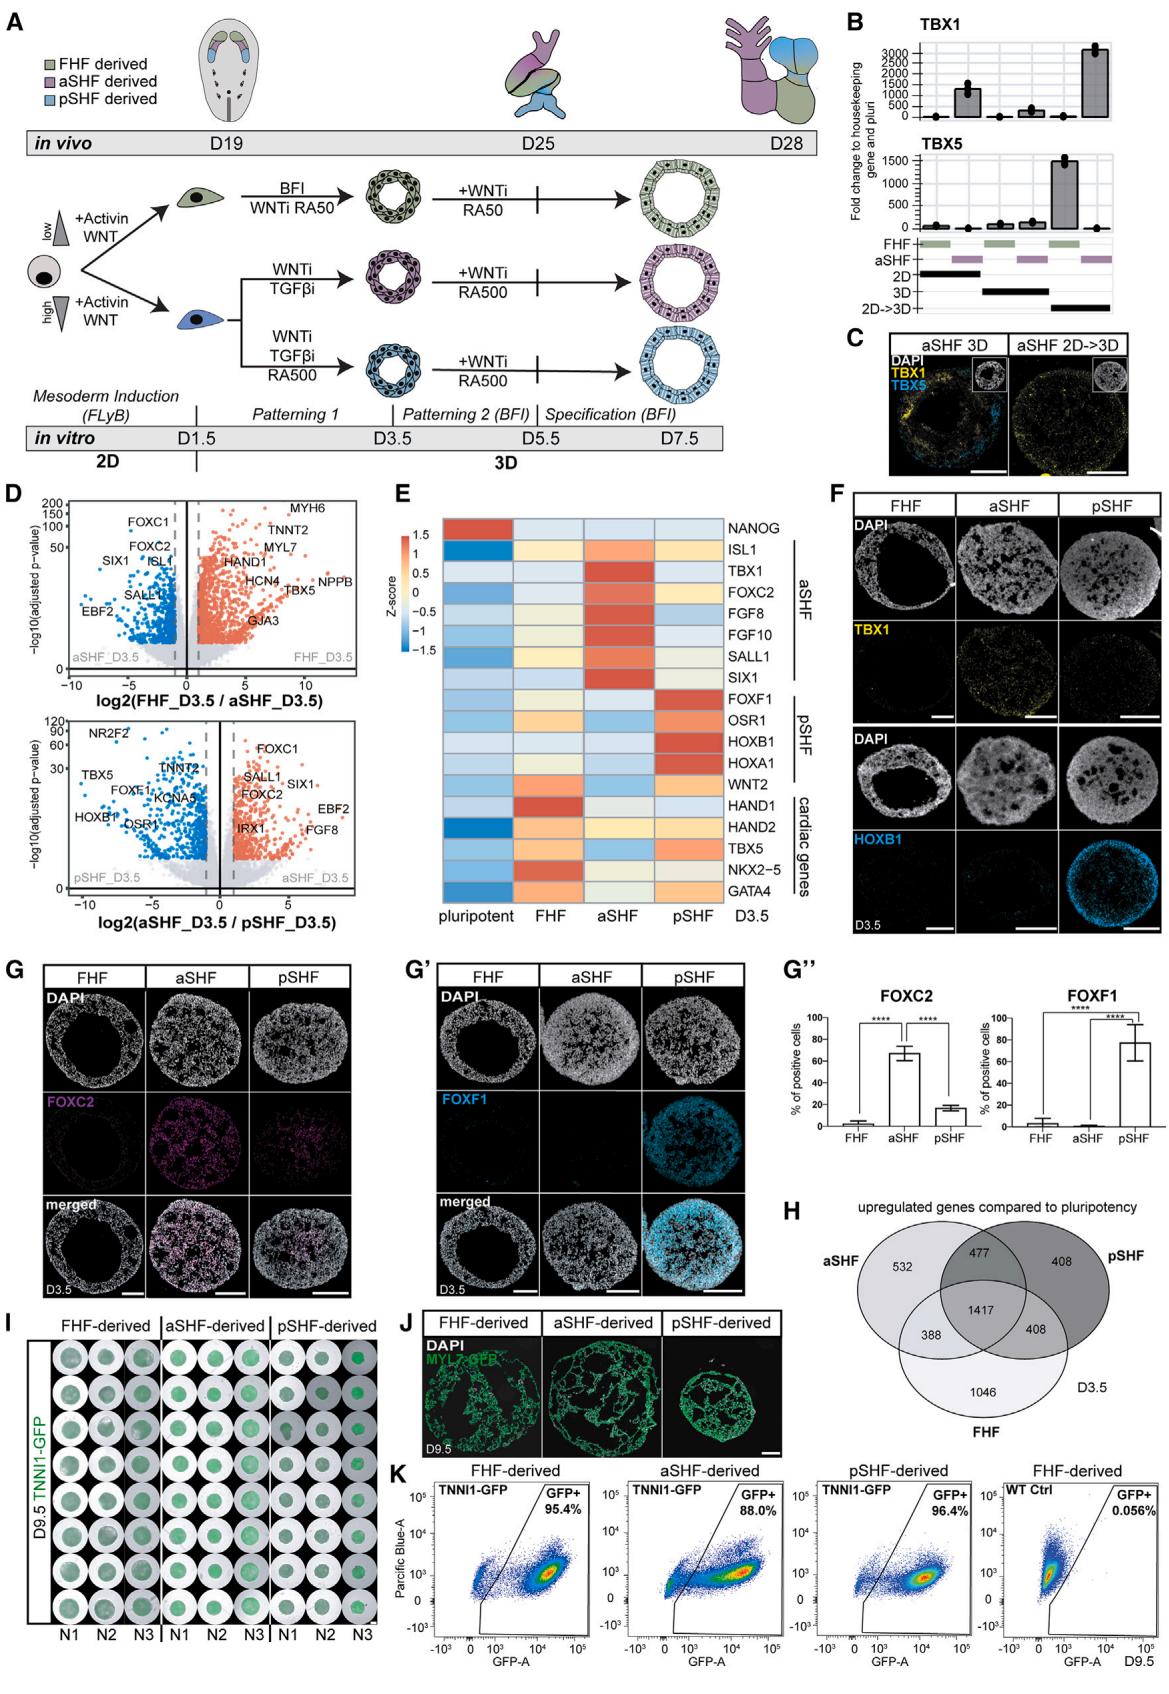
Figure 1. aSHF and pSHF progenitors express specific markers and form functional cardioids
(A) Differentiation protocol into three main cardiac lineages: first heart field (FHF), anterior second heart field (aSHF), and posterior second heart field (pSHF). WNT, CHIR99021; LY, LY 294002; BMP4; F, FGF2; I, insulin; WNTi, C59 or XAV-939; TGFβi, SB 431542; RA, retinoic acid (numbers represent μM).
(B) Marker RT-qPCR in FHF/aSHF/pSHF in 2D, 3D, and 2D → 3D protocols.
© RNA-scope marker staining of progenitors-cardioids in 2D vs 3D vs 2D → 3D vs 3D differentiation. For subsequent figures, the 2D-3D protocol is used.
(D) RNA-seq volcano plot of differentially expressed genes in indicated conditions.
(E) RNA-seq expression heatmap for lineage-specific cardiac mesoderm TFs.
(F) RNA-scope marker staining as specified.
(G) (G and G′) Marker immunostaining in cardioids with (G′) quantification (N = 3, n = 3–9).
(H) RNA-seq Venn diagram of shared upregulated genes in different cardioids.
(I) Biological and technical replicates of representative genes whole-mount cardioid images derived from TNNI1-GFP-hPSCs. Scale bars, 500 μm.
(J) MYL7-GFP-hPSC-derived cardioid subtype cryosections.
(K) Representative flow cytometry plot derived from TNNI1-GFP/WT-hPSCs. Indicated day of analysis (D). Scale bars, 200 μm, except where specified. hPSC lines H9 and WTC11. Bar graphs show mean ± SD. Statistics: one-way ANOVA. *p < 0.05, **p < 0.01, ***p < 0.001, ****p < 0.0001. ns: not significant. hPSC, biological replicate number; n: technical replicate number.
See also Figure S1.
For a controlled in vitro system to mimic human heart development, it is essential to deploy the in vivo principles that govern the coalescence of all lineages in building a heart.10,11 Heart structures are predominantly derived from three progenitor populations that give rise to specific cardiomyocyte (CM) lineages. The first heart field (FHF) primarily gives rise to the developing LV, the anterior second heart field (aSHF) to the developing RV and most of the OFT, and the posterior second heart field (pSHF) gives rise to most of the atria and a portion of the AVC. The development of these structures is carefully timed such that the FHFderived CMs form the heart tube and the LV, while the aSHF and pSHF differentiate to form the remaining compartments in a delayed and gradual fashion. This complex and dynamic process is orchestrated by developmental signaling pathways (WNT, Nodal/Activin, BMP, etc.) at specific stages.12 The signaling pathways control key downstream compartment-specific TFs (e.g., TBX1, TBX5, and IRX4), instructing progenitor specification, morphogenesis, and physiology.1 3 Although much is known about these core network components, we lack a human model enabling mechanistic dissection of how mutations or environmental factors lead to CHD or fetal death.
Here, we established a multi-chamber cardioid platform that unravels how interacting chambers coordinate contractions and how mutations, drugs, and environmental factors impact specific regions of the developing human heart.
¶ RESULTS
¶ Generation of cardioids from aSHF and pSHF progenitors
To derive SHF progenitors, we first hypothesized that the aSHF is exposed to WNT and Nodal signaling inhibition, a similar signaling environment as other anterior and dorsal embryonic regions (neuroectoderm and head mesoderm).14,15 Thus, we derived cardioids16 from the aSHF lineage by inducing mesoderm first, followed by the aSHF-patterning-1 stage using dual WNT and Nodal/Activin signaling inhibition (Figure 1A). Synergistic WNT and Nodal/Activin inhibition were necessary for early aSHF lineage marker (TBX1 and FOXC2) upregulation, while any Nodal/Activin signaling modulation interfered with FHF differentiation (Figures S1D and S1F). As in vivo, BMP signaling at the patterning-1 stage hampered aSHF specification (Figure S1E).10 After 3.5 days of 3D differentiation, we observed aSHF and FHF/pSHF progenitor heterogeneity and traced its origin to the earlier induction stage (day 1.5) with the mesoderm marker EOMES expressed only at the surface and the pluripotency and neuroectoderm marker SOX2 in the cardioid core (Figures 1B, 1C, S1A, and S1B). Thus, we hypothesized that cells in 2D receive more equally distributed induction signals, resulting in a homogeneous exit from pluripotency and differentiation, whereas mesoderm is not induced homogeneously in 3D. When we induced mesoderm in 2D and initiated differentiation in 3D only at patterning-1 (day 1.5), cells exited pluripotency efficiently (Figure S1B), expressed high levels of TBX1 and FOXC2 , protein level), and only a few cells expressed TBX5 (Figures 1B, 1C, S1A, S1D, S1G, and S1H). In contrast, the expression of head mesoderm markers was absent (Figure S1C),17 indicating that the staged 2D-3D differentiation produces more homogeneous progenitor populations.
In contrast to the aSHF, the pSHF is exposed to retinoic acid (RA) signaling in vivo, 18 which activates pSHF regulators (HOXB1, HOXA1, and TBX5) and inhibits the aSHF expression signature. Consistently, we observed that adding RA during aSHF-patterning-1 promoted pSHF identity (Figures 1A, 1E– , and S1E), while manipulation of other signaling pathways (SHH, WNT, and FGF) had little to no effect (Figure S1E).19 As in vivo, 20 different Nodal/Activin and WNT signaling levels during mesoderm induction stimulated the aSHF and pSHF over the FHF lineage (Figure S1G). When we analyzed the three progenitor subtypes by RNA sequencing (RNA-seq), we found that the FHF, aSHF, and pSHF markers were among the most differentially expressed genes (Figures 1D and 1E). The specificity and homogeneity of the progenitor populations were further underscored by the mutually exclusive expression of lineage-specific markers (Figures 1D–1H and S1H). Still, all populations were positive for the cardiac progenitor marker NKX2-5 and mostly negative for SOX2 (Figure S1I). Overall, these data suggest that in the cardioid system, we can efficiently and homogeneously generate all three major cardiac progenitors.
The FHF, aSHF, and pSHF give rise to several different cardiac cell types in the embryo, including CMs and endothelial cells (ECs). We showed previously that FHF progenitors generate LV chamber-like contracting cardioids (LV cardioids) containing CMs and ECs.16 Following this method, we continued to inhibit WNT signaling while treating the aSHF/pSHF progenitors with BMP, FGF, insulin, and RA (patterning-2) (Figure 1A), resulting in the reproducible formation of contracting cavity-containing cardioids in high throughput (Figures 1I and 1J). In contrast to FHF-derived cardioids, aSHF/pSHF-derived cardioids require higher RA dosage at this stage. Efficient aSHF differentiation also necessitated a lower seeding density (Figures S1K and S1L) during mesoderm induction, as a high density led to inefficient CM differentiation and expression of neural markers within the organoid core (Figures S1K and S1K0 ). Precise cell counting before patterning-1 aggregation was essential for robust cardioid formation (Figure S1L). As a result, more than of the cardioid cells expressed the CM marker TNNI1 (Figures 1K and S1M) and low levels of SOX2, endoderm (FOXA2), and fibroblast (COL1A1) markers (Figure S1J). Finally, aSHF and pSHF progenitors differentiated efficiently into PECAM1 ECs in 2D when exposed to VEGF and forskolin after aSHF/pSHFpatterning-1 (Figures S1N and S1O). In summary, by applying in vivo-like signaling and cell number optimizations, aSHF/ pSHF progenitors can be differentiated efficiently into CM and endothelial lineages within the cardioid system.
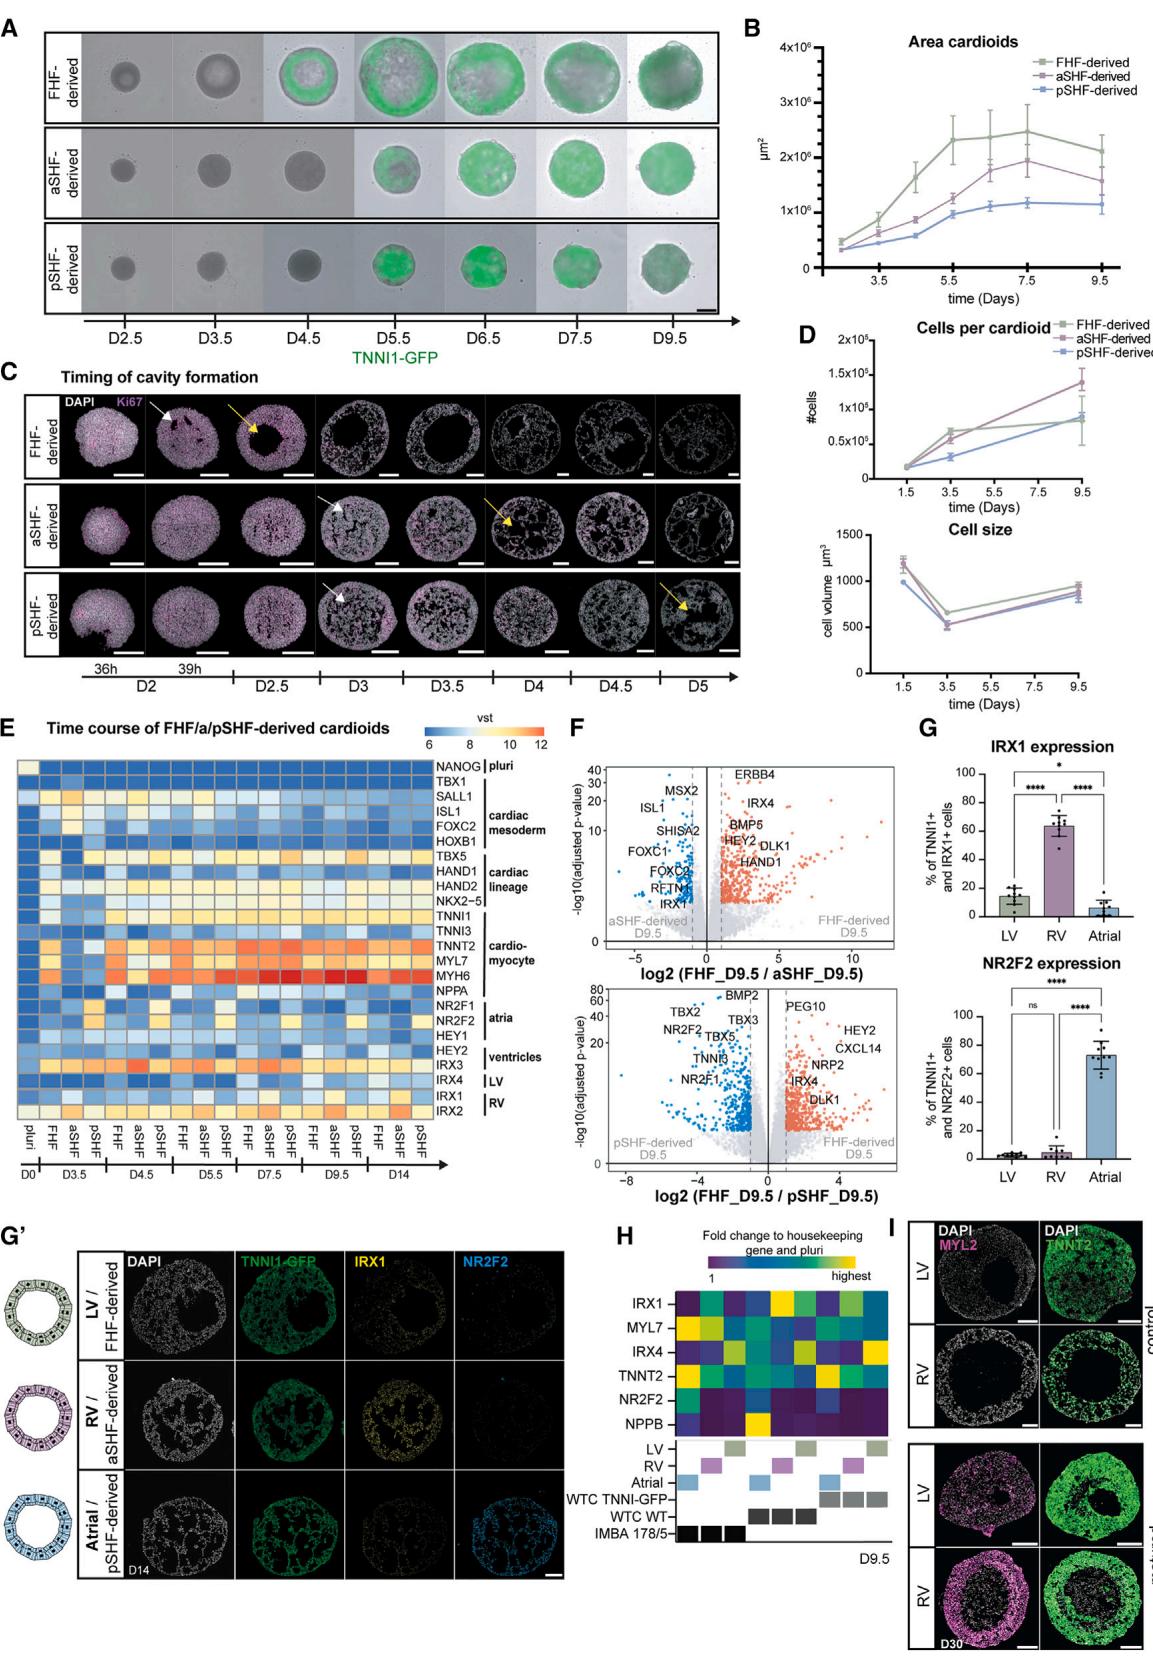
Figure 2. aSHF/pSHF-derived cardioids exhibit in vivo-like morphogenesis delay and gene expression (A) Representative whole-mount images of a time course for TNNI1-GFP-hPSC-derived cardioid subtypes. Scale bars, .
(B) Quantification of cardioid area change during differentiation in (A) , per time point.
© Ki67 immunostaining of cardioid cryosections, showing delayed cavity initiation (white arrow) and cavity expansion (yellow arrow).
(D) Representative quantification of cell number per cardioid and cell size change during differentiation; N = 3, n = 8 per time point.
(E) RNA-seq expression heatmap of lineage- and compartment-specific genes.
(F) RNA-seq volcano plot showing differentially expressed genes in indicated conditions.
(G) (G0) Lineage-specific immunostaining and (G) quantification (N = 3, n = 8–11), as specified.
(H) RT-qPCR expression heatmap of chamber-specific marker cardioids derived from different cell lines.
(I) MYL2 immunostaining in matured LV/RV cardioids. Indicated day of analysis (D). Scale bars, 200 mm, except where specified. Bar and dot plot graphs show
mean ± SD. Statistics: one-way ANOVA. vst, variance-stabilized transformed counts. *p < 0.05, **p < 0.01, ***p < 0.001, ****p < 0.0001. ns: not significant. N, biological replicate number; n: technical replicate number.
See also Figure S2.
¶ Formation of RV and atrial cardioids
During development, FHF progenitors differentiate into CMs that form the heart tube, while aSHF progenitors first proliferate and then differentiate together with pSHF progenitors at a later developmental stage.10 Consistently, a detailed time course analysis revealed a CM specification and morphogenesis delay in SHF cardioids (Figures 2A–2C and S2A), while proliferation rate and Ki67 expression were elevated in aSHF progenitors until day 4.5 (Figures 2C, 2D, and S2B). In addition, aSHF progenitors appeared more epithelial-like, as seen by higher CDH1 and lower CDH2 expression, reminiscent of in vivo. 19,21 The aSHF/pSHF cardioids were also smaller than FHF cardioids and showed delayed TNNI1 expression (Figures 2A, 2B, and S2A). The FHF cardioids were larger despite containing fewer cells than aSHF cardioids and similarly sized individual cells, indicating that the intercellular space accounts for the observed differences (Figures 2D and S2A). Global gene expression confirmed that structural CM gene expression was delayed in SHF cardioids (Figures 2E and S2C), and we observed a delay in cavity formation (Figure 2C). Thus, the staggered differentiation of SHF and FHF cardioids in vitro is consistent with the in vivo developmental timing and morphogenesis.
Next, we asked whether the acquisition of chamber identity also followed the developmental trajectory in aSHF/pSHFderived cardioids. In vivo, the FHF gives rise to the LV and a minor portion of atrial CMs, whereas the aSHF and pSHF give rise to the RV and atria, respectively.11 To answer that question, we compared the specification potential of aSHF/pSHF/FHF progenitors by adjusting the concentration of RA. We observed that aSHF progenitors gave rise to early RV-like identity , , , and ), while the pSHF progenitors differentiated into early atrial CMs , , and (Figures 2E–2G0 ). In a global gene expression comparison at day 9.5, we found that the top upregulated genes in aSHF cardioids included ISL1, IRX1, HEY2, and RFTN1 (Figures 2F and S2D), which have been implicated in ventricular identity and physiology. In contrast, in pSHF cardioids, TBX5, NR2F2, and NR2F1 were upregulated, consistent with early atrial identity (Figures 2F and S2D). These findings were confirmed on a protein level for IRX1, NR2F2, and HEY2 (Figures 2G, , and S2E). The specification of the CM subtypes was also achieved using H9 human embryonic stem cells (hESCs), different WTC human-induced PSC (hiPSC) sublines, and another independent hiPSC line (Figures 2H and S2F–S2H). In summary, aSHF progenitors specify into RV-like cardioids (RV cardioids), and pSHF progenitors form atrial cardioids (A cardioids), showing that the early priming of progenitors is crucial to obtaining different chamber identities in the developing heart.
To achieve further chamber specification and maturation, we tested several recently published ventricular CM signaling and metabolic treatments (Figure S2I).22–24 In an adapted combination of these conditions, LV/RV cardioids upregulated the key ventricular structural protein MYL2, chamber markers NPPA and NPPB, and showed a typical maturation shift in MYH7 and MYH6 expression ratio (Figures 2I and S2J–S2M), resulting in well-defined sarcomere structures and higher contraction amplitude (Figures S2L and S2N). However, as this approach interfered with atrial differentiation, we sought to identify the combination of factors promoting further atrial chamber maturation (Figure S2I). We found that the FGF and RA pathway activation and NOTCH and BMP signaling inhibition combined with metabolic maturation promoted the atrial chamber program , , , IRX4 , and MYL2 ) while strongly downregulating the heart tube and AVC-specific transcripts TBX2 and TBX3 (Figure S2O). Cumulatively, we demonstrated that we could specify and differentiate cardioids into the three chamber identities found in the embryonic heart.
¶ Specification of OFT and AVC cardioids
Besides the RV, aSHF progenitors differentiate into the OFT, which gives rise to the aortic and pulmonary valve and vessel structures.10 Abnormalities in OFT derivatives are the most frequent congenital heart defects.3 We observed that higher RA dosages promoted aSHF specification toward the RV identity (Figures 3A and S3A), while the absence of exogenous RA promoted the expression of OFT (WNT5A, ISL1, HAND2, and RSPO3) but not chamber markers (Figures 3B–3D, S3B, and S3C).19 OFT cardioids were more mesenchymal (MC)-like (Figure S3E), delayed in differentiation (Figure 3B), and smaller compared with RV cardioids (Figure 3I). Further optimization revealed that C59 (inhibits canonical and non-canonical WNT) led to higher expression of chamber markers in the RV cardioid, whereas XAV-939 (inhibits only canonical WNT) promoted upregulation of OFT genes (Figure S3D). OFT cardioids contained mostly TNNI1 CMs, and few showed fibroblast or endothelial marker expression (Figure S3G). As a functional validation, OFT cardioids displayed more efficient smooth muscle cell (SMC) differentiation propensity and TNNT2 ), -compared with the FHF that typically does not give rise to SMCs in vivo (Figures S3F and S3F0 ).25 They could also be stimulated by VEGF to form an inner EC layer and show MC cells upon treatment with EMT-promoting factors transforming growth factor (TGF-b) and FGF2 (Figure S3E). Thus, aSHF progenitors can be directed into OFT cardioids with SMC and endothelial EMT differentiation potential reminiscent of early valve and great vessel development.
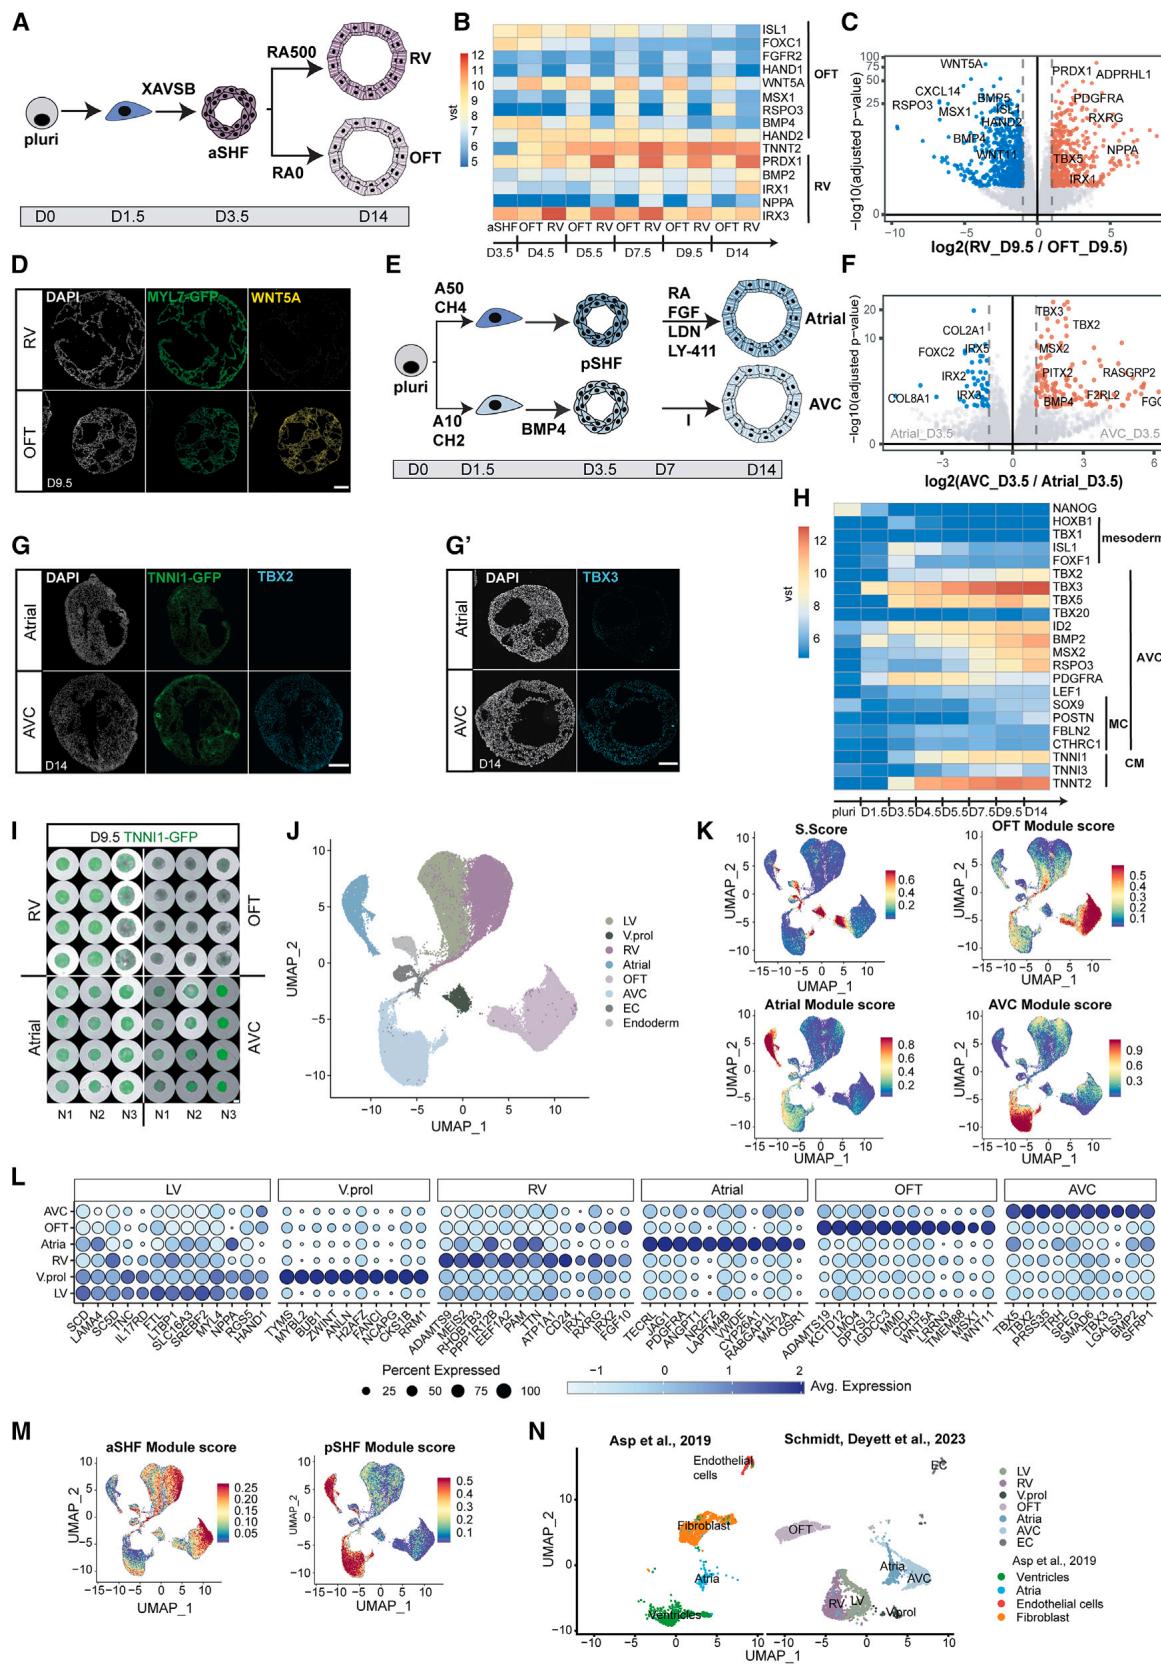
Figure 3. Specification of OFT/AVC cardioids and scRNA-seq in vivo comparison
(A) RV/OFT cardioid differentiation protocols, emphasizing treatment differences.
(B) RNA-seq expression heatmap time course of markers in developing RV/OFT cardioids.
© RNA-seq volcano plot showing gene expression differences between RV and OFT cardioids.
(D) In situ hybridization chain reaction cryosections of MYL7-GFP-hPSC-derived RV/OFT cardioids.
(E) A/AVC cardioid differentiation protocol, emphasizing treatment differences.
(F) RNA-seq volcano plot showing differentially expressed genes at indicated conditions.
(G) (G) TBX2 and (G0) TBX3 immunostaining on cryosections of A/AVC cardioids.
(H) RNA-seq expression heatmap time course of developing AVC cardioids. MC, mesenchymal.
(I) Whole-mount images of TNNI1-GFP-hPSC-derived RV/OFT/A/AVC cardioids (N = 3). Scale bars, 500 mm.
(J–N) scRNA-seq analysis comparing all protocols (N = 2, atrial: N = 1, n = 16–72). (J) scRNA-seq UMAP showing different clusters; V.prol, ventricular proliferating.
(K) Expression of S. score (cycling cells), OFT, AVC, and atrial gene modules. (L) Dot plot showing the most expressed genes of each CM cluster. (M) Expression of
aSHF and pSHF gene modules. (N) UMAP showing integration with the scRNA-seq ex vivo dataset of Asp et al.26 Samples were randomly downscaled to 3,000
cells. Indicated day of analysis (D). vst, variance-stabilized transformed counts. Scale bars, 200 mm. Module gene lists are in Table S2.N, biological replicate number; n: technical replicate number.
See also Figure S3.
In vivo, pSHF-derived CMs comprise most of the atria and contribute to the AVC, a crucial region where valves and pacemaker elements develop. Studies in mice showed that pSHF precursors are located in different primitive streak areas and will migrate out at different time points (AVC earlier, atrial later).20,27,28 Thus, we hypothesized that mesoderm induction conditions for the two pSHF populations will differ. Indeed, we found that intermediate Activin and low WNT activation levels during mesoderm induction resulted in higher expression of primitive streak markers at day 1.5 (Figures 3E and S3H), leading subsequently to the upregulation of AVC-specific genes (TBX2 and TBX3) and downregulation of atrial genes at day 9.5 (Figure S3I). The pSHF signature at day 3.5 remained in both pSHF populations (Figure S3I). Another difference between AVC and atrial development in vivo is the high exposure of the AVC region to BMP ligands. As hypothesized, the addition of BMP4 at the patterning stage upregulated early AVC markers (Figure S3I), and optimized induction and patterning (Figure 3E) drove pSHF specification toward AVC identity (Figures 3F–3H). AVC cardioids were smaller than atrial (Figure 3I), and only a few cells were PECAM1 or COL1A1 (Figure S3G). Overall, the subspecification of pSHF progenitors into atrial or AVC cardioids started as early as the mesoderm induction stage, reflecting the developmental plasticity of the pSHF.
¶ scRNA-seq analysis of cardioids and in vivo comparison
Human embryonic cardiogenesis between 19 and 28 dpf is inaccessible and poorly characterized, and current single-cell RNAseq (scRNA-seq) datasets typically correspond to later developmental stages. Thus, we aimed to compare all five cardioid subtypes by scRNA-seq analysis and explore the specification differences of early human heart compartments beyond well-established animal markers. We performed scRNA-seq on LV (day 7.5), RV, AVC, OFT, and A cardioids (day 9.5) matched for their structural CM differentiation stage (see Figures 2A–2C). Quality control filtering required the removal of only of cells, and uniform manifold approximation and projection (UMAP) cluster analysis separated different cell types and compartment-specific CMs (Figure 3J). The clustering revealed small non-CM (ECs and endoderm) populations, efficient CM differentiation, and a reproducible cluster arrangement of biological replicates (Figures S4A and S4B). As in development, many early ventricular CMs had a proliferative transcriptomic signature and a high S. score (Figures 3J–3L). Compartment-specific CM clusters diverged, including the RV and LV (Figures S3J–3L and S4C), and expressed literature-curated gene modules (Figures 3L, 3M, and S3J–S3L). Many of the differentially expressed genes are well-known markers. Still, others have not been highlighted before, such as PDGFRA (atrial), CD24 (RV), TMEM88 (OFT), and TRH (AVC) (Figures 3L and S3J), revealing a valuable resource window into a hidden human developmental stage. We then compared these data corresponding approximately to 25–28 dpf of human cardiogenesis with two scRNAseq datasets, derived from dissected human embryonic ventricles, atria,26 and OFT (30–50 dpf),29 using the same parameters. Randomized downsampling to facilitate integration with the in vivo cell numbers revealed a remarkable overlap in the clustering of ventricular and atrial CMs (Figures 3N and S3N). Since the in vivo samples represented a later developmental stage, there was an expected larger population of fibroblasts and a more mature but similar OFT signature. Overall, the cardioid subtype scRNA-seq analysis confirmed the compartment-specific CM identities, providing an invaluable resource to reveal early specification mechanisms at an obscure stage of human development.
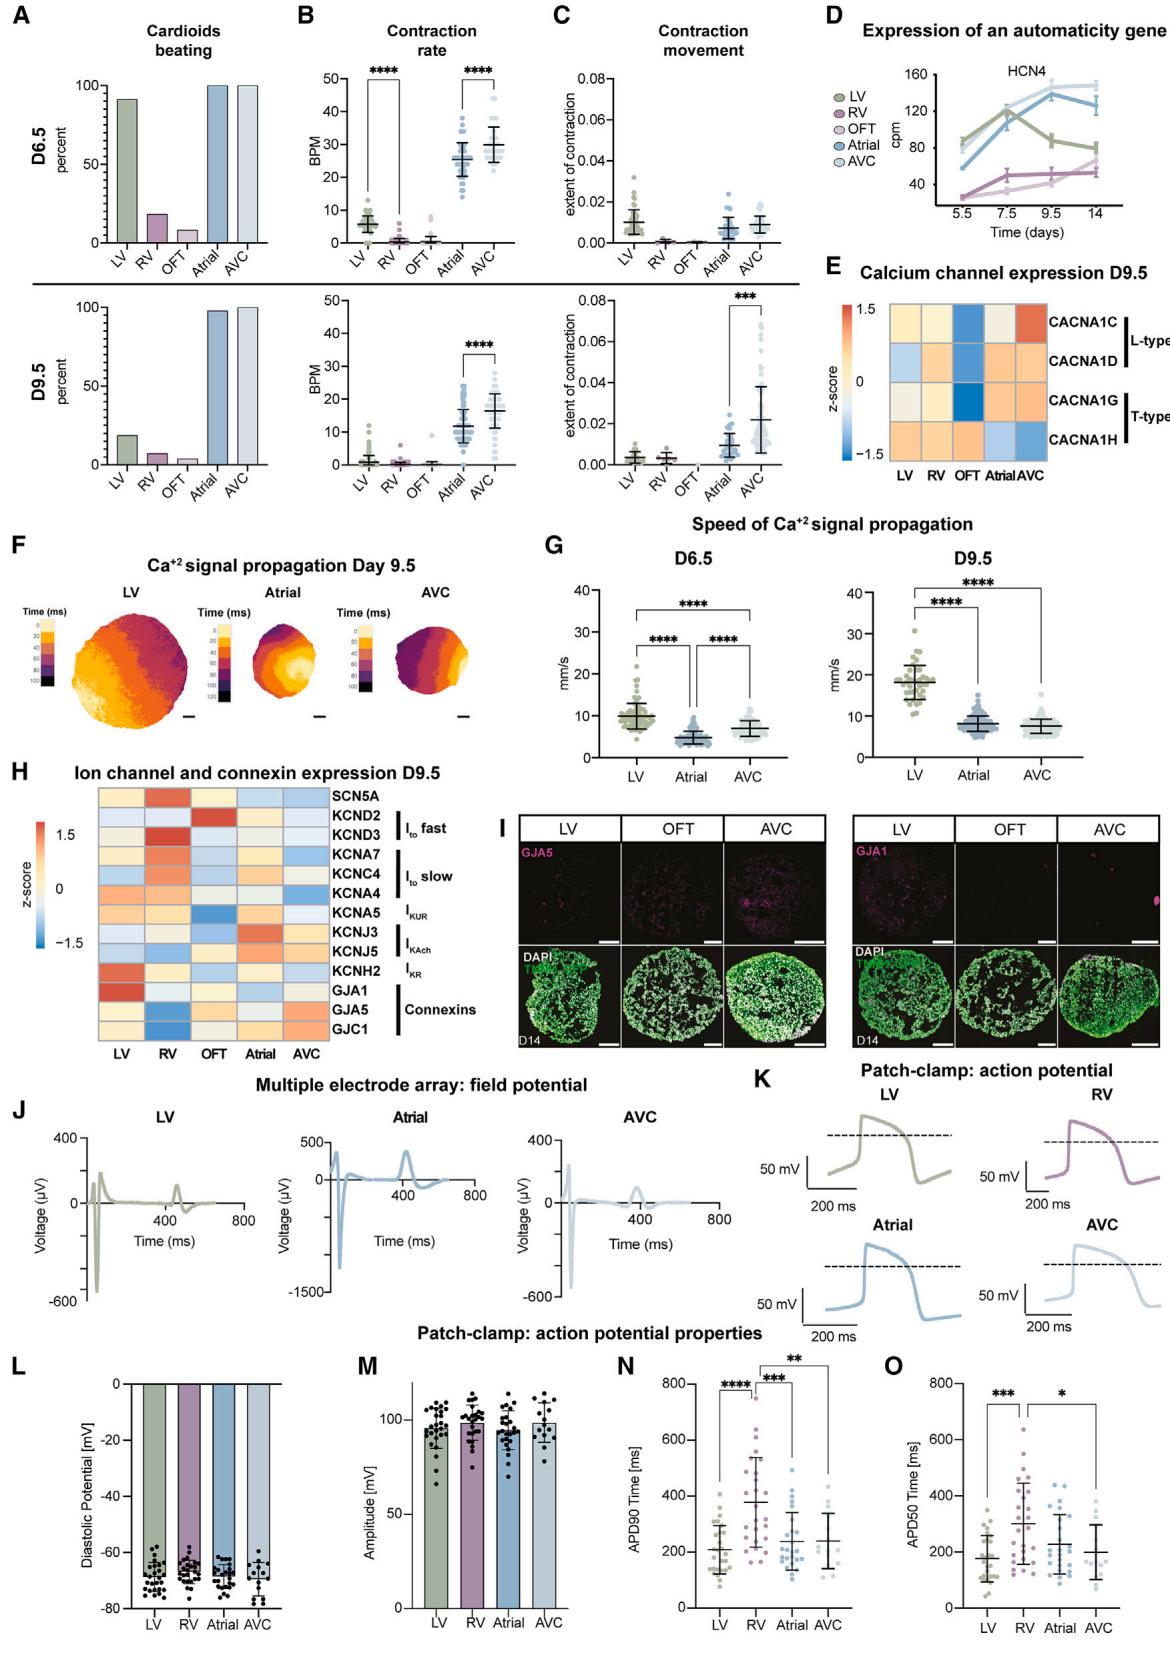
Figure 4. Functional characterization of cardioid subtypes(A–C) Experiments were performed in N = 2–7, n = 80, 65, 48, 48, and 33 cardioids for LV, RV, OFT, atrial, and AVC, respectively. All experiments in the WTC11 hPSCs.
(A) Quantification of the percentage of cardioids that spontaneously contract within 1 min of recording.
(B) Quantification of beats per minute (BPM).
© Quantification of contraction extent. Non-beating cardioids were excluded.
(D) RNA-seq quantification of HCN4 expression over time. Each dot represents the mean ± SD. cpm, counts per million.
(E) RNA-seq expression heatmap with indications.
(F) Representative calcium signal propagation image of TNNT2-GCaMP6f-hPSC-derived LV/A/AVC cardioids for one beat. Underneath, distance scale bars, 200 mm.
(G) Quantification of signal propagation speed across TNNT2-GCaMP6f-hPSC-derived cardioid subtypes. Each point represents the mean speed for all beats of a single cardioid. LV: N = 3, (n = 71, day 6.5; n = 40, day 9.5); atrial: N = 3, n = 159; AVC: N = 3, n = 85.
(H) RNA-seq expression heatmap with indications.
(I) Immunostained LV/OFT/AVC cardioid cryosections.
(J) Representative MEA FP curves of LV/A/AVC cardioids.
(K–O) Patch-clamp analysis of single CMs dissociated from WTC11-hPSC-derived cardioids. Each point represents the mean from one cell for 15–20 consecutive APs. N = 1, n: LV: 27, RV: 26, Atrial: 25, AVC: 15. (K) Representative AP curves. (L) Diastolic potential. (M) AP amplitude. (N) AP duration (APD90). (O) APD50. Indicated day of analysis (D). Scale bars, 200 mm. All graphs show mean ± SD. Statistics: one-way ANOVA. *p < 0.05, **p < 0.01, ***p < 0.001, ****p < 0.0001. N, biological replicate number; n: technical replicate number.
See also Figure S4.
¶ Functional characterization of the five cardioid subtypes
The heart must function while developing; thus, understanding early cardiac activity during embryonic heart compartment formation is imperative. We hypothesized that the cardioid platform could investigate functional developmental differences between compartments in the absence of human in vivo data. Contraction behavior of day 6.5 cardioid subtypes showed spontaneous contraction (automaticity) in of LV, atrial, and AVC, and a greater extent of contraction. In contrast, only of RV cardioids contracted spontaneously, and of OFT cardioids showed a lower contraction extent (Figures 4A, 4C, and S4B; Video S1). On day 9.5, A/AVC cardioids automaticity was maintained, while the contraction rate decreased in LV, RV, and OFT cardioids (Figures 4A–4C; Video S1). Similar to in vivo, 30 the loss of automaticity correlated with the expression downregulation of the HCN4 potassium/sodium channel found in pacemakers (Figure 4D). These observations were reproducible across both technical and biological replicates and cell lines (Figures 4A–4C and S4A). To gain further insights into signal propagation in cardioids, we generated GCaMP6f reporter lines to trace transients (Figure S4C) and found that each cardioid subtype has its distinct wave pattern; the A, AVC, and LV cardioids beat very regularly ( beating), while RV cardioids tended not to contract but exhibited waves that constantly signaled in one long burst (‘‘re-entry,’’ ) (Figure S4C; Video S2).
When we investigated how transits across the whole cardioid, LV cardioids showed a prolonged transient, compared with atrial and AVC,19 as reported in vivo. 31 The signal propagation speed across cardioids differed between subtypes and differentiation stages, where LV cardioid’s transients further increased from day 6.5 to propagate faster than A/AVC cardioids at day 9.5 (Figures 4F and 4G). This is consistent with the upregulation of GJA1 (CX43), specifically in LV cardioids, which have high conductance, and the upregulation of GJC1 (CX45), in AVC cardioids, which have low conductance properties (Figure 4H and 4I).32 Within one cardioid, the origin of signal propagation varied between beats (Video S2). We also observed differences between cardioid subtypes, as reflected by expression differences in and L-type channels (Figure 4E). Overall, compartment-specific cardioids have distinct contraction and signal propagation profiles at these early embryonic stages, which are not accessible in humans.
During early heart development, ion channel expression is relatively uniform, but in later stages, chamber-specific gene expression profiles and species-specific action potential (AP) shapes emerge, often measured by field potential (FP) or AP duration (APD).33 The cardioid subtypes also develop distinct ion channel expressions by day 9.5 (Figure 4H). As it is crucial to characterize how FPs and APs of early human CM subtypes differ within 3D cardioids, 2D monolayers derived from cardioids, and in single 2D CMs, we used multiple electrode arrays (MEAs), voltage-sensitive dye (FluoVolt) imaging, and manual patch clamp. Whole cardioids were placed on a electrode grid to measure the FP at a high spatial resolution. We observed FP diversity across cardioid subtypes (Figures 4J and S4H–S4L), where a single LV cardioid showed a more homogeneous signal propagation FP spread than A/AVC cardioids (Figures S4I–S4L). In 2D monolayers, using FluoVolt, we found that the LV/RV CMs had longer APDs than atrial (Figures S4M–S4P). Patch-clamp analysis on single CMs revealed that the APD in atrial/AVC was shorter than in RV CMs, confirming the trends in monolayers, and similar to human primary CMs (Figures 4K, 4N, 4O, and S4Q–S4U). The diastolic potential was around (Fig-ure 4L), upstroke velocity (Figure S4S) and amplitude (Figure 4M) of the APs resembled the most advanced in vitro models,34 and importantly, specific CMs were electrophysiologically homogeneous. Taken together, the electrochemical signaling of cardioid subtypes is diverse and fetal-like, enabling the functional investigation of early human cardiogenesis.
¶ Multi-chamber integration of cardioid subtypes
Embryonic cardiac progenitors become specified in neighboring areas and self-sort to form separate compartments,11 but studying the molecular basis of sorting mechanisms in embryos is challenging. To test whether aSHF/pSHF/FHF progenitors have the same self-sorting potential as their in vivo counterparts, we dissociated day 3.5 cardioid subtypes derived from either H2B-GFP- or LMNB1-RFP-hPSCs, mixed them (Figure 5A), and observed self-sorting within while keeping their CM identity until day 7.5 (Figures 5B–5D, S5A, and S5B). In contrast, progenitors of the same subtype tended not to sort upon mixing (Figures , 5C, and S5A0 ). The sorting was consistent with the specific cadherin and TF expression signatures in the different progenitors, reminiscent of in vivo (Figures 5D, 5E, 5E0 , and S5C).21 Compartments retained the appropriate chamber fate (Figure S5D), confirming that the first two stages of differentiation determine lineage identity and that co-differentiation was possible from day 3.5 onward.
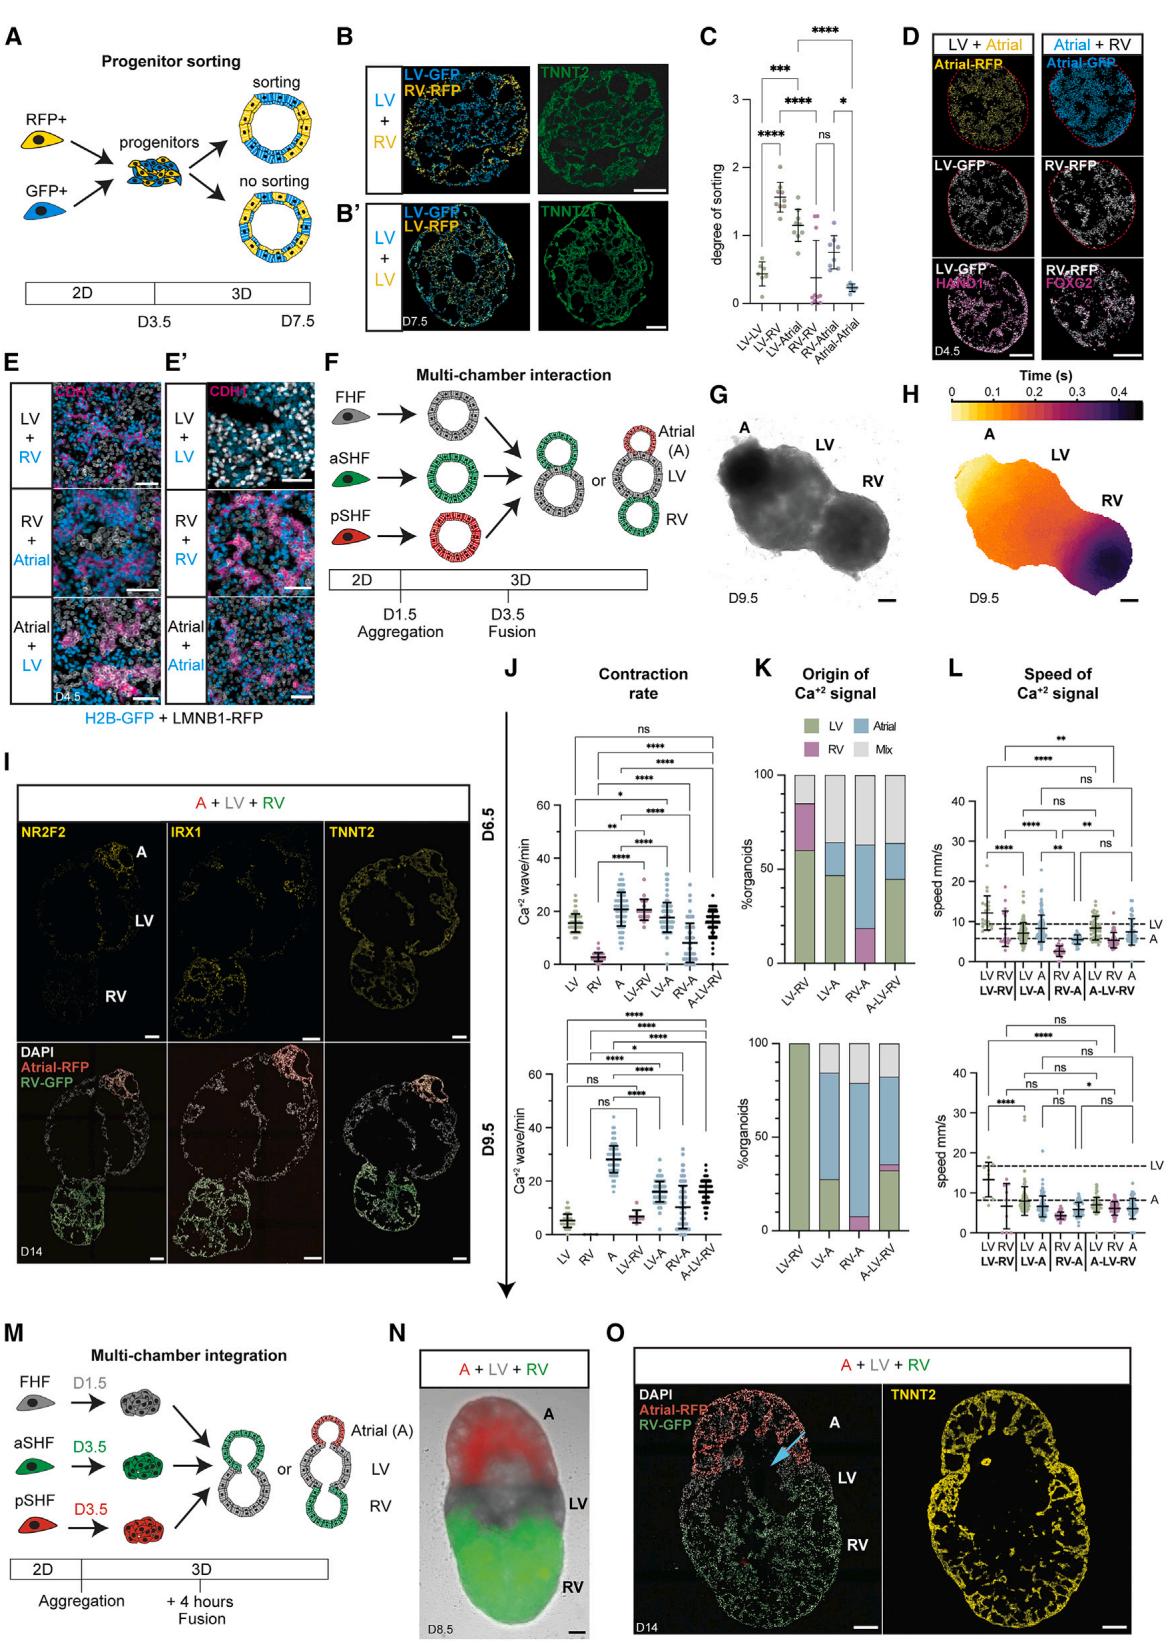
Figure 5. Multi-chamber integration of cardioid subtypes (A) Sorting experiments schematic. (B and B0 ) Representative cryosections of hPSC-H2B-EGFP/hPSC-LMNB1-RFP-derived cardioids from (B) different or (B0 ) the same progenitors. © Sorting quantification of H2B-GFP and LMNB1- progenitors; , .
In vivo, cardiac chambers co-develop seamlessly; however, we lack a multi-chamber model to study this crucial stage and the complex process of cardiac morphogenesis. As progenitors are specified and sorted already at day 3.5, we hypothesized that co-developing cardioids would also remain separate at this stage but undergo morphogenesis together. When we placed different cardioid subtypes together on day 3.5 (Figure 5F), they co-developed to form a structural connection after (Figure S5E and S5F). Still, they maintained their distinct identities and compartments (Figures 5G and 5I). In contrast, when we placed cardioid subtypes together on day 5.5, they failed to connect by day 9.5 (Figure S5E). Cardioids only co-developed when combined on day 3.5, electrochemically connected, and contracted in a coordinated manner by day 6.5 (Figures 5H and S5G; Video S3), demonstrating functional interaction. When we combined the progenitors just before cavity formation (Figure 5M) (day 1.5 FHF/LV; day 3.5 aSHF/RV and pSHF/A), we found that they also shared a lumen while retaining CM identity (Figures 5M–5O, S5Q, and S5R). Hereafter, we refer to these structures as multi-chambered cardioids. Multi-chambered cardioids co-developed in all combinations, allowing us to study the interactions of two-chambered cardioids or three-chambered cardioids (atrial, LV, and RV fusions; Figures 5G–5I and S5G; Video S3) in the same order as within the developing embryonic heart or in alternative experimental arrangements (Figure S5J and S5K; Video S3).
The directionality of the electrochemical signal propagation in early cardiogenesis is established gradually, initially without pacemakers, valves, and septa. Yet, this process has not been tracked in human embryos.35 In mice and chicken, the FHFderived heart tube and early LV region start to contract first but lose automaticity as they mature .36,37 In contrast, the developing atria and AVC start to beat later and maintain automaticity until the cardiac pacemakers have formed, ensuring unidirectional signal motion and flow from the atria over the LV to the RV and OFT.32 To investigate whether the multi-chambered cardioid system recapitulates this process, we measured its signal propagation and FP in a whole organoid and its compartments. We found that each beat originated typically from one compartment and then propagated through the entire multi-chambered cardioid (Figures 5H and S5K; Video S3), generating unidirectional signal and FP propagation in A-LV-RV cardioids. On day 6.5, most signals originate from the LV region (Figure 5K) and propagate through the RV area, which does not beat independently (Figures 4A, S5G, and S5H). We validated these observations by showing that multi-chambered cardioids paced by the LV region on day 6.5 maintained a similar beat frequency as LV cardioids (Figure 5J). From days 6.5 to 9.5, the contraction rate of A cardioids increased while that of LV cardioids decreased, which was consistent with the atrial region becoming gradually dominant in pacing the two- and three-chamber cardioids (Figure 5J). Consistently, as the multi-chambered cardioids developed to day 9.5, the signal and FP originated predominantly from the atrial region in all combinations, and the signal propagation speed became atrial dictated with a homogeneous FP profile in all subcompartments (Figures 5H, 5J, 5K, and S5K–S5P; Video S3). Interestingly, compartment interactions decreased signal propagation speed in the LV region specifically and in the whole multi-chamber cardioid (Figures 5L and S5I). Thus, our comprehensive analysis platform deciphers the ontogeny of electrochemical signal propagation in multi-chamber cardioids and their subcompartments and how their interactions affect co-developing individual chambers.
¶ Mutations cause compartment-specific defects in cardioids
Mutations in genes encoding cardiac TFs cause compartmentspecific congenital defects, where autonomous and non-autonomous effects are difficult to disentangle. Moreover, speciesspecific TF expression and functional variations are becoming increasingly prominent.38 To genetically validate the specificity of the human cardioid compartment platform, we generated knockout (KO)-hPSCs for the prominent TFs ISL1 and TBX5 and the less-characterized FOXF1 (Figures S6A, S6G, and S6J).
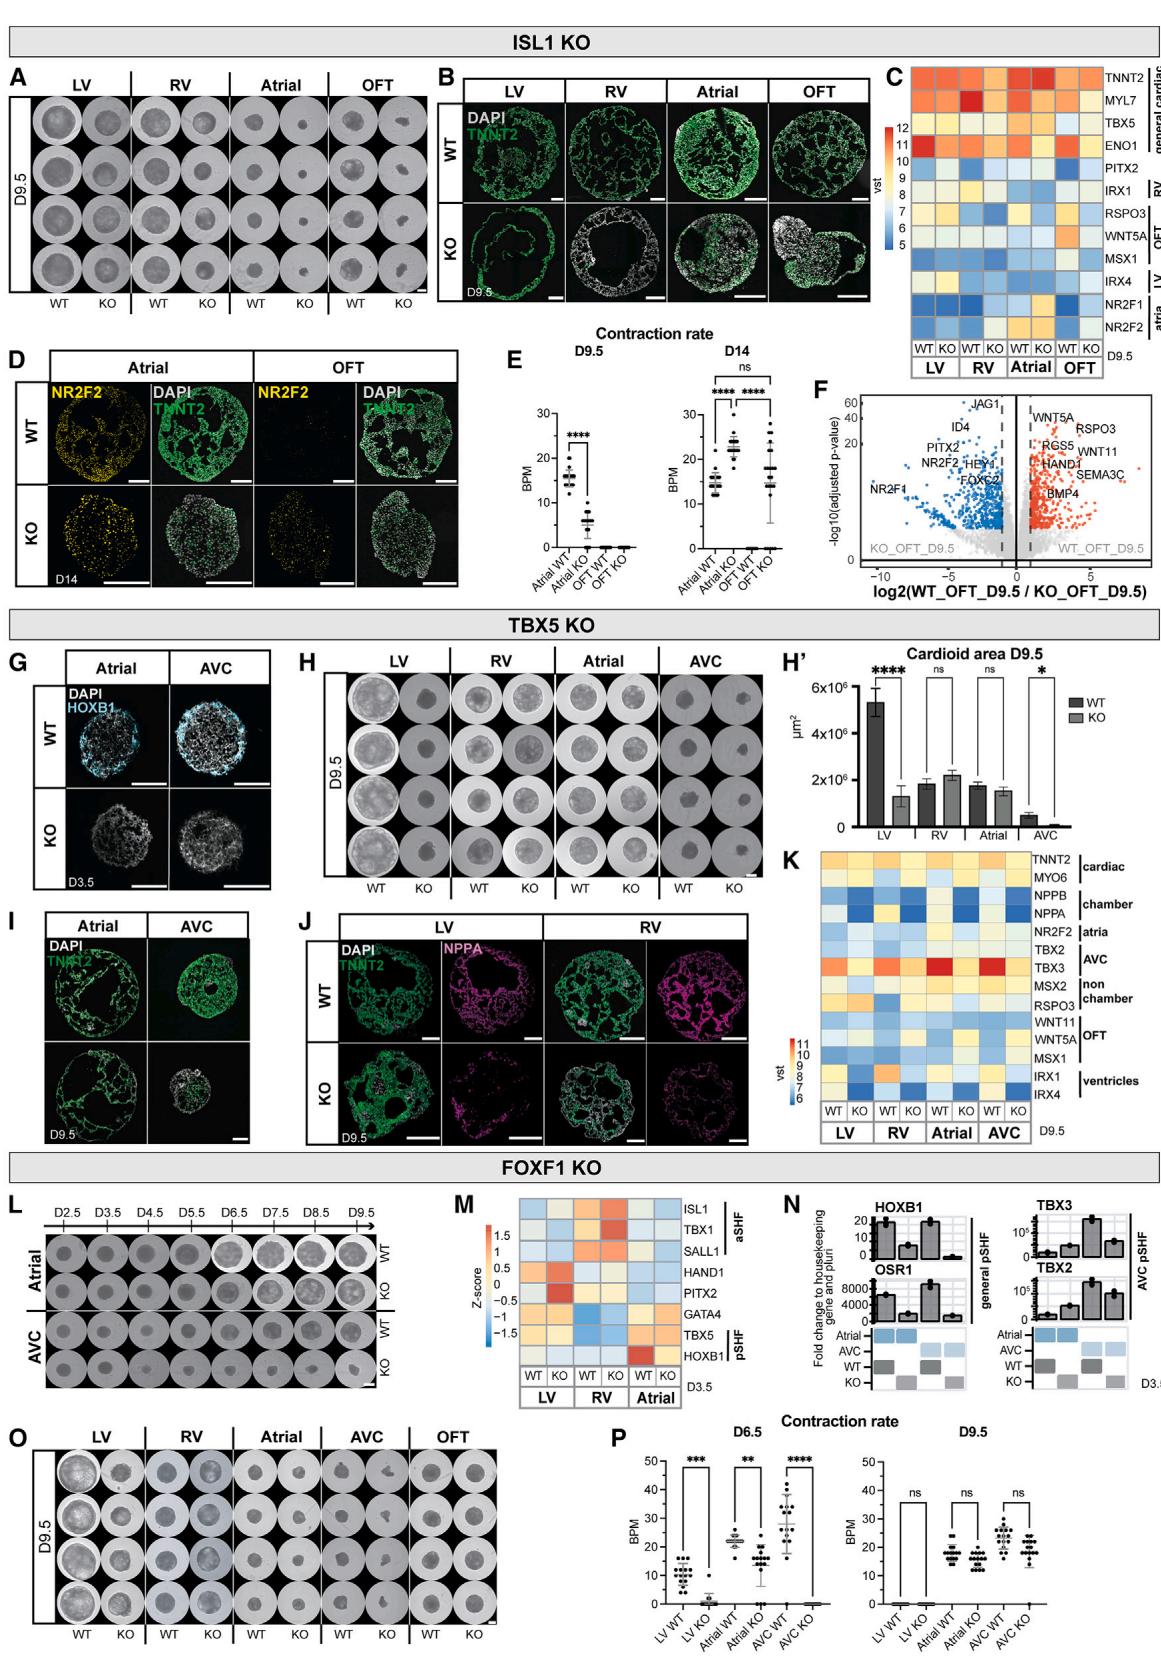
Figure 6. Mutations cause compartment-specific defects in cardioids
(A) Whole-mount images of WT and ISL1-KO cardioids using indicated protocols; scale bars, .
(B) Immunostained cryosections in indicated conditions.
© RNA-seq expression heatmap shows misregulated genes in ISL1-KO cardioids, compared with WT.
(D) Immunostained WT and ISL1-KO A/OFT cardioids.
(E) Contraction analysis of A/OFT WT and ISL1-KO cardioids (N = 1, n = 24).
(F) RNA-seq volcano plot showing global gene expression differences in indicated conditions.
(G) RNA-scope staining as specified.
(H and H0) (H) Representative whole-mount images of TBX5-KO and WT cardioids and (H0) area quantification (N = 3, n = 24). Scale bars, 500 mL.
(I and J) Immunostained cryosections of cardioids as indicated.
(K) RNA-seq expression heatmap showing differentially expressed developmental genes as specified.
(L and O) Whole-mount images of a time course in indicated conditions. Scale bars, 500 mm.
(M) RNA-seq expression heatmap showing misregulated marker genes as indicated.
(N) Representative RT-qPCR in indicated conditions.
§ Contraction analysis as specified (N = 1, n = 24). Indicated day of analysis (D). vst, variance-stabilized transformed counts. Scale bars, 200 mm, unless
otherwise specified. Bar graphs show mean ± SD. Statistics: one-way ANOVA. *p < 0.05, **p < 0.01, ***p < 0.001, ****p < 0.0001. ns: not significant.
N, biological replicate number; n: technical replicate number.
See also Figure S6.
Mutations in ISL1 are known to cause severe cardiac malformations in the OFT and RV, partial defects in the atria, and lethality in mice at embryonic day (E)10.5.39 In a time course analysis of ISL1-KO cardioids from days 2.5 to 9.5, we noted severe impairment of cavity morphogenesis and size at day 5.5 in the OFT/A cardioids, while the impact on RV cardioids was more subtle (Figure S6D). On day 9.5, KO and wild type (WT) showed a significant size difference in all cardioid subtypes (Figures 6A and S6E). We found that gene expression was affected already at day 3.5, as evidenced by lower levels of MEF2C and MYOCD, indicative of aberrant differentiation progression (Figure S6B).40 OFT cardioids showed the most drastic gene expression changes, with HAND2 and BMP4 being downregulated and TBX5 being upregulated (Figure S6B).39 In A cardioids, the pSHF marker HOXB1 was downregulated (Figure S6B), while NR2F2, RSPO3, WNT5A, and MYL7 were misregulated in all subtypes at day 9.5 (Figure 6C). The CM differentiation efficiency was severely affected in the KO-RV cardioids, noticeably lower in A/OFT cardioids, while the LV was less affected (Figure 6B). Although A cardioids still maintained their identity, albeit with delayed differentiation and onset of contraction (Figures 6B–6D and S6C), OFT cardioids exhibited a global gene expression shift to atrial , , and WNT5A ) identity (Figures 6D, 6F, and S6F).41,42 Consistent -with the gene expression analysis, most ISL1-KO OFT cardioids started beating at a similar rate as A cardioids on day 14 (Figure 6E). Thus, the cardioid platform mimics aspects of in vivo ISL1-KO compartment-specific defects, allowing human-specific and autonomous dissection of specific effects at high resolution.
TBX5, another prominent cardiac TF, is a critical regulator in FHF and pSHF progenitors responsible for driving the chamber gene expression program.43,44 Mutations in TBX5 lead to atrial and ventricular septal defects and conduction disorders and are associated with Holt-Oram syndrome patients.43 When we differentiated TBX5-KO cardioids, global gene expression analysis on day 3.5 revealed that aSHF markers got upregulated in TBX5-KO A/AVC cardioids while the pSHF-specific gene
HOXB1 was downregulated, consistent with in vivo findings (Figures 6G and S6H).44 TBX5-KO-LV cardioids upregulated HAND2 and FGF10 and downregulated NKX2-5 and GATA4 (Figure S6H). In contrast, KO-RV cardioids showed no major defects except for FOXC2 upregulation on day 3.5 (Figure S6H). On day 9.5, we observed severe morphogenetic phenotypes in LV/AVC cardioids (Figures 6H, , and S6H), where AVC CMs failed to differentiate (Figure 6I). KO-LV/RV/A cardioids mainly featured inefficient CM differentiation, with downregulation of TNNT2 and the chamber-specific marker NPPA (Figures 6I–6K). All TBX5-KO cardioid subtypes showed a prominent defect in ventricular chamber markers expression and upregulation of non-chamber markers TBX2 and WNT5A in KO-RV/LV cardioids (Figure 6K), similar to in vivo. 45 TBX5-KO cardioids also lost the ability to spontaneously contract across all subtypes and time points (Figure S6I). Overall, the TBX5-KO showed specific phenotypes at different stages; while LV/A/AVC cardioids were affected already as progenitors, RV cardioids featured a mild phenotype at the CM specification stage.
Finally, FOXF1 is a specific regulator of the pSHF lineage; mutations lead to atrial septation defects, and KO mice die early at E8.0 due to defects in extraembryonic mesoderm, precluding further analysis of cardiac phenotypes.46,47 When we analyzed FOXF1-KO cardioid subtypes, we observed at day 3.5 an earlier onset of cavity morphogenesis in A cardioids (Figure S6J, yellow arrow). In contrast, the KO-AVC cardioids failed to form full cavities (Figures 6L and S6L). The main pSHF (HOXB1 and OSR1) and AVC markers (TBX2 and TBX3) were downregulated in FOXF1-KO cardioids (Figures 6M and 6N), consistent with pSHF specification failure. Only a few genes were misregulated at day 3.5 in KO-LV/RV cardioids, including upregulation of PITX2 and TBX1, respectively (Figure 6M). On day 9.5, the KOLV/AVC cardioids were smaller (Figures 6O and S6K). Interestingly, KO-A cardioids acquired a more ventricular identity and developed more extensive cavities, while KO-AVC cardioids failed to differentiate efficiently (Figures S6L–S6N). As expected, we did not observe a severe phenotype in KORV/OFT cardioids, except for the downregulation of NPPA in all subtypes (Figures 6O, S6L, and S6M). A less severe phenotype appeared in the KO-LV cardioids, where genes involved in cardiac contraction (ENO1) were downregulated (Figure S6M), leading to a lower beating rate (Figure 6P). KO-A cardioids also showed a lower beating rate, while KO-AVC cardioids did not contract at day 6.5 (Figure 6P). These results suggest that FOXF1 has compartment-specific roles, particularly in the pSHF lineage, showing differential effects in A vs. AVC cardioids. In summary, the cardioid platform can be employed to dissect human stage- and compartment-specific genetic cardiac defects of specification, morphogenesis, and function without compensatory mechanisms present in the embryo.
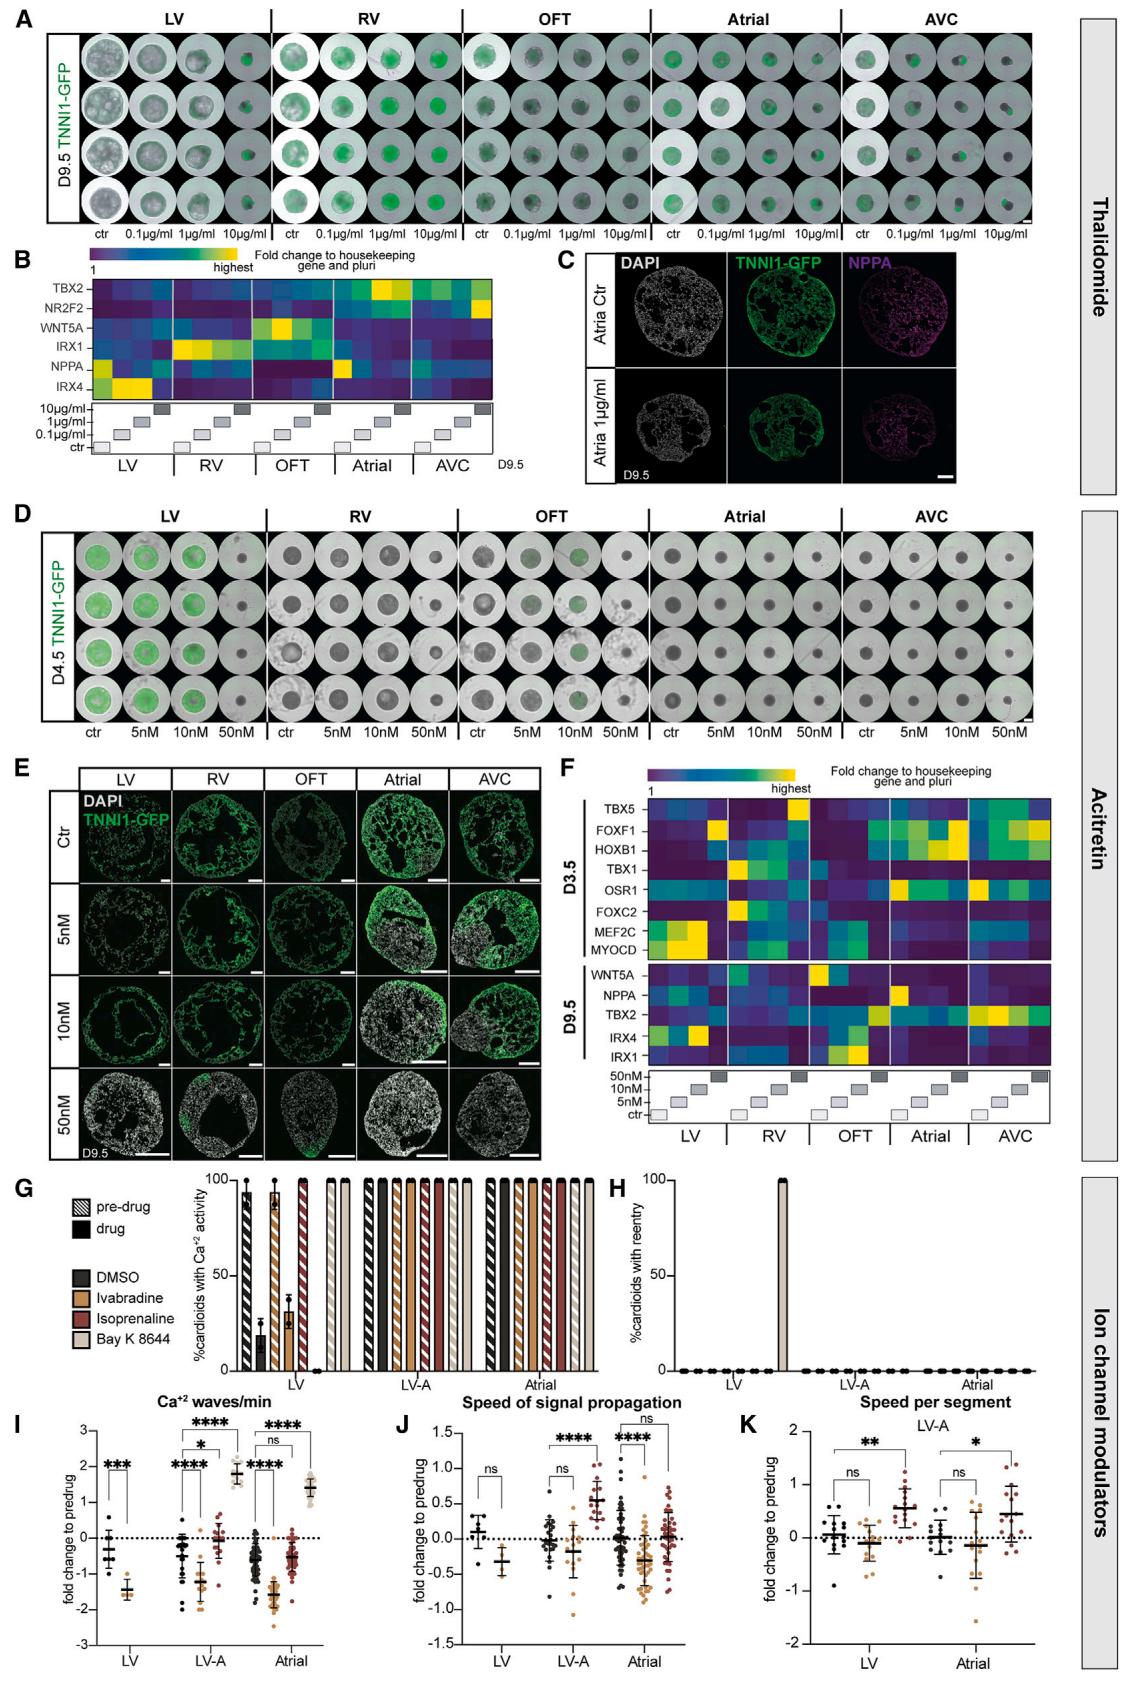
Figure 7. A multi-chamber cardioid platform for screening teratogen/drug-induced cardiac defects
(A–F) All cardioids were induced with teratogens starting from day 0 until day 9.5. Ctr, control.
(A) Representative whole-mount images of hPSC-TNNI1-GFPderived cardioids in indicated conditions. Scale bars, 500 mm.(B) Representative RT-qPCR of thalidomide-treated cardioids showing lineage-specific genes. © Immunostained cryosections of A cardioids treated with thalidomide. (D) Representative whole-mount images of hPSC-TNNI1-GFP-derived cardioid subtypes treated with acitretin as indicated. Scale bars, 500 mm. (E) Cryosections of hPSC-TNNI1-GFP-derived cardioid subtypes treated with acitretin as specified. (F) Representative RT-qPCR of acitretin-treated cardioids.
(G–K) Ca2+ signal analysis for indicated cardioid subtypes. At day 9.5, before drug treatment (pre-drug) and after drug treatment (drug) of DMSO (control), ivabradine, isoprenaline, and Bay K 8644. N = 2, n = 16. Check Table S3 for speed analysis exclusions. (G) Percentage of cardioids with calcium activity. Dots: N.
(H) Percentage of cardioids with calcium re-entry. Dots: N. (I) Fold change of Ca2+ waves/min normalized to pre-drug. Dots: n. (J) Fold change of signal propagation speed normalized to pre-drug. Dots: n. (K) Fold change of speed per segment normalized to pre-drug. Dots: n. hPSCs: WTC11. Indicated day of analysis(D). Scale bars, 200 mm, except where specified. All bar graphs show mean ± SD. Statistics: one-way ANOVA. *p < 0.05, **p < 0.01, ***p < 0.001, ****p < 0.0001. ns: not significant.
N, biological replicate number; n: technical replicate number.
See also Figure S7.
¶ A comprehensive screening platform for teratogen and drug effects
Beyond genetic origins, congenital heart defects can also be caused by teratogens (e.g., drugs, toxins, metabolites).48 Currently, we still miss human systems to investigate, in a high-throughput and easily quantifiable manner, whether teratogens cause compartment-specific cardiac defects.49 We first confirmed that a non-teratogenic factor, Aspirin, did not cause any morphological or significant gene expression differences (Figures S7A and S7B).49,50 Next, we tested thalidomide, a well-known teratogen in humans but not rodents, that interferes with TBX5 function, causing severe cardiac and limb defects.51,52 We used the cardioid platform to dissect the effects of thalidomide at concentration ranges found in the human plasma53 and detected previously unseen striking effects on the AVC compartment, intermediate phenotypes in LV/RV cardioids, and more subtle effects on A/OFT cardioids (Figures 7A and S7G). Gene expression profiles and immunostaining of treated samples revealed the downregulation of the TBX5 target NPPA for all lineages except for the RV and OFT and a dosagespecific misregulation of compartment identity markers NR2F2, IRX1, and IRX4 (Figures 7B and 7C).
Next, we considered retinoid derivatives, used in treatments against leukemia, psoriasis, and acne, as another class of compounds known to induce congenital defects, particularly malformations of the AVC and OFT derivatives. Since RA plays a crucial role during heart development, we expected the cardioid platform to allow us to dissect the underlying stage-specific mechanisms. When we tested acitretin and isotretinoin (data not shown), we found that strikingly low dosages caused severe compartment-specific and stage-specific effects. OFT/A/AVC cardioids had defects in specification, patterning, and morphogenesis when treated with acitretin (Figures 7D, 7E, S7C, and S7C0 ). Surprisingly, when using trans-retinol, we only saw a severe morphological effect in OFT cardioids, while all the other subtypes were unaffected (Figures S7E and S7E0 ). In OFT cardioids, retinoids caused the downregulation of OFT genes and upregulation of ventricular but not atrial genes (Figures 7F and S7F). Moreover, OFT cardioids treated with retinoids differentiated earlier into CMs (Figures 7D and S7D). These data suggest that the cardioid system is surprisingly sensitive to different retinoid compounds exhibiting drug- and compartment-specific effects.
Finally, we considered that the multi-chamber platform could be used to test for the effects of drugs on single or interacting cardioids, as such approaches are currently limited, despite the urgent need to prevent drug-induced electrochemical perturbations in developing fetuses. At first, we confirmed that MEA three-chamber cardioid analysis could be used in principle to detect elongated FPs upon treatment with the potassium channel modulator 4AP (Figures S7H and S7I). To increase throughput, we focused on measuring signal propagation in A, LV, and two-chambered LV-A cardioids treated with different electrophysiological modulators, such as ivabradine (HCN4 channel blocker), isoprenaline (stimulates beta-adrenoreceptors), and Bay K 8644 (stimulates L-type calcium channels). Although the activity of LV cardioids was affected by the drug-solvent DMSO and showed aberrant signal re-entry in the presence of Bay K 8644, A/LV-A cardioids were not affected in this manner (Figures 7G and 7H). Instead, Bay K 8644 stimulated both A and LV-A cardioid beating, while ivabradine decreased it in all subtypes (Figure 7I). Interestingly, isoprenaline increased the signal speed propagation in both subcompartments of LV-A cardioids but not in the single cardioids (Figures 7J and 7K). The reverse effect was observed with ivabradine, where the individual A cardioid was affected but not the LV-A cardioid. Thus, the platform allows us to screen for specific drug effects in single cardioids, within interacting subcompartments, and in a whole multi-chamber cardioid.
Together, these results validate that we can discern early developmental effects of mutations, known teratogenic and arrhythmogenic drugs and therapeutic agents in a human multicompartment cardiac platform and relate these to cardiac defects observed in patients. Thus, our work has broad implications for studying the effects on human cardiac biology in contexts ranging from therapeutic development to environmental studies.
¶ DISCUSSION
Recently, several self-organizing human heart models have been reported, including cardiac and cardio-endodermal organoids.54–5 8 Because this earlier work did not delineate relationships with aSHF, pSHF, and FHF lineages, the resulting identities and physiology of the cardiac cell types have remained unclear. As a result, ratios of different CM subtypes, heterogeneity, and the structures they form in vitro are challenging to control and relate to the in vivo heart. To complement the embryo gold standard model, we demonstrated that our platform is versatile, highly efficient, reproducible, compatible with multiple cell lines, and screenable in high throughput using multiple readouts transients, contraction movies, FluoVolt, MEAs, morphology, and gene expression) on single-compartment or multi-chamber cardioids.
Several reports describe atrial and ventricular CMs differentiated from hPSCs, but whether these originate from the FHF, aSHF, or pSHF lineage has not been determined.41,59 In vivo, the dosage and timing of signaling are coordinated to drive lineage specification during mesoderm induction, and as mesodermal cells migrate at different times, taking defined positions within the heart fields. We found that stage-specific levels of Activin/Nodal, WNT, BMP, and RA signaling instruct specification into distinct SHF, AVC, and FHF progenitors consistent with the signaling environment in the anterior region of the embryo and recent in vitro findings.14,15,60 Specifically, Activin/Nodal signaling inhibition is crucial to determining SHF lineage fate choice, which was not highlighted before in vivo or in vitro. We also showed that the role of RA signaling was more complex in terms of dosage and timing than previously thought.41,59 The absence of exogenous RA signaling is essential for initial aSHF specification and later OFT differentiation, low RA levels for LV specification, high RA levels for early atrial, and later RV specification. Thus, only highly specific combinations of mesoderm induction and patterning signals allow for mimicking the identities, (morphogenetic) dynamics, and later functionality of the developing cardiac lineages, enabling the control and dissection of progenitor sorting and chamber interaction mechanisms.
Interactions between cardiac lineages during the earliest stages of heart development, including cardiac mesoderm specification, morphogenesis, and functional differentiation, are notoriously difficult to analyze and inaccessible in human embryos. In addition, studies of human embryo development reveal a growing list of differences between species in expression patterns of critical developmental and functionality genes.38,61,62 Such aspects are key to understanding the human-specific impact of mutations and teratogens on early human heart development and how this causes embryo failure. A significant advance of our work is the deep and comprehensive phenotyping that we used to explore the ontology of contraction signal propagation, differentiation speed, specification direction, efficiency, and morphogenesis through the early stages of cardiogenesis. This is particularly important to understand cases of embryonic cardiac failure that have been attributed to faulty specification and morphogenesis but where defects in early contraction signal propagation between chambers might have been the culprit.
In conclusion, despite decades of experimental and clinical research, the underlying causes of most cardiac defects remain unknown. Potential culprits include still unidentified mutations in regulatory elements such as enhancers; environmental factors such as pollutants; and more complex interactions between genetic and environmental factors, including drugs and diet. Previously, we lacked a system to test all these options in a human context with high throughput, encompassing all cardiac compartments, and the multi-chamber cardioid platform will allow us to close this gap.
¶ Limitations of the study
Despite its usefulness, the cardioid system has several limitations at this stage of development. This work focuses on the comprehensive modeling of early specification, morphogenesis, and signal contraction propagation of the human embryonic heart. However, we have not modeled processes such as aSHF/pSHF progenitor migration and heart looping, nor interaction with the endoderm where other complementary in vitro systems might be more suitable to compare with the embryo.54,57,63 Later stages and processes during heart development have not been represented yet in cardioids, including forming valves, septation, pacemakers, chamber trabeculation and ballooning, coronary vasculature and circulation, and the general growth and maturation24 of the heart. Thus, the multi-chamber platform has been validated mainly using mutations and teratogens affecting the earliest stages while providing, at the same time, a solid basis for further developments.
¶ STAR⭐METHODS
Detailed methods are provided in the online version of this paper and include the following:
¶ KEY RESOURCES TABLE
¶ RESOURCE AVAILABILITY
Lead contact Materials availability Data and code availability
¶ EXPERIMENTAL MODEL AND STUDY PARTICIPANT DETAILS
Human pluripotent stem cell (hPSC) lines
¶ METHOD DETAILS
hPSC culture
B Generation of ISL1, TBX5, and FOXF1 knockout hPSCs
Cardioid generation
B Cardioid Subtype Differentiation
Atria Chamber specification protocol
Ventricular Maturation Protocol
2D Endothelial cell differentiation
OFT cardioids treatment with EMT-promoting factors
Smooth Muscle Cell Differentiation
Mixing of progenitors
Generation of multi-chambered cardioids
Molds for multi-chamber cardioids
Cardioid total cell number and cell size analysis
Cryosectioning
Immunostaining
RNAscope and In Situ Hybridization Chain reaction (HCR)
¶ Image acquisition and analysis
Flow cytometry
RNA extraction and bulk RNA-seq preparation
Real-time quantitative polymerase chain reaction
Sample preparation for scRNA-seq
Contraction Analysis
B Calcium Transients – Cell Line Generation and Imaging
Patch clamp recordings of single cardiomyocytes
Optical action potentials
Multiple Electrode Array (MEA)
¶ QUANTIFICATION AND STATISTICAL ANALYSIS
Degree of sorting quantification
Bulk RNA-seq analysis
Single-cell RNA-seq analysis
scRNA-seq integration with in vivo cardiac embryonic chambers datasets
scRNA-seq integration with an in vivo OFT dataset
Transients Quantification
MEA Data Analysis
Statistics
¶ SUPPLEMENTAL INFORMATION
Supplemental information can be found online at https://doi.org/10.1016/j.cell.
2023.10.030.
¶ ACKNOWLEDGMENTS
We thank all laboratory members for their help and discussions and Katarzyna Warczok for lab management. We are grateful to the VBC Histology & NGS, IMP/Institute for Molecular Biotechnology (IMBA) Core, and IMBA SCC facilities for their services and to the Allen Institute for cell lines. We thank Life Science Editors for scientific editing. This work was funded by the Austrian Academy of Sciences (OEAW) and the Austrian Research Promotion Agency (FFG) (to the Mendjan lab), by the EU Horizon 2020 R&D Innovation Program under grant agreement no. 964518, and the Austrian Science Fund (FWF) under grant agreement no. W1232 (to S. Hering. and M.A.N.), and by the FWF Special Research Program SFB-F78, F 7811-B (to Prof. Dr. Arndt von Haeseler and S. Haendeler).
¶ AUTHOR CONTRIBUTIONS
C.S., A.D., and S.M. co-designed experiments and co-wrote the paper. C.S. developed RV and OFT differentiations, established cell sorting assay, and performed the scRNA-seq experiment. A.D. developed atrial and AVC differentiations and designed and set up contraction, , and MEA analysis. T.I. established multi-chamber cardioid generation. C.S., A.D., T.I., and A.T.C. characterized cardioids and performed teratogenic, mutant, and drug screens. M.A.N. did the patch clamp. S. Haendeler., L.P., and M.N. performed the image/movie-based and scRNA-seq bioinformatic analysis, respectively. N.P., S. Hering., and P.H. helped with training and advice. All other authors performed experiments. S.M. designed and supervised the study.
¶ DECLARATION OF INTERESTS
The IMBA filed a patent application (Nr.21712188.8) on multi-chamber cardioids with C.S., A.D., T.I., and S.M. named as inventors. P.H. and S.M. are co-founders, and S.M. is a SAB member of HeartBeat.bio AG, the IMBA cardioid drug discovery platform spin-off.
¶ INCLUSION AND DIVERSITY
We worked to ensure diversity in experimental samples through the selection of the cell lines. While citing references scientifically relevant to this work, we also actively worked to promote gender balance in our reference list.
Received: July 12, 2022
Revised: July 31, 2023
Accepted: October 30, 2023
Published: November 28, 2023
¶ REFERENCES
- van der Linde, D., Konings, E.E.M., Slager, M.A., Witsenburg, M., Helbing, W.A., Takkenberg, J.J.M., and Roos-Hesselink, J.W. (2011). Birth prevalence of congenital heart disease worldwide: a systematic review and meta-analysis. J. Am. Coll. Cardiol. 58, 2241–2247. https://doi.org/10. 1016/j.jacc.2011.08.025.
- Jin, S.C., Homsy, J., Zaidi, S., Lu, Q., Morton, S., DePalma, S.R., Zeng, X., Qi, H., Chang, W., Sierant, M.C., et al. (2017). Contribution of rare inherited and de novo variants in 2,871 congenital heart disease probands. Nat. Genet. 18, 25. https://doi.org/10.1038/ng.3970.
- Fahed, A.C., Gelb, B.D., Seidman, J.G., and Seidman, C.E. (2013). Genetics of congenital heart disease: the glass half empty. Circ. Res. 112, 707–720. https://doi.org/10.1161/CIRCRESAHA.112.300853.
- Zaidi, S., and Brueckner, M. (2017). Genetics and genomics of congenital heart disease. Circ. Res. 120, 923–940. https://doi.org/10.1161/CIRCRESAHA.116.309140.
- Gonzalez-Teran, B., Pittman, M., Felix, F., Thomas, R., Richmond-Buccola, D., Hu¨ ttenhain, R., Choudhary, K., Moroni, E., Costa, M.W., Huang, Y., et al. (2022). Transcription factor protein interactomes reveal genetic determinants in heart disease. Cell 185, 794–814.e30. https://doi.org/10. 1016/j.cell.2022.01.021.
- Kathiresan, S., and Srivastava, D. (2012). Genetics of human cardiovascular disease. Cell 148, 1242–1257. https://doi.org/10.1016/j.cell.2012. 03.001.
- Srivastava, D. (2021). Modeling human cardiac chambers with organoids. N. Engl. J. Med. 385, 847–849. https://doi.org/10.1056/NEJMcibr2108627.
- Hofbauer, P., Jahnel, S.M., and Mendjan, S. (2021). In vitro models of the human heart. Development 148, dev199672. https://doi.org/10.1242/dev. 199672.
- Kim, H., Kamm, R.D., Vunjak-Novakovic, G., and Wu, J.C. (2022). Progress in multicellular human cardiac organoids for clinical applications. Cell Stem Cell 29, 503–514. https://doi.org/10.1016/j.stem.2022.03.012.
- Kelly, R.G., Buckingham, M.E., and Moorman, A.F. (2014). Heart fields and cardiac morphogenesis. Cold Spring Harb. Perspect. Med. 4, a015750. https://doi.org/10.1101/cshperspect.a015750.
- Meilhac, S.M., and Buckingham, M.E. (2018). The deployment of cell lineages that form the mammalian heart. Nat. Rev. Cardiol. 15, 705–724. https://doi.org/10.1038/s41569-018-0086-9.
- Bruneau, B.G. (2013). Signaling and transcriptional networks in heart development and regeneration. Cold Spring Harb. Perspect. Biol. 5, a008292. https://doi.org/10.1101/cshperspect.a008292.
- Christoffels, V., and Jensen, B. (2020). Cardiac morphogenesis: specification of the four-chambered heart. Cold Spring Harb. Perspect. Biol. 12, a037143. https://doi.org/10.1101/cshperspect.a037143.
- Arkell, R.M., and Tam, P.P.L. (2012). Initiating head development in mouse embryos: integrating signalling and transcriptional activity. Open Biol. 2, 120030. https://doi.org/10.1098/rsob.120030.
- Nandkishore, N., Vyas, B., Javali, A., Ghosh, S., and Sambasivan, R. (2018). Divergent early mesoderm specification underlies distinct head and trunk muscle programmes in vertebrates. Development 145. dev160945-dev160925. https://doi.org/10.1242/dev.160945.
- Hofbauer, P., Jahnel, S.M., Papai, N., Giesshammer, M., Deyett, A., Schmidt, C., Penc, M., Tavernini, K., Grdseloff, N., Meledeth, C., et al. (2021). Cardioids reveal self-organizing principles of human cardiogenesis. Cell 184, 3299–3317.e22. https://doi.org/10.1016/j.cell.2021.04.034.
- Bothe, I., Tenin, G., Oseni, A., and Dietrich, S. (2011). Dynamic control of head mesoderm patterning. Development 138, 2807–2821. https://doi. org/10.1242/dev.062737.
- Ghyselinck, N.B., and Duester, G. (2019). Retinoic acid signaling pathways. Development 146, dev167502. https://doi.org/10.1242/dev.167502.
- Schmidt, C., Deyett, A., Ilmer, T., Caballero, A.T., Haendeler, S., Pimpale, L., Netzer, M.A., Ginistrelli, L.C., Cirigliano, M., Mancheno, E.J., et al. (2022). Multi-chamber cardioids unravel human heart development and cardiac defects. https://doi.org/10.1101/2022.07.14.499699.
- Ivanovitch, K., Soro-Barrio, P., Chakravarty, P., Jones, R.A., Bell, D.M., Gharavy, S.N.M., Stamataki, D., Delile, J., Smith, J.C., and Briscoe, J. (2021). Ventricular, atrial and outflow tract heart progenitors arise from spatially and molecularly distinct regions of the primitive streak3. 497- 489. https://doi.org/10.1101/2020.07.12.198994.
- Cortes, C., Francou, A., De Bono, C., and Kelly, R.G. (2018). Epithelial properties of the second heart field. Circ. Res. 122, 142–154. https://doi. org/10.1161/CIRCRESAHA.117.310838.
- Feyen, D.A.M., McKeithan, W.L., Bruyneel, A.A.N., Spiering, S., Ho¨ rmann, L., Ulmer, B., Zhang, H., Briganti, F., Schweizer, M., Hegyi, B., et al. (2020). Metabolic maturation media improve physiological function of human iPSC-derived cardiomyocytes. Cell Rep. 32, 107925. https://doi.org/10. 1016/j.celrep.2020.107925.
- Garay, B.I., Givens, S., Abreu, P., Liu, M., Yu¨ cel, D., Baik, J., Stanis, N., Rothermel, T.M., Magli, A., Abrahante, J.E., et al. (2022). Dual inhibition of MAPK and PI3K/AKT pathways enhances maturation of human iPSCderived cardiomyocytes. Stem Cell Rep. 17, 2005–2022. https://doi.org/ 10.1016/j.stemcr.2022.07.003.
- Karbassi, E., Fenix, A., Marchiano, S., Muraoka, N., Nakamura, K., Yang, X., and Murry, C.E. (2020). Cardiomyocyte maturation: advances in knowledge and implications for regenerative medicine. Nat. Rev. Cardiol. 36, 1–19. https://doi.org/10.1038/s41569-019-0331-x.
- Majesky, M.W. (2007). Developmental basis of vascular smooth muscle diversity. Arterioscler. Thromb. Vasc. Biol. 27, 1248–1258. https://doi.org/ 10.1161/ATVBAHA.107.141069.
- Asp, M., Giacomello, S., Larsson, L., Wu, C., Fu¨ rth, D., Qian, X., Wa¨ rdell, E., Custodio, J., Reimega˚ rd, J., Salme´ n, F., et al. (2019). A spatiotemporal organ-wide gene expression and cell atlas of the developing human heart. Cell 179, 1647–1660.e19. https://doi.org/10.1016/j.cell.2019.11.025.
- Lawson, K.A., Meneses, J.J., and Pedersen, R.A. (1991). Clonal analysis of epiblast fate during germ layer formation in the mouse embryo. Development 113, 891–911.
- Tam, P.P., Parameswaran, M., Kinder, S.J., and Weinberger, R.P. (1997). The allocation of epiblast cells to the embryonic heart and other mesodermal lineages: the role of ingression and tissue movement during gastrulation. Development 124, 1631–1642. https://doi.org/10.1242/dev.124. 9.1631.
- Sahara, M., Santoro, F., Sohlme´ r, J., Zhou, C., Witman, N., Leung, C.Y., Mononen, M., Bylund, K., Gruber, P., and Chien, K.R. (2019). Population and single-cell analysis of human cardiogenesis reveals unique LGR5 ventricular progenitors in embryonic outflow tract. Dev. Cell 48, 475–490.e7. https://doi.org/10.1016/j.devcel.2019.01.005.
- van Weerd, J.H., and Christoffels, V.M. (2016). The formation and function of the cardiac conduction system. Development 143, 197–210. https://doi. org/10.1242/dev.124883.
- Koopman, C.D., De Angelis, J., Iyer, S.P., Verkerk, A.O., Da Silva, J., Berecki, G., Jeanes, A., Baillie, G.J., Paterson, S., Uribe, V., et al. (2021). The zebrafish grime mutant uncovers an evolutionarily conserved role for Tmem161b in the control of cardiac rhythm. Proc. Natl. Acad. Sci. USA 118, e2018220118. https://doi.org/10.1073/pnas.2018220118.
- Christoffels, V.M., Smits, G.J., Kispert, A., and Moorman, A.F.M. (2010). Development of the pacemaker tissues of the heart. Circ. Res. 106, 240–254. https://doi.org/10.1161/CIRCRESAHA.109.205419.
- Christoffels, V.M., and Moorman, A.F.M. (2009). Development of the cardiac conduction system: why are some regions of the heart more arrhythmogenic than others? Circ. Arrhythm. Electrophysiol. 2, 195–207. https:// doi.org/10.1161/CIRCEP.108.829341.
- Verkerk, A.O., Marchal, G.A., Zegers, J.G., Kawasaki, M., Driessen, A.H.G., Remme, C.A., de Groot, J.R., and Wilders, R. (2021). Patch-clamp recordings of action potentials from human atrial myocytes: optimization through dynamic clamp. Front. Pharmacol. 12, 649414. https://doi.org/ 10.3389/fphar.2021.649414.
- Watanabe, M., Rollins, A.M., Polo-Parada, L., Ma, P., Gu, S., and Jenkins, M.W. (2016). Probing the electrophysiology of the developing heart. J. Cardiovasc. Dev. Dis. 3, 10. https://doi.org/10.3390/jcdd3010010.
- Tyser, R.C.V., and Srinivas, S. (2020). The first heartbeat-origin of cardiac contractile activity. Cold Spring Harb. Perspect. Biol. 12, a037135. https:// doi.org/10.1101/cshperspect.a037135.
- Tyser, R.C., Miranda, A.M., Chen, C.-M., Davidson, S.M., Srinivas, S., and Riley, P.R. (2016). Calcium handling precedes cardiac differentiation to initiate the first heartbeat. eLife 5, 454. https://doi.org/10.7554/eLife.17113.
- Rossant, J., and Tam, P.P.L. (2022). Early human embryonic development: blastocyst formation to gastrulation. Dev. Cell 57, 152–165. https://doi. org/10.1016/j.devcel.2021.12.022.
- Cai, C.-L., Liang, X., Shi, Y., Chu, P.-H., Pfaff, S.L., Chen, J., and Evans, S. (2003). Isl1 identifies a cardiac progenitor population that proliferates prior to differentiation and contributes a majority of cells to the heart. Dev. Cell 5, 877–889.
- Gao, R., Liang, X., Cheedipudi, S., Cordero, J., Jiang, X., Zhang, Q., Caputo, L., Gu¨ nther, S., Kuenne, C., Ren, Y., et al. (2019). Pioneering function of Isl1 in the epigenetic control of cardiomyocyte cell fate. Cell Res. 29, 486–501. https://doi.org/10.1038/s41422-019-0168-1.
- Devalla, H.D., Schwach, V., Ford, J.W., Milnes, J.T., El-Haou, S., Jackson, C., Gkatzis, K., Elliott, D.A., Chuva de Sousa Lopes, S.M., Mummery, C.L., et al. (2015). Atrial-like cardiomyocytes from human pluripotent stem cells are a robust preclinical model for assessing atrial-selective pharmacology. EMBO Mol. Med. 7, 394–410. https://doi.org/10.15252/emmm.201404757.
- Quaranta, R., Fell, J., Ru¨ hle, F., Rao, J., Piccini, I., Arau´ zo-Bravo, M.J., Verkerk, A.O., Stoll, M., and Greber, B. (2018). Revised roles of ISL1 in a hES cell-based model of human heart chamber specification. eLife 7, 12209. https://doi.org/10.7554/eLife.31706.
- Bruneau, B.G., Nemer, G., Schmitt, J.P., Charron, F., Robitaille, L., Caron, S., Conner, D.A., Gessler, M., Nemer, M., Seidman, C.E., et al. (2001). A murine model of Holt-Oram syndrome defines roles of the T-box transcription factor Tbx5 in cardiogenesis and disease. Cell 106, 709–721.
- Xie, L., Burnicka-Turek, O., Friedland-Little, J.M., Zhang, K., and Moskowitz, I.P. (2012). Tbx5-hedgehog molecular networks are essential in the second heart field for atrial septation. Dev. Cell 23, 280–291. https://doi. org/10.1016/j.devcel.2012.06.006.
- Bruneau, B.G., Logan, M., Davis, N., Levi, T., Tabin, C.J., Seidman, J.G., and Seidman, C.E. (1999). Chamber-specific cardiac expression of Tbx5 and heart defects in Holt-Oram syndrome. Dev. Biol. 211, 100–108. https://doi.org/10.1006/dbio.1999.9298.
- Hoffmann, A.D., Yang, X.H., Burnicka-Turek, O., Bosman, J.D., Ren, X., Steimle, J.D., Vokes, S.A., McMahon, A.P., Kalinichenko, V.V., and Moskowitz, I.P. (2014). Foxf genes integrate Tbx5 and hedgehog pathways in the second heart field for cardiac septation. PLOS Genet. 10, e1004604. https://doi.org/10.1371/journal.pgen.1004604.
- Kang, J., Nathan, E., Xu, S.M., Tzahor, E., and Black, B.L. (2009). Isl1 is a direct transcriptional target of Forkhead transcription factors in secondheart-field-derived mesoderm. Dev. Biol. 334, 513–522. https://doi.org/ 10.1016/j.ydbio.2009.06.041.
- Kalisch-Smith, J.I., Ved, N., and Sparrow, D.B. (2020). Environmental risk factors for congenital heart disease. Cold Spring Harb. Perspect. Biol. 12, a037234. https://doi.org/10.1101/cshperspect.a037234.
- Mantziou, V., Baillie-Benson, P., Jaklin, M., Kustermann, S., Arias, A.M., and Moris, N. (2021). In vitro teratogenicity testing using a 3D, embryolike gastruloid system. Reprod. Toxicol. 105, 72–90. https://doi.org/10. 1016/j.reprotox.2021.08.003.
- van Meer, B.J., Krotenberg, A., Sala, L., Davis, R.P., Eschenhagen, T., Denning, C., Tertoolen, L.G.J., and Mummery, C.L. (2019). Simultaneous measurement of excitation-contraction coupling parameters identifies mechanisms underlying contractile responses of hiPSC-derived cardiomyocytes. Nat. Commun. 10, 4325. https://doi.org/10.1038/s41467-019-12354-8.
- Yamanaka, S., Murai, H., Saito, D., Abe, G., Tokunaga, E., Iwasaki, T., Takahashi, H., Takeda, H., Suzuki, T., Shibata, N., et al. (2021). Thalidomide and its metabolite 5-hydroxythalidomide induce teratogenicity via the cereblon neosubstrate PLZF. EMBO J. 40, e105375. https://doi.org/10. 15252/embj.2020105375.
- Khalil, A., Tanos, R., El-Hachem, N., Kurban, M., Bouvagnet, P., Bitar, F., and Nemer, G. (2017). A HAND to TBX5 explains the link between thalidomide and cardiac diseases. Sci. Rep. 7, 1416. https://doi.org/10.1038/ s41598-017-01641-3.
- Bai, N., Cui, X.-Y., Wang, J., Sun, C.-G., Mei, H.-K., Liang, B.-B., Cai, Y., Song, X.-J., Gu, J.-K., and Wang, R. (2013). Determination of thalidomide concentration in human plasma by liquid chromatography-tandem mass spectrometry. Exp. Ther. Med. 5, 626–630. https://doi.org/10.3892/etm.2012.847.
- Drakhlis, L., Biswanath, S., Farr, C.-M., Lupanow, V., Teske, J., Ritzenhoff, K., Franke, A., Manstein, F., Bolesani, E., Kempf, H., et al. (2021). Human heart-forming organoids recapitulate early heart and foregut development. Nat. Biotechnol. 18. 246-210. https://doi.org/10.1038/s41587-021-00815-9.
- Feng, W., Schriever, H., Jiang, S., Bais, A., Wu, H., Kostka, D., and Li, G. (2022). Computational profiling of hiPSC-derived heart organoids reveals chamber defects associated with NKX2-5 deficiency. Commun. Biol. 5,
- https://doi.org/10.1038/s42003-022-03346-4.
- Lewis-Israeli, Y.R., Wasserman, A.H., Gabalski, M.A., Volmert, B.D., Ming, Y., Ball, K.A., Yang, W., Zou, J., Ni, G., Pajares, N., et al. (2021). Selfassembling human heart organoids for the modeling of cardiac development and congenital heart disease. Nat. Commun. 12, 5142. https://doi. org/10.1038/s41467-021-25329-5.
- Silva, A.C., Matthys, O.B., Joy, D.A., Kauss, M.A., Natarajan, V., Lai, M.H., Turaga, D., Alexanian, M., Bruneau, B.G., and McDevitt, T.C. (2020). Developmental co-emergence of cardiac and gut tissues modeled by human iPSC-derived organoids34, pp. 405–423. https://doi.org/10.1101/ 2020.04.30.071472.
- Meier, A.B., Zawada, D., De Angelis, M.T., Martens, L.D., Santamaria, G., Zengerle, S., Nowak-Imialek, M., Kornherr, J., Zhang, F., Tian, Q., et al. (2023). Epicardioid single-cell genomics uncovers principles of human epicardium biology in heart development and disease. Nat. Biotechnol., 1–14. https://doi.org/10.1038/s41587-023-01718-7.
- Lee, J.H., Protze, S.I., Laksman, Z., Backx, P.H., and Keller, G.M. (2017). Human pluripotent stem cell-derived atrial and ventricular cardiomyocytes develop from distinct mesoderm populations. Stem Cells 21, 179–194.e4. https://doi.org/10.1016/j.stem.2017.07.003.
- Yang, D., Gomez-Garcia, J., Funakoshi, S., Tran, T., Fernandes, I., Bader, G.D., Laflamme, M.A., and Keller, G.M. (2022). Modeling human multi-lineage heart field development with pluripotent stem cells. Cell Stem Cell 29, 1382–1401.e8. https://doi.org/10.1016/j.stem.2022.08.007.
- Cui, Y., Zheng, Y., Liu, X., Yan, L., Fan, X., Yong, J., Hu, Y., Dong, J., Li, Q., Wu, X., et al. (2019). Single-cell transcriptome analysis maps the developmental track of the human heart. Cell Rep. 26, 1934–1950.e5. https://doi. org/10.1016/j.celrep.2019.01.079.
- Verheule, S., and Kaese, S. (2013). Connexin diversity in the heart: insights from transgenic mouse models. Front. Pharmacol. 4, 81. https://doi.org/ 10.3389/fphar.2013.00081.
- Rossi, G., Boni, A., Guiet, R., Girgin, M., Kelly, R.G., and Lutolf, M.P. (2019). Embryonic organoids recapitulate early heart organogenesis141. 4231-4226. https://doi.org/10.1101/802181.
- Schindelin, J., Arganda-Carreras, I., Frise, E., Kaynig, V., Longair, M., Pietzsch, T., Preibisch, S., Rueden, C., Saalfeld, S., Schmid, B., et al. (2012). Fiji: an open-source platform for biological-image analysis. Nat. Methods 9, 676–682. https://doi.org/10.1038/nmeth.2019.
- Chen, G., Gulbranson, D.R., Hou, Z., Bolin, J.M., Ruotti, V., Probasco, M.D., Smuga-Otto, K., Howden, S.E., Diol, N.R., Propson, N.E., et al. (2011). Chemically defined conditions for human iPSC derivation and culture. Nat. Methods 8, 424–429. https://doi.org/10.1038/nmeth.1593.
- Patsch, C., Challet-Meylan, L., Thoma, E.C., Urich, E., Heckel, T., O’Sullivan, J.F., Grainger, S.J., Kapp, F.G., Sun, L., Christensen, K., et al. (2015). Generation of vascular endothelial and smooth muscle cells from human pluripotent stem cells. Nat. Cell Biol. 17, 994–1003. https://doi.org/10. 1038/ncb3205.
- Fridericia, L.S. (2003). The duration of systole in an electrocardiogram in normal humans and in patients with heart disease. 1920. Ann. Noninvasive Electrocardiol. 8, 343–351. https://doi.org/10.1046/j.1542-474x.2003. 08413.x.
- de Soysa, T.Y., Ranade, S.S., Okawa, S., Ravichandran, S., Huang, Y., Salunga, H.T., Schricker, A., Del Sol, A., Gifford, C.A., and Srivastava, D. (2019). Single-cell analysis of cardiogenesis reveals basis for organ-level developmental defects. Nature 572, 120–124. https://doi.org/10.1038/ s41586-019-1414-x.
KEY RESOURCES TABLE
| REAGENT or RESOURCE | SOURCE | IDENTIFIER |
| Antibodies | ||
| TNNT2 | Thermo Scientific | Cat# MS-295-P |
| TNNT2 | Abcam | Cat# ab45932; RRID: AB_956386 |
| CDH5 (VE-Cadherin) | CellSignaling Technology | Cat# 2500S |
| PECAM1 (CD31) | Agilent Technologies | Cat# M082329-2 |
| PECAM1 (CD31) | R&D Systems | Cat# AF806; RRID: AB_355617 |
| HAND1 | R&D Systems | Cat# AF3168; RRID: AB_2115853 |
| HAND2 | Abcam | Cat# ab200040; RRID: AB_2923502 |
| NKX2-5 | R&D Systems | Cat# AF2444; RRID: AB_355269 |
| IRX1 | Thermo Scientific | Cat# PA5-60261 |
| TBX2 | Novus Biologicals | Cat# NBP1-89459 |
| TBX3 | R&D Systems | Cat# AF4509; RRID: AB_2240328 |
| E-Cadherin (CDH1) | Cell Signaling Technology Europe | Cat# 3195 |
| N-Cadherin (CDH2) | BD Biosciences | Cat# 610920; RRID: AB_2077527 |
| HEY2 | Proteintech | Cat# 10597-1-AP; RRID: AB_2118415 |
| ISL1 | DSHB | Cat# 39.4D5; RRID: AB_2314683 |
| FOXF1 | R&D Systems | Cat# AF4798-SP; RRID: AB_2105588 |
| FOXC2 NR2F2 (COUP-TFII) | Bio-Techne | Cat# AF5044-SP; RRID: AB_2105268 |
| MKI67 | R&D Systems | Cat# PP-H7147-00; RRID: AB_2155627 |
| TBX5 | BD Biosciences | Cat# 556003; RRID: AB_396287 |
| Sigma-Aldrich | Cat# HPA008786; RRID: AB_10601720 | |
| NPPA MYL2 | Thermo Scientific | Cat# PA5-63543 |
| Anti-α-Actinin antibody | Abcam | Cat# ab79935; RRID: AB_1952220 |
| DAPI | Sigma-Aldrich | Cat# A7811; RRID: AB_476766 |
| Sigma-Aldrich | Cat# D9542 | |
| Hoechst33342 (EdU kit) | Thermo Scientific | Cat# C10640 |
| Fluo-4 AM | Thermo Scientific | Cat# F14217 |
| FluoVolt Donkeyanti-eep lgG,econdarytibody | Thermo Scientific | Cat# F10488 |
| Alexa Fluor 647 Donkeyanti-Mouse IgG,Secondaryntid | Thermo Scientific | Cat# A21448 |
| Alexa Fluor 488 Donkey anti-Mouse IgG, Secondary Antibody, | Thermo Scientific | Cat# A21202 |
| Alexa Fluor 594 Donkeyanti-Mouse IgG,econdaryAtiody | Thermo Scientific | Cat# A21203 |
| Alexa Fluor 647 Donkeyanti-Rabbit gG,econdarytibody | Thermo Scientific | Cat# A31571 |
| Alexa Fluor 488 Donkeyanti-Rabbit gG,Secondarytibody | Thermo Scientific | Cat# A21206 |
| Alexa Fluor 594 Donkey anti-Rabbit IgG,SecondaryAtibody, | Thermo Scientific | Cat# A21207 |
| Alexa Fluor 647 | Thermo Scientific | Cat# A31573 |
| Donkey anti-Goat IgG, Secondary Antibody, Alexa Fluor 488 | Thermo Scientific | Cat# A11055 |
| Donkeyanti-Goat IgG,Secondary Antibody,Alexa Fluor 594 | Thermo Scientific | Cat# A11058 |
Continued
| REAGENT or RESOURCE | SOURCE | IDENTIFIER |
| Donkeyanti-atcdaryy Fluor 647 | Thermo Scientific | Cat# A21447 |
| Chemicals,peptidesandrecombinantpoteis | ||
| RNA-scope probe HOXB1 | Bio-Techne Sales Corp. | N/A |
| RNA-scope probe TBX1 | Bio-Techne Sales Corp. | N/A |
| HCR probe WNT5A | Molecular Instruments | N/A |
| HCR probe IRX4 | Molecular Instruments | N/A |
| HCR amplifer B3 (Alexa-546) | Molecular Instruments | N/A |
| Antibiotic-Antimycotic | Thermo Scientific | #15240062 |
| Y-27632 | Tocris | #1254 |
| Vitronectin XF | Stem Cell Technologies | #7180 |
| Laminin-511 E8 fragment | AMSBIO | #AMS.892 011 |
| Fibronectin | Sigma-Aldrich | #F1141 |
| Zebrafish FGF2 | Cambridge University | N/A |
| hFGF2 | QKine | #Qk053 |
| TGFβ81 | R&D Systems | 240-B-010 |
| LY294002 | Tocris | #1130 |
| Activin A | Cambridge University | Activin A1 |
| BMP4 | R&D Systems | 314-BP-050 |
| CHIR99021 | R&D Systems | RD-4423/50 |
| Insulin | Roche | #11376497001 |
| VEGF165 | Peprotech | AF-100-20 |
| IWP2 | Tocris | #3533 |
| Retinoic Acid | Sigma-Aldrich | #R2625 |
| SB431542 | Tocris | #1614 |
| LDN-193189 | Stemgent | 04-0074 |
| LY-411575 | MedChemExpress | HY-50752 |
| Dexamethasone | Sigma-Aldrich | D4902 |
| Indomethacin | Sigma-Aldrich | 17378 |
| T3 hormone | Sigma-Aldrich | T6397 |
| Chemically Defined Lipid Concentrate | Thermo Scientific | 11905031 |
| PD0325901 | Axon Med Chem | #Axon1408 |
| SB203580 | R&D Systems | #1202 |
| PDGF-BB | R&D Systems | 220-BB-050 |
| L-lactate | Sigma-Aldrich | #71718-10G |
| Glucose | Sigma-Aldrich | #G7021-1KG |
| Vitamin B12 | Sigma-Aldrich | #V6629-250MG |
| Biotin | Sigma-Aldrich | #B4639-100MG |
| Creatine monohydrate | Sigma-Aldrich | #C3630-100G |
| Taurine | Sigma-Aldrich | #T0625-10G |
| L-Carnitine | Sigma-Aldrich | #C0283-5G |
| Non-Essential Amino Acids Solution | Thermo Scientific | #1140050 |
| B-27 Supplement | Thermo Scientific | #17504044 |
| KnockOut Serum Replacement | Thermo Scientific | #10828028 |
| Thalidomide | Sigma-Aldrich | T144 |
| Acitretin | Sigma-Aldrich | A0225000 |
| Aspirin | Tocris | 4092 |
| 4-Aminopyridine | Thermo Scientific | A12405.18 |
Continued
| REAGENT or RESOURCE | SOURCE | IDENTIFIER |
| Perfluoro-n-octane sulfonate (PFOS) | Thermo Scientific | 16359117 |
| Polystyrene latex microsphere, 0.05 micron | Thermo Scientific | 042711.AB |
| SP-DiIC18(3) (Dil) | Invitrogen | D7777 |
| DiIC18(5)-DS (DiD) | Invitrogen | D12730 |
| Donkey Serum | Bio-Rad Laboratories | C06SB |
| Isoprenaine | Tocris | 1747 |
| Ivabradine | Tocris | 6542 |
| Bay K 8644 | Tocris | 1546 |
| 16% Formaldehyde | Thermo Scientific | #28908 |
| Sodium chloride (NaCI) | Sigma-Aldrich | S7653-1KG |
| Potassium chloride (KCI) | Sigma-Aldrich | P9333-500G |
| Calcium chloride dihydrate (CaCl2) | Sigma-Aldrich | C3881-500G |
| Magnesium chloride hexahydrate (MgCl2) | Sigma-Aldrich | M2670-100G |
| Sodium hydroxide solution (NaOH) | Sigma-Aldrich | 72068-100ML |
| EGTA | Sigma-Aldrich | 03777-50G |
| Adenosine 5'-triphosphate magnesium salt (MgATP) | Sigma-Aldrich | A9187-1G |
| Potassium hydroxide solution (KOH) | Sigma-Aldrich | 1.09108.1000 |
| Hank's Balanced Salt Solution (HBSS) | Gibco | #14175-053 |
| TrypLE Express | Gibco | #12605010 |
| DMEM/F12 with HEPES | Gibco | #11330032 |
| Insulin-Transferi-Selenium | Gibco | #41400045 |
| L-Ascorbic Acid 2-phosphate | Sigma-Aldrich | A8960 |
| Sodium Bicarbonate (7.5%) | Gibco | #25080094 |
| F12 (with Glucose) | Gibco | #31765068 |
| IMDM | Gibco | #21980065 |
| DMEM with low glucose | Sigma-Aldrich | G8644 |
| Monothioglycerol (MTG) | Sigma-Aldrich | M6145 |
| Bovine Serum Albumin (BSA) | Europa Bioproducts | EQBAH-0500 |
| PBS | Gibco | #14190094 |
| STEMdif cardiomyocyte dissociation kit | Stem Cell Technologies | #05025 |
| Endothelial Cell Growth Medium MV | PromoCell | #PC-C-22020 |
| DMEM no Glucose | Gibco | #11966025 |
| Albumax | Thermo Scientific | #11020021 |
| HEPES | Sigma-Aldrich | H4034-500G |
| Cas9 2NLS Nuclease | Synthego | N/A |
| Deposited data | ||
| bulk RNA sequencing data | GSE239891 | Gene Expression Omnibus: SuperSeries GSE239891. |
| single cell RNA sequencing data | GSE239890 | Gene Expression Omnibus: SuperSeries GSE239890. |
| Signal Propagation Analysis Pipeline | Original Code | [Zenodo]: [doi.0rg/10.5281/zenodo.8354912] |
| Experimental models: Cel lines | ||
| H9 | WiCell | N/A |
| 178/5 iPSC | IMBA Stem CellCore Faity | in-house |
| CAG-GCaMP6fWTC iPSC | HeartBeat.Bio | in-house |
| TNNT2-GCaMP6f WTC iPSC | HeartBeat.Bio | in-house (Continued on next page) |
Continued
Oligonucleotides
| REAGENT or RESOURCE | SOURCE | IDENTIFIER |
| TNNT2-GFP WTC iPSC | HeartBeat.Bio | in-house |
| Wild-Type WTC iPSC | Coriell Institute for Medical Research | GM25256 |
| MYL7-GFP WTC iPSC | Allen Institute for Cel Science | AICS-0052-003 |
| TNNI1-GFP WTC iPSC | Allen Institute for Cell Science | AICS-0037-172 |
| HIST1H2BJ-GFP WTC iPSC | Allen Institute for Cell Science | AICS-0061-036 |
| LMNB1-WTC iPSC | Allen Institute for Cell Science | AICS-0034-062 |
| ISL1 KO WTC iPSC | This paper | N/A |
| TBX5 KO WTC iPSC | This paper | N/A |
| FOXF1 KO WTC iPSC | This paper | N/A |
| GCaMP6f WTC iPSC | This paper | N/A |
See Table S3 for all oligonucleotide and RNA sequences
| Recombinant DNA | ||
| pAAVS1-PC-GCaMP6f | Bruce Conklin Lab | Addgene plasmid #73503 |
| AAVS1 TALEN L & R | Hofbauer et al.16 | N/A |
| Software and algorithms | ||
| Fiji/imageJ V2.0 | Schindelin et al.64 | https://imagej.net/Fij.html |
| FlowJo V10 | FlowJo, LLC | https://www.flowjo.com/ |
| Adobe Creative Suite | Adobe | https://www.adobe.com/creativecloud.html# |
| pCLAMP software v.10.0 | Molecular Devices | https://www.moleculardevices.com/systems/ conventional-patch-clamp/pclamp-10-software |
| Rstudio | Rstudio | https://rstudio.com |
| Matlab custom code | Mathworks | https://www.mathworks.com/products/ matlab.html |
| Prism 8 | Graphpad Software Inc. | https://www.graphpad.com |
| Python Custom Code | Python | https://www.python.org/ |
| PATCHMASTER NEXT software | HEKA Elektronik GmbH | N/A |
| BrainWave 4 Cellranger v7.1.0 | 3Brain | N/A |
| 10X Genomics | https://support.10xgenomics.com/ single-cell-gene-expression/software/pipelines/ latest/installation | |
| Size and Sorting Analysis | HeartBeat.Bio | N/A |
| Other | ||
| Ultra-Low Cluster, U-bottom 96-wellplates | Corning | #7007 |
| 35mm tissue culture-treated dishes | Corming | #430165 |
| 96 well plate | Greiner Bio-One | #655182 |
| ARTrM Wide Bore Filtered Pipette Tips | Thermo Scientific | #2069G |
| Chromium Next GEM Single CellFixed RNA Sample Preparation Kit | 10x Genomics | PN-1000414 |
| Multiplex-compatible Chromium Next GEM Single Cell Fixed RNA Human Transcriptome Probe kits | 10x Genomics | PN-1000420/1000456 |
| Chromium Next GEM Single CellFixed RNA Gel Bead Kit, | 10x Genomics | PN-1000421 |
| Chromium Next GEM Chip Q Single Cell Kit | 10x Genomics | PN-1000422 |
| Chromium Next GEM Single CellFixed RNA | 10x Genomics | PN-1000415 |
| Hybridization & Library Kit, Polypropylene Fibers | Sterlitech | #10047100 |
| MEA anchors | 3Brain or IMBA workshop | N/A |
| Glass capillaries | Harvard Apparatus | #BS4 64-0792 |
¶ RESOURCE AVAILABILITY
¶ Lead contact
Further information and requests for resources and reagents should be directed to and will be fulfilled by the lead contact, Sasha Mendjan (sasha.mendjan@imba.oeaw.ac.at).
¶ Materials availability
Resources and materials will be provided upon reasonable request. Knock-out cell lines TBX5, FOXF1, and ISL1 are available from the lead contact upon request.
¶ Data and code availability
-
RNA-seq data has been deposited to the NCBI Gene Expression Omnibus and is accessible through the GEO accession number GSE239891 (https://www.ncbi.nlm.nih.gov/geo/query/acc.cgi?acc=GSE239891). All other data can be requested from the lead contact.
-
The original code has been deposited at Zenodo and is publicly available. DOI is listed in the key resources table. - Any additional information required to reanalyze the data reported in this working paper is available from the lead contact upon request.
¶ EXPERIMENTAL MODEL AND STUDY PARTICIPANT DETAILS
¶ Human pluripotent stem cell (hPSC) lines
The WiCell Institute (USA) provided human H9 (female) ES cell lines. The WTC iPS cell line (male, skin fibroblast-derived) was developed at Dr. Bruce R. Conklin’s laboratory (Gladstone Institute of CardiovascularDisease, UCSF, USA) and purchased from the Coriell Institute for Medical Research (USA). The Allen Institute for Cell Science’s reporter cell lines are derived from the WTC11 cell line and received from the Coriell Institute for Medical Research (USA). The human iPS cell line 178/5 (male, fibroblast-derived) was generated by the IMBA Stem Cell Core Facility, complying with Austrian and European legislation. We tested potential sex-specific gene expression differences using RT-QPCR for KCNE1, MYL4, and SCN10A in all our cardioid subtypes using two female (HQLVS and IMBA 177/18) and two male (WTC and IMBA 178/15) hPSC lines. We did not observe any significant expression difference (data not shown).
¶ METHOD DETAILS
¶ hPSC culture
The E8 culture system65 was used to cultivate all human pluripotent stem cell lines in a customized in-house medium. 0.5 percent BSA (Europa Biosciences, #EQBAH70), in-house manufactured human FGF2 (200ng/ml) or thermal stable Qkine FGF2 ( #Qk053) at ), and TGFb1 were added to the original (R&D RD-240-B-010). Cells were cultured on Vitronectin XF (Stem Cell Technologies) coated Eppendorf (Eppendorf SE, #0030 721.110) or TPP (TPP Techno Plastic Products AG, #92012) tissue culture-treated plates and passaged every 2-4 days at approximately 70 percent confluency using Try-pLE Express Enzyme (GIBCO, #12605010). The absence of Mycoplasma contamination in cells was regularly tested.
¶ Generation of ISL1, TBX5, and FOXF1 knock-out hPSCs
ISL1, TBX5, and FOXF1 were knocked out in WTC cells using CRISPR/Cas9 multi-guide sgRNAs (Synthego) for target sites on Exon 3 for ISL1, Exon 5 for TBX5, and Exon 1 for FOXF1 (Figures M1I–K). Cells were transfected using the P3 Primary Cell 4D-Nucleofector X Kit S (Lonza-BioResearch, #: V4XP-3032) and Amaxa 4D-Nucleofector (Lonza-BioResearch). Post nucleofection, cells were incubated in E8 supplemented with Y-27632 (Tocris, #72302) on a 6-well plate previously coated with Vitronectin XF (StemCell Technologies, #7180). After two days, the medium was changed to E8 without Y-27632 every other day.
Once cells were approx. confluent, single-cell seeding was performed, and the rest of the cells were collected for gDNA extraction. Successful editing was first assessed on a pool level using agarose gels and Sanger sequencing. Subsequently, single colonies were picked and genotyped to confirm a knockout. Colonies were collected with the help of a microscope (EVOS) and transferred into a pre-coated 96-well plate (Corning, Cat #CLS3370) with 1 5 0 \mu \up E8/well supplemented with Y-27632 and AntibioticAntimycotic. Genome editing on a pool and clonal level was analyzed using Synthego’s online tool ICE (https://ice.synthego.com/#/). Genotypes of clones used in the analysis resulted in the following deletions: for ISL1 KO: -51/-51, chr5: 51387516-51387566; for TBX5 KO: -129/-129, chr12: 114363640-114363768; for FOXF1 KO: -143/-143, chr16: 86510835-86510977.
¶ Cardioid generation
hPSCs are seeded in a 24-well plate (TPP, #92024) at 30-40k cells per well in Y-27632, Tocris #1254). All differentiation media are based on CDM that consists of bovine serum albumin (Europa Biosciences, #EQBAH70) in IMDM (Gibco, #21980065) plus F12 NUT-MIX (Gibco, #31765068), supplemented with concentrated Lipids (Gibco, #11905031),
monothioglycerol (Sigma, #M6145-100ML) and of transferrin (Roche, #10652202001). 24 hours after seeding in the 24-well plate, the cells are induced with mesoderm induction media. Mesoderm induction media is made up of CDM containing FGF2 , Cambridge University) (alternatively QKine FGF2 (5.5 ng/mL Qk053)), LY294002 , Tocris, #1130), Activin A (specific concentrations for different cardioid subtype, Cambridge University), BMP4 , R&D Systems RD-314-BP-050), and CHIR99021 (specific concentrations for different cardioid subtypes, see below, R&D Systems RD-4423/50). After 36-40 hours, cells are dissociated with TrypleE (Gibco, #12605010) and seeded in a Corning ultra-low attachment 96 well plate (Corning, #7007) at 15- cells/ well in Cardiac Mesoderm Patterning Media One made up of CDM containing ROCKi and for all protocols besides the LV cardioids of insulin (Roche, #11376497001) plus specific factors depending on cardioid subtype (see below). After seeding, the cells are spun down in a centrifuge for 4 mins at . This protocol is termed 2D-3D standard protocol, used in all Figures unless otherwise specified. Alternatively, hPSCs were seeded into Corning ultra-low attachment 96 well plate with a density of 5000 cells/well. Cells were seeded in a volume of containing and collected by centrifugation for 5 minutes at (Figures 1B, 1C, S1A, and S1B). As another option, 2500 cells/well were seeded directly into induction media (Figure S1F) and collected by centrifugation for 5 minutes at . For both protocols, cells were induced with mesoderm induction media as described for the 2D- protocol. These were termed 3D protocols.
For both protocols, 2D-3D and 3D, at day 2.5, the cells are fed with Cardiac Mesoderm Patterning Media One. For the next two days, the medium is changed to Cardiac Mesoderm Patterning Media Two, made up of CDM containing specific factors depending on the cardioid subtype (see below) and exchanged daily. For the subsequent two days, media is exchanged every day with Cardiomyocyte Differentiation Media CDM medium containing BMP4 , FGF2 , and insulin . This medium was termed Cardiomyocyte Specification Media. 16 For the subsequent days of culture, media is exchanged every other day with CDM containing insulin . Alternatively, the whole protocol can be done in 2D completely by seeding 80,000 – 170.000 cells/24-well coated with vitronectin and adding the medium on the same timeline as the cardioids (Figures 1B and S1F). This was termed 2D differentiation.
¶ Cardioid Subtype Differentiation
¶ Mesoderm Induction Media for all cells lines unless otherwise specified. (day 0 – 1.5)
LV (FHF-derived). Activin and CHIR99021 at (for H9’s . RV (aSHF-derived) atria -derived), and Activin and CHIR99021 at (for H9’s . AVC differentiation. Activin and CHIR99021 at (H9’s not optimized for AVC).
Cardiac Mesoderm Patterning Media 1 (day 1.5 – 3.5)
LV (FHF-derived). BMP4 , FGF2 , Cambridge University) (alternatively, QKine FGF2 (1.466ng/mL, Qk053)), insulin
, C59 , Tocris, #5148/10) and retinoic acid (50 nM, Sigma Aldrich, #R2625). RV (aSHF-derived). The TGF-beta inhibitor SB 431542 ( , Tocris, #1614/10) and either C59 (Figures 5, 6, and 7) or XAV
939 , SelleckChem, # S1180) (Figures 1, 2, 3, and 4). OFT. SB 431542 and XAV-939 . Atria (pSHF-derived). SB 431542 , XAV-939 and retinoic acid (500 nM). AVC. SB 431542 , XAV-939 , retinoic acid (500nM) and BMP4 ).
Cardiac Mesoderm Patterning Media 2 (day 3.5 – 5.5)
LV (FHF-derived). BMP4 , FGF2 , Cambridge University) (alternatively, QKine FGF2 (1.466ng/mL, Qk053)), insulin
( 1 0 \mu \ g / \ m \up] , C59 and retinoic acid ) (Hofbauer et al.16). RV (aSHF-derived). either C59 (Figures 5, 6, and 7) or XAV-939 (Figures 1, 2, 3, and 4) , BMP4 ( ), FGF2 (8 ng/ml,
Cambridge University) (alternatively, QKine FGF2 (1.466ng/mL, Qk053)), insulin , and retinoic acid (500nM). OFT. XAV-939 , BMP4 ), FGF2 , Cambridge University) (alternatively, QKine FGF2 (1.466ng/mL, Qk053)) and
insulin ( 1 0 \mu \ g / \ m \up] . Atria -derived) and AVC. XAV-939 , BMP4 ( , FGF2 , Cambridge University) (alternatively, QKine FGF2
(1.466ng/mL, Qk053)), insulin ), and retinoic acid (500nM).
¶ Atria Chamber specification protocol
For the atria specification protocol, atrial cardioids at day 7 were fed CDM medium containing Retinoic acid (500nM, Sigma Aldrich, #R2625), FGF2 (15ng/mL, Cambridge University), LDN-193189 (200nM, Stemgent, #04-0074) and LY-411575 , MedChemExpess, #HY-50752) until day 10. From day 10 until day 21, atrial cardioids were transferred in DMEM with low glucose (1g/L, Sigma Aldrich, #G8644) containing Dexamethasone (250nM, Sigma Aldrich, #D4902), Indomethacin , Sigma Aldrich, #I7378), T3 hormone (4nM, Sigma Aldrich, #T6397) and chemically defined lipid concentrate (1X, Invitrogen, #11905031). This protocol was used in Figures 3G, , 3J–3N, S3I, and S3O; at D7.5, atrial cardioids were indefinitely kept in CDM with insulin ml) (CDMI).
¶ Ventricular Maturation Protocol
For the ventricular specification protocol, LV and RV cardioids on day 7 were transferred to CDM medium containing Insulin , Sigma/Roche, #11376497001), PD0325901 ( , Axon Med Chem, #Axon1408) and SB203580 , R&D Systems, #1202) for
5 days with one media change after 2 days.23 After this the cardioids were cultured in DMEM no Glucose (Gibco, #11966025) supplemented with L-lactate (10mM, Sigma, #71718-10G), Glucose (5mM, Sigma-Aldrich, #G7021-1KG), Vitamin B12 , SigmaAldrich, #V6629-250MG), Biotin , Sigma-Aldrich, #B4639-100MG), Creatine monohydrate (5mM, Sigma-Aldrich, #C3630- 100G), Taurine (2mM, Sigma-Aldrich, #T0625-10G), L-Carnitine (2mM, Sigma-Aldrich, #C0283-5G), L-Ascorbic acid 2-phosphate (0.5mM, Sigma-Aldrich, #A8960-5G), Non-Essential Amino Acids Solution (1x, Thermofisher, #11140050), Albumax , Thermofisher, #11020021), B-27 Supplement (1x, Thermofisher, #17504044) and KnockOut Serum Replacement (1x, Thermofisher, #10828028) until day 30 of differentiation with a media change every other day.22 This protocol was used in Figures 2I and S2I– S2N otherwise at D7.5 LV/RV cardioids were indefinitely kept in CDMI.
¶ 2D Endothelial cell differentiation
hPSCs were seeded at 100,000 cells/24-well coated with vitronectin in E8 medium with 5 mM ROCK-i added. The following day, cells were induced with FLyAB and 1-3 mM CHIR99021 for H9 cells and incubated for 36 – 40 hours. For the next two days, the medium was exchanged to their respective Cardiac Mesoderm patterning media 1 for the FHF, aSHF, and pSHF. After that, CDM with 200 ng/ml VEGF , Peprotech, #AF-100-20) and 2 mM Forskolin (Sigma-Aldrich, #F3917) was given for 2 days, and then the cells were cultured for 1 day in CDM with VEGF.
¶ OFT cardioids treatment with EMT-promoting factors
The endothelial to mesenchymal transition (EMT) initation protocol followed the specific media composition of OFT. To induce EMT, VEGF165 (200ng/mL, Peprotech, AF-100-20) was added to cardiac mesoderm patterning media 2 from day 3.5 to 5.5. From day 5.5 to day 7.5, the specific media was supplemented with VEGF165 , TGFb , R&D Systems, 240-B-010), Qkine FGF2 (1.466 ng/mL, Qk053) BMP4 (100ng/mL, R&D Systems 314-BP-050), and Insulin , Sigma/Roche, #11376497001). From day 7.5 to day 9.5, cardioids were cultured in CDM supplemented with VEGF165 , TGFb , R&D Systems, 240-B-010), and BMP4 ( , R&D Systems 314-BP-050). As a control, cardiomyocyte specification media was followed for each protocol.
¶ Smooth Muscle Cell Differentiation
H9 line cells were seeded at 100,000 cells/24 well coated with vitronectin in E8 medium supplemented with ROCK-inhibitor. FHF or OFT 2D protocol was followed up until day 3.5. At day 3.5, the medium was changed to CDM supplemented with Insulin , Ascorbic Acid , TGF-b , and PDGF . On the next day (day 5.5), cells were dissociated with TrypLE and reseeded at 50.000 -70.000 cells/24 well plate coated with Bovine Fibronectin , Sigma, # F1141) in CDM supplemented with ROCK-inhibitor and PDGF . Media was changed on the next day with CDM supplemented with PDGF , and cells were fixed with PFA on D8.5. As a control, cells were differentiated based on the smooth muscle cell protocol from Patsch et al.66
¶ Mixing of progenitors
Cardiac differentiation of different progenitor cell populations (FHF, aSHF, and pSHF) was done in 24 well plates coated with vitronectin until day 3.5 (2D differentiation). Cell populations were labeled using different colored cell lines (WTC: H2B-GFP, WTC: LMNB1-RFP). On day d3.5, progenitor cells were dissociated by adding 200 ul Try-pLE Express Enzyme (GIBCO, #12605010) for at room temperature. Dissociation was stopped by adding of CDM containing ROCKi ). After centrifugation for 4 min at , cells were resuspended in CDM containing ROCKi (5 mM). Then, two progenitor populations were mixed by seeding 15000 - 20000 cells per progenitor population into ultra-low attachment (corning) into Co-development Patterning Media, containing C59 , BMP4 , FGF2 , insulin , and retinoic acid (500nM), and ROCKi (5 mM). On day 5.5, media was exchanged to Cardiomyocyte Specification Media for the following two days.
¶ Generation of multi-chambered cardioids
For the fusion of two chambers, developing cardioids were transferred on day 3.5 using wide opening tips from individual wells of the 96-well Corning ultra-low attachment plate to sharing wells with one other desired cardioid subtype. This can be accomplished with any combination of LV, RV, or atrial cardioids. For this type of fusion, cardioids were put together in the Co-development Patterning Media (Figures 6E–6K and S6E–S6H; Videos S2 and S3). Alternatively, LV progenitors on day 1.5 in 2D could also be combined with RV or atrial progenitors on 2D of day 3.5 in -development Patterning Media to get a multi-chambered cardioid with at least one shared cavity (Figures 6L–6N and S6I). The two-chamber/multi-chamber cardioids co-develop if fused at these early stages. Later fusion (e.g., from day 5.5 on) will impair the formation of a shared cavity (Figure S6F).
For the fusion of three cardioids, molds were created with a shape to place the early cardioids that are to be fused in contact with each other in the order of the natural heart (e.g., a linear order). On day 3.5 of cardiac differentiation, the cardioids were transferred to the molds in a 10cm dish filled with Co-development Patterning Media using wide opening tips. Using molds, the cardioids could be arranged in the desired orientation (e.g., first atrial, then LV and RV cardioids, as in vivo). Media was not changed while cardioids were fusing in the molds from day 3.5-5.5. On day 5.5, the fused cardioids were moved back to the 96-well plate, and media change continued as described above. To track which cardioids in the fusions arise from which cell population, colored cell lines (WTC:
H2B-GFP, WTC: LMNB1-RFP) or dyes were used. For this, cells were stained for one hour before induction using SP-DiIC18(3) (Invitrogen, #D7777) to fluoresce at 564nm or DiIC18(5) (Invitrogen, #D12730) to fluoresce at 668nm.
¶ Molds for multi-chamber cardioids
Embedding molds have been designed in Tinkercad and were adjusted in diameter and length based on the cardioid size on the day of fusion. Files were exported as.stl files and loaded into the slicer software XYZ print 1.4.0. The negative was printed using transparent PLA with infill density and layer height, and nozzle temperature. After printing, the negative was treated with a Heatgun (Bosch Hot Air Blower 1800W) at to carefully melt the surface of the negative, create a smooth finish and remove the 3D printing typical rough surface (Figures M1A–1H). The positive was then cast using polydimethylsiloxane (PDMS). In brief, of curing agent and of Monomer (both Sylgard \textcircled{1} 184 Elastomer Kit, VWR) were mixed intensively. The mixture was then spun down to remove air bubbles and directly used. To reduce the extent of bubbles formed during curing, the molds were cast at a low temperature . For this, the negative was placed into a 10cm dish and slowly covered with of the liquid PDMS mixture. The negative was then carefully removed from the polymerized PDMS, and the residual PDMS was cut off using a scalpel. The mold was then stuck to the bottom of a clean 10cm dish using about 5ml of PDMS and cured at . To sterilize the mold, it was washed in Ethanol for about 30min in the fume hood with UV turned on. For positioning cardioids in the mold, the mold was rinsed once with PBS and then coated with an anti-adherence rinsing solution (StemCell Technologies, # 07010) to increase the non-stick behavior of the PDMS further. After coating, the molds were rinsed once with PBS and were then ready to use.
¶ Cardioid total cell number and cell size analysis
Cell counting was performed on live and fixed cells. For fixed samples, cardioids were dissociated using the STEMdiff Cardiomyocyte Dissociation Kit (Stem Cell Technologies #05025). In detail, for each well of a 96-well plate, 150ul of media was replaced with the same volume of STEMdiff Cardiomyocyte Dissociation Medium and incubated at for 10 minutes. After that, samples were dissociated into smaller clumps using wide-bore pipet tips (Thermofisher #2069G) and further incubated at for 15 minutes. After that, clumps were further pipetted gently until a single-cell suspension was achieved. For each cardioid, the whole volume of suspension was subsequently distributed evenly into two-three wells of a separate 96-well plate, which was pre-filled with 1 0 0 \mu \up of PFA in PBS supplemented with 10ug/ml Hoechst33342. Cells were distributed evenly by gentle pipetting and allowed to settle for a minimum of 2 hours before imaging.
For live samples, after removing as much media as possible, 1 5 0 \mu \up of STEMdiff Cardiomyocyte Dissociation Medium were added and incubated at for 10 minutes. Cardioids were dissociated into smaller clumps by pipetting 10-20 times using widebore tips and further incubated for 2-5 minutes at . After that, clumps were gently dissociated into single cells with regular tips and dispersed evenly into 3 wells of 96-well plate filled with pre-warmed 2 0 0 \mu \up STEMdiff Cardiomyocyte Support Medium supplemented with and Hoechst. Cells were allowed to settle for a minimum of 30 minutes and no longer than 1.5 hours before imaging.
Plates were imaged with a Celigo Cytometer microscope (Nexcelom Biosciences, LLC) using the Direct Cell Counting application. For counting total cell numbers, fluorescent illumination was used. The well mask was adjusted to cover the full well. Analysis settings (intensity threshold, diameter, cell area, cell intensity range) were adjusted in a way that all nuclei were recognized as individual objects. For cell size analysis, brightfield illumination was used. Analysis settings were likewise adjusted in a way that cell outlines were recognized precisely and as separate objects. Only a single tile in the center of the well was imaged to ensure a uniform focus. Wells that were not in the proper focus to determine cell outlines were excluded. Data were exported and analyzed using Python. The volume of each cell was calculated from the measured area, assuming a spherical shape. The average cell size from each cardioid was calculated from the subset of cells imaged in the middle of the well in 3 different wells. Data was then exported, and GraphPad Prism was used for statistical analysis.
¶ Cryosectioning
Cardioids were fixed with PFA in PBS and cryoprotected with sucrose in PBS before embedding. The embedding was carried out using the O.C.T. cryo embedding medium (Scigen, #4586K1). Embedded tissues were frozen using a metal surface submerged in liquid nitrogen and stored in a freezer until sectioning on a Leica cryostat. Sections were collected on -SuperFrost Plus slides (Thermo Fisher Scientific, #10149870) and kept at or until immunostaining.
¶ Immunostaining
To remove O.C.T., fixed specimens were washed in 1X PBS for 15 min. Optionally, tissues were placed in a permeabilization solution of Triton-X100 (Sigma-Aldrich, #T8787) for 5 mins to increase antibody permeabilization. Tissues were then incubated in blocking solution (PBS (GIBCO, #14190094) with donkey serum (Bio-Rad Laboratories, #C06SB) and TritonX-100 for at least 30 min. Subsequently, specimens were incubated for 3 hours at room temperature or overnight at in a blocking solution containing the primary antibody. Then, a 20-minute washing in PBS with Tween20 (Sigma-Aldrich, #P1379) was performed, followed by incubation for 1 hour at room temperature in a blocking solution containing the secondary antibody. Finally, tissues were washed in PBS with Tween20. Slides were mounted using a fluorescence mounting medium (Dako Agilent Pathology Solutions, #S3023) and covered with a cover slip (Menzel-Gla¨ ser, #631-0853 VWR).
¶ RNAscope and In Situ Hybridization Chain reaction (HCR)
RNA-scope was performed with the ACDBio (https://acdbio.com) Manual assay kit using RNAscope Probe-hs-TBX1-–2 (Target region: 100 - 769) and RNAscope Probe-hs-HOXB1-–2 (Target region: 528 - 2015) according to the manufacturer’s instructions. RNAscope Probe-hs-PPIB-C1 was used as a positive control. The probes were designed and manufactured by ACDBio. HCR fluorescent in situ was carried out using the HCR kit (v.3), purchased from Molecular Instruments (molecularinstruments.org), according to the manufacturer’s instructions with the slight modification of adding salmon sperm DNA to the pre-amplification solution and the amplification solution including the hairpins to reduce nonspecific binding. The HCR probe WNT5A (B3) was designed and manufactured by Molecular Instruments.
¶ Image acquisition and analysis
Spinning disk confocal microscopes (Olympus spinning disk system based on an IX3 Series (IX83) inverted microscope, equipped with a Yokogawa W1 spinning disc) were used to image fixed tissue sections. Images taken with the confocal microscope that contain more than one color are composites. Live imaging was carried out using an inverted widefield microscope for brightfield and fluorescence (Axioobserver Z1 equipped with an sCMOS camera (Hamamatsu Orca Flash 4). Cardioids in 96-well plates were also imaged using a Celigo Imaging Cytometer microscope (Nexcelom Biosciences, LLC). All images were analyzed with custom-made scripts created for the Fiji software.64 Size analysis of the cardioids was performed by HeartBeat Bio. Images obtained with Celigo that contain red or green color are composites.
¶ Flow cytometry
Cardioids (8 cardioids per condition) were dissociated using a CM dissociation medium (Stem Cell Technologies, #05025) for 7 - 10 min at . Dissociation of CMs was stopped by adding of the support medium. After centrifugation for 4 min at , cells were resuspended in 6 0 0 \mu \up PBS with EDTA (Biological Industries, #01-862-1B) and FBS (PAA Laboratories, #A15- 108). Cells were acquired with a FACS LSR Fortessa II (BD) and analyzed with FlowJo V10 (FlowJo, LLC) software. FACS sorting was performed using a Sony SH800 Cell Sorter (Sony Biotechnology).
¶ RNA extraction and bulk RNA-seq preparation
RNA was isolated using an in-house RNA bead isolation kit semi-automated using KingFisher devices (KingFisher Duo Prime). Using the QuantSeq 30 mRNA-Seq Library Prep Kit FWD (Lexogen GmbH, #015), the bulk RNA-seq libraries ) were generated according to the manufacturer’s instructions. After the preparation of the libraries, samples were checked for an adequate size distribution with a fragment analyzer (Advanced Analytical Technologies, Inc). Then the RNA-seq library was submitted to the Vienna Biocenter Core Facilities (VBCF) Next-Generation-Sequencing (NGS) facility for sequencing.
¶ Real-time quantitative polymerase chain reaction
The isolated RNA was reverse transcribed to cDNA using the Reverse Transcription Kit (Invitrogen, #18080044) with a C100 Touch Bio-Rad Thermal Cycler. Quantitative PCR was performed using the GoTaq qPCR master mix 2x (Promega, #A6001) with a Bio-Rad CFX384 Real-Time thermal cycler. Values of gene expression of each sample were obtained in triplicates. The Log-fold change of the sample from PBGD as a housekeeping gene and a pluripotent stem cell sample for normalization was calculated using a custommade script written in Python. Primer pairs are specified in Table S1. The most significant fold change for each gene in the heatmaps is specified in Table S2.
¶ Sample preparation for scRNA-seq
For scRNA-seq, cardioids (two biological replicates (except atria only one biological replicate) 16-36 cardioids per condition and biological replicate were pooled together. For all protocols, except atria, we used cardioids from two biological replicates from two different lines (WTC:TNNI1 and WTC:TNNT2). Atrial cardioids were differentiated using the WTC:TNNI1 line. LV cardioids were collected at day 7.5, whereas for all other protocols, cardioids were collected at day 9.5. RV, OFT and AVC cardioids were cultured in CDMI medium from d7.5 until day 9.5. Atrial cardioids were kept in the atrial chamber specification medium from day 7.5 until day 9.5. Cardioids were dissociated using a 2 mL CM dissociation medium (Stem Cell Technologies, #05025) for 7 - 10 min at . Dissociation of CMs was stopped by adding of the support medium. The cell suspension was spun down at for 4min at . The supernatant was aspirated, and the cell pellet was resuspended in ice-cold PBS/BSA . The cells were submitted to the VBCF NGS facility for fixation (PFA) and library preparation using the Genomics Chromium platform (Single Cell Gene Expression Flex) (10x Genomics, CA, USA). Four samples were grouped together, and for hybridization, 36.000 - 146.000 cells per sample were used. The four pooled samples were sequenced as one multiplex in one lane.
¶ Contraction Analysis
Cardioids were fed fresh CDMI media 1-2 hours before recordings. The 96-well plate was placed in an environmentally controlled stage incubator (37◦C, CO2, water-saturated air atmosphere, Okolab Inc, Burlingame, CA, USA). Each well was imaged using widefield phase-contrast microscopy (Axioobserver Z1 (inverted) with sCMOS camera, Zeis) at 100 frames per second for 30-60 seconds. Videos were then analyzed using MUSCLEMOTION; the data was read into custom-made software for reported calculations.
Percent beating was defined by whether the cardioid beat once within the entirety of the recording. Beats per minute were calculated by counting the total number of beats in the video, dividing them by the length of the video in seconds, and multiplying by 60. The extent of contraction is the amplitude given from MUSCLEMOTION divided by the size of the cardioid.
¶ Calcium Transients – Cell Line Generation and Imaging
To generate a WTC line expressing the GCaMP6f sensor, an AAVS1-integrating construct with a CAG or a TNNT2 promoter followed by the GCaMP6f sequence was chosen and introduced as previously described.16 Cardioids were differentiated as either single (LV, RV, Atrial, and AVC) or multi-chamber cardioids using the protocol above. Fresh CDMI was replaced 1-2 hours before recordings. The 96-well plate was placed in an environmentally controlled stage incubator , CO2, water-saturated air atmosphere, Okolab Inc, Burlingame, CA, USA). Each well was imaged using widefield microscopy (Axioobserver Z1 (inverted) with sCMOS camera, Zeiss) at 50-100 (optimally 50) frames per second for 30-60 seconds. Cardioids were excited at using a light-emitting diode (LED).
¶ Drug Testing
For drug testing, the media of cardioids was changed to CDM without BSA and incubated for one hour to be scanned prior to drug addition. Then the media was exchanged to 1 0 0 ~ \mu \up of media without BSA that contains drugs (final concentrations: ivabradine, Tociris, or Bay K 8644, Tocris, #1546 or Isoprenaline Tocris #1747) or DMSO (final concentration of ) control. After drug addition and incubation for one hour, the plates were re-scanned as described above.
¶ Patch clamp recordings of single cardiomyocytes
Cardioids were dissociated using the STEMdiff Cardiomyocyte Dissociation Kit (Stem Cell Technologies #05025) according to the manufacturer’s protocol and subsequently seeded at low density in Laminin-511 E8 Fragment (AMSBIO #AMS.892 011, 0 . 5 ~ \mu \up9 ^ { \prime } ) coated tissue culture-treated dishes (Corning #430165). Cells were maintained in CDMI at in a humidified incubator with , and whole-cell patch clamp experiments were performed on single beating cardiomyocytes 5 – 13 days post-plating at in a stage mounted Heated Chamber Stage (ALA Scientific Instruments) employing a PTC-20 Temperature Controller (npi electronic GmbH). Glass micropipettes with resistances of 1.5 – 4 MU were pulled from glass capillaries (Harvard Apparatus #BS4 64- 0792) using a Sutter P-1000 Micropipette Puller (Sutter Instrument). The extracellular solution consisted of the following (in mM): 148 NaCl (Sigma-Aldrich S7653-1KG), 5.4 KCl(Sigma-Aldrich P9333-500G), (Sigma-Aldrich C3881-500G), 1 (SigmaAldrich M2670-100G ),15 Glucose (Sigma-Aldrich G8270-1KG), 15 HEPES (Sigma-Aldrich H4034-500G), with pH adjusted to 7.4 using NaOH (Sigma-Aldrich 72068-100ML). The intracellular pipette solution contained the following (in mM): 150 KCl, 5 NaCl, , 5 EGTA (Sigma-Aldrich 03777-50G), 10 HEPES, 5 MgATP (Sigma-Aldrich A9187-1G), with pH adjusted to 7.2 using KOH (SigmaAldrich 1.09108.1000). Data was sampled at and Bessel filtered at using a HEKA EPC 10 USB Quadro (HEKA Elektronik GmbH) employing PATCHMASTER NEXT software (HEKA Elektronik GmbH). Spontaneous electrical activity was recorded in current clamp mode and analyzed using MATLAB (MathWorks). Action potential amplitudes were measured from peak to maximum diastolic potential, and APD values were calculated from action potential peak to the respective percentage of the APs repolarization in relation to the amplitude. Parameters were individually calculated for 15 – 20 consecutive action potentials per cell and then averaged. Fridericia correction was used to account for beat rate-dependent differences in APD.67
¶ Optical action potentials
Cardioids were dissociated the same way for patch-clamp experiments, see the previous section, and seeded at 40k cells per well into 96 well-plate (Greiner Bio-One, #655182) wells previously coated with Laminin-511 E8 Fragment (AMSBIO, #AMS.892 011, . Cells were kept at in a humidified incubator with for 7 to 11 days, and the medium was exchanged every two to three days. CM monolayers were loaded with 0.7 times the manufacturer’s suggested amount of the voltage-sensitive dye Fluovolt (FluoVolt- Membrane Potential Kit (Thermo Fisher Scientific, #F10488)) after three repeated wash steps with Hank’s Balanced Salt Solution (HBSS, Gibco, #14175-053). Loading was performed at room temperature for 30 minutes, after which the cells were washed with HBSS three more times. The 96-well plate was then placed in an environmentally controlled stage incubator , water-saturated air atmosphere, Okolab Inc, Burlingame, CA, USA), and fluorescence signals were recorded at an excitation wavelength of nm using a light-emitting diode (LED), and emitted light was collected by a photomultiplier (PMT, Cairn Research Ltd. Kent, UK). Fluorescence signals were digitized at . 20 s recordings were subsequently analyzed offline using custommade MATLAB (MathWorks) software. APDs were measured at , , and repolarization. APD values were calculated from the action potential peak to the respective percentage of the amplitude’s repolarization. Parameters were individually calculated for all recorded action potentials per well and then averaged. The number of analyzed action potentials per well typically ranged between 5 and 20.
¶ Multiple Electrode Array (MEA)
MEA was used to perform the electrophysiological recordings of the extracellular field potential. BioCAM DupleX (3Brain), along with a single-well Accura MEA chip (3Brain) were employed. The MEA chip consists of 4096 gold-coated electrodes, with a pitch of 60 um, covering an area of . The MEA chip reservoir was rinsed with ethanol to sterilize, followed by 4 washes with Milli-Q water. Then, PBS was added, and chips were left overnight with PBS to enhance connectivity. Next, PBS was removed without complete drying, and cardioids on d9.6 (for single cardioids) and between d12-15 (for multi-chamber cardioids) of differentiation were carefully placed at the center of the MEA chip using 200ul wide-bore pipette tips (Thermofisher #2069G). To secure their position and maximize the contact area between the cardioids and the chip, a 10um, polypropylene fiber membrane (Sterlitech #10047100) cut down to the size of the electrode area, was placed on top of the organoid, followed by a homemade anchor. Finally, of CDMI was added to the reservoir, and the MEA chips were kept overnight at incubator at to further improve connectivity. Recordings were conducted using BrainWave 4 software, using cardiac organoid settings. Recordings were performed at , and the entire chip was covered with a black lid to prevent light exposure. Field potential signals from beating cardioids were acquired through a high-pass filter, and a 1.1 electrode was used as a reference electrode. The stability of the waveforms was confirmed for a period of 5 to 10 minutes to ensure consistency before a 5-minute recording.
¶ Drug testing with 4AP
To establish the baseline, each cardioid was recorded for 5 minutes before the addition of DMSO or 4AP, hereafter referred to as the pre-drug recording. DMSO was added to the cardioids after 1.5 minutes of a 5-minute recording. Then, the DMSO was washed out, old media was aspirated and replaced by of 1x PBS 3 times. Following wash-out, fresh CDMI was added to the chamber. Then, a second pre-drug recording was required to show the previous baseline was established. 4AP (Thermo Fisher Scientific #A12405.18) was added to the media of cardioids at 1.5 minutes of a 5-minute recording.
¶ QUANTIFICATION AND STATISTICAL ANALYSIS
¶ Degree of sorting quantification
To quantify the degree of sorting in cardioids with mixed progenitors (labelled by using either WTC: H2B-GFP or WTC: LMNB1-RFP line), we analyzed the cross-section of the cardioids. To ensure comprehensive coverage of all cells in the organoids, we superimposed the GFP and RFP signals using maximum intensity projection. From the maximum intensity projections, we approximated the cell center and thus the position of each cell in the organoid. Next, we calculated the total number of cells in a circle with a radius of 100 pixels centered on each cell. This circle served as the region of interest (ROI) for cell counting. We quantified the number of GFPpositive and RFP-positive cells within this ROI for each cell. The average ratio of GFP-positive to RFP-positive cells for all cells indicates the mixing pattern of the cell populations within the cardioid(s). A ratio of 1 indicated a perfectly mixed population, while deviations from 1 suggested varying degrees of segregation or spatial organization. The Degree of sorting was calculated by subtracting 1 from the ratios, so no sorting is represented by 0, and anything above 0 indicates sorting. Analysis performed by HeartBeat Bio.
¶ Bulk RNA-seq analysis
Reads were preprocessed using umi2index (Lexogen) to add the UMI sequence to the read identifier, and trimmed using BBDuk ${ \tt V } 3 8 . 0 6 $ (ref polyA.fa.gz,truseq.fa.gz useshortkmers t mink qtrim trimq min length ). Reads mapping to abundant sequences included in the iGenomes NCBI GRCh38 references were removed using bowtie2 alignment. The remaining reads were analyzed using genome and gene annotation for the GRCh38 assembly obtained from Homo sapiens Ensembl release 94. Reads were aligned to the genome using star , and reads in genes were counted with featureCounts (subread v1.6.2) using strand-specific read counting (-s 1). Differential gene expression analysis on raw counts and principal component analysis on variance stabilized, transformed count data were performed using DESeq2 v1.18.1. Data sets are provided on Gene Expression Omnibus: SuperSeries GSE239891.
¶ Single-cell RNA-seq analysis
ScRNA-seq reads were processed with cellranger v7.1.0 (10X Genomics), using the prebuild 10X GRCh38-2020-A reference and human transcriptome probe-set v1.0.1 (Chromium_Human_Transcriptome_Probe_Set_v1.0.1_GRCh38-2020-A.csv). Further processing of the scRNAseq data was performed in R software v4.2.2 with Seurat v4.3.0. We sequenced the transcriptomes of 13218 LV WTC:TNNI1 cells, 9901 LV WTC:TNNT2 cells, 9221 RV WTC:TNNI1 cells, 10920 RV WTC:TNNT2 cells, 8687 Atrial WTC:TNNI1 cells, 11986 OFT WTC:TNNI1 cells, 13004 OFT WTC:TNNT2 cells, 7979 AVC WTC:TNNI1 cells, 11550 AVC WTC:TNNT2 cells. Cells were retained if their mitochondrial content was below and the gene number metric was above an adaptive, sample-specific thresholds median absolute deviation for log-transformed number of expressed genes). Quality filtering led to the removal of of the sequenced cells and we analyzed 12150 LV WTC:TNNI1 cells, 9422 LV WTC:TNNT2 cells, 8163 RV WTC:TNNI1 cells, 9916 RV WTC:TNNT2 cells, 8012 Atrial WTC:TNNI1 cells, 11007 OFT WTC:TNNI1 cells, 12187 OFT WTC:TNNT2 cells, 7613 AVC WTC:TNNI1 cells, 10936 AVC WTC:TNNT2 cells. Genes detected in 10 or more cells were retained, with mitochondrial and ribosomal protein genes being disregarded. fast mutual nearest neighbors (MNN) was used to integrate cells across celllines (WTC:TNNI1 and WTC:TNNT2). Data were log-normalization using computeSumFactors, followed by per-batch scaling normalization using multiBatchNorm. Datasets were aligned using the fastMNN implementation of SeuratWrappers with the log-normalized batch-adjusted expression values and 2000 integration features (batchelor v1.14.1, SeuratWrappers v0.3.1). MNN low-dimensional coordinates were then used for clustering and visualization by UMAP (20 dims). For the module score, a list of selected genes for each cardiac subtype was generated based on de Soysa et al., 2019,68 Asp et al.,26 Cui et al.,61 and Sahara et al.29 (Table S2). Expression of all genes per module is visualized by UMAP. Data sets are provided on Gene Expression Omnibus: SuperSeries GSE239891.
¶ scRNA-seq integration with in vivo cardiac embryonic chambers datasets
The scRNA-seq integration with Asp et al.26 was done as follows: Filtered scRNA-seq count matrix and meta table for PMID: 31835037 were obtained from https://data.mendeley.com/datasets/mbvhhf8m62/2, cells were subsetted to only relevant cell types (Atrial, Ventricle, Fibroblast-like, Endothelial cells). Our preprocessed scRNA-seq data shown in Figure 3J (89406 cells) were subsetted to endothelial cells and CM cell type (removing progenitors, endoderm, and other cells not expressing TNNI1) (88247/89406 cells). In both datasets, only genes expressed in both experiments were retained for further analysis. The number of cells from our dataset was randomly downsampled to 3000. fastMNN was used to integrate cells across experiments and cell-lines as described above, using 1000 integration features and 10 MNN low-dimensional coordinates as input for UMAP visualization and clustering.
¶ scRNA-seq integration with an in vivo OFT dataset
The scRNA-seq integration with Sahara et al.29 was done as follows: Per-cell raw reads for PRJNA510181 were processed to obtain Homo sapiens Ensembl release 94 per-gene read-count-data using the analysis pipeline detailed above (trimming with trim-galore v0.5.0, contaminant filtering with bowtie2 v2.3.4.1, alignment with star v2.6.0c, summarization with featureCounts subread v1.6.2). Following pseudobulk similarity analysis, we excluded cells belonging to the following outlier condition: 5.0wk_V (mainly progenitors), 6.5wk_A (only 2 cells), 8.0wk_OFT (too mature for comparison to our in-vitro derived OFT), 8.5wk_OFT (too mature for comparison to our in-vitro derived OFT), 7.5wk_A (stressed). Furthermore, we excluded from our scRNA-seq cells belonging to the clusters EC, AVC, and Endoderm and removed CM progenitors with TNNI1 . Only genes detected in both experiments were retained, and for PRJNA510181, only higher quality cells with more than 8000 detected shared genes were included in the subsequent analysis. fastMNN was used to integrate cells across experiments as described above, using 1000 integration features and 10 MNN lowdimensional coordinates as input for Uniform Manifold Approximation and Projection (UMAP).
¶ Ca2+ Transients Quantification
Videos were then analyzed using custom-made software. The brightfield image is used to identify which pixels belong to the cardioid. The pixel intensity distribution is calculated, which displays a bimodality if a cardioid is present. To identify a bimodality, we look for a valley in the distribution, formalized by calculating and ; and then finding the intensity which minimizes f - gfi. Each pixel with intensities below Iis identified as cardioid.
ð ÞThe calcium signal is averaged over each pixel of the cardioid . The baseline is first estimated by setting the coefficients of the discrete wavelet transformation corresponding to high frequencies to zero, and peaks are first called by subtracting the baseline and finding regions above 1:5 times the standard deviation.
Baseline estimates and called peaks are then refined by a Bayesian approach.b
Variances and corresponding precision (inverse of variance) are estimated from the signal minus baseline for all time points that are not called peaks. The change of baseline is estimated as the first finite difference .
The previous change in baseline is incorporated by a weighted sum = wd dt +pwdt - 1dt - 1d d with wd the precision of the first finite difference without peaks, and , which corresponds to the maximum a posteriori probability (MAP) estimate where -each datapoint is faded out with p.
Accordingly, the previous baseline is incorporated by = wb dt +pwbt - 1bt - 1wb+wb with wb the prevision of signal without peaks, wbt = If the signal deviates significantly from the estimated baseline a peak is call-end, datapoints are not incorporated j - - j ð - Þand precision decays with a factor of 0:99 instead of with and
- -For each peak, the speed of signal propagation is calculated and the beat origin is identified. For each pixel of the cardioid the variance in signal over time is calculated and a variance threshold is calculated the same way as for the pixel intensity distribution from the brightfield images. Only pixels with variance above the threshold are considered. The intensity was calculated per pixel and normalized to maximum 1. The frame at which a pixel reached of peak intensity was recorded. The first frame in which more than 30 pixels reach max intensity is defined as the first frame. The last frame in which all besides at most 30 pixels reach max intensity is defined as the last frame. The average position of the biggest connected component of pixels which reached of peak intensity first, is considered the origin of signal propagation. The speed of signal propagation is then calculated for all of the other pixels by dividing the distance between the pixel and the origin and the frame difference between the frame where the pixel reaches of peak intensity and the origin frame. The speeds are all averaged together for every pixel and across all beats to determine the speed of signal propagation in the cardioid. Images of signal propagation are made using the same technique, and each pixel is color-coded based on frame difference. Cardioids were excluded from this analysis for five reason: (1) the cardioid does not beat, (2) a reentry phenotype was present, (3) brightfield images are of low quality, (4) fluorophore bleed over is present or fluorophore images are otherwise of low quality, (5) the algorithm does not correctly identify all peaks. A list of which cardioids are excluded is listed in Table S3.
¶ MEA Data Analysis
Peak finding and initial parameters were determined by BrainWave 4 using the Cardiac Field Potential Detection module with the following settings filter:wavelet level 6, hard threshold: -200, Pre-Peak Wave Duration: , post-peak wave duration: , Q detection start: , T Detection start: 75 ms, Refractory period: . Noisy electrodes were discarded. From this analysis platform, the R-amplitude, S-amplitude, T-amplitude (R,S,T-amplitude data can be found in Figure M1), cardiac field potential rate (cFPR), RT-interval and ST-interval were extracted. Since the program will define a random point for the T-wave if one is not detected, the data was then further filtered to exclude any electrode where the T-wave amplitude is less than 60 or where the T-amplitude standard deviation was more than 150. Electrodes, where the RT-interval was outside 3 standard deviations of the overall mean of all RT-intervals, were excluded. Additionally, any electrode that recorded a cardiac field potential rate of less than 9 FP/ min was excluded. The cRT and cST were then calculated using the Fridericia correction formula: cRT RTseconds/((cFPRseconds)^- 1)^0.33). For the drug testing, the mean of each characteristic for each segment of the organoid was calculated. This was then normalized by log fold change to the mean of the cardioid segment pre-drug recording (delta cRT-interval). Data was exported and analyzed using Prism software.
¶ Statistics
Information on the statistics used in the experiments can be found in the Figure Legends, such as N (biological replicates, performed with different cell batches of different passages), n (technical replicates, performed with the same cell batch of the same passage) numbers, statistical test used, and variation measure used. We ran normality tests and outlier tests on all datasets before running the one-way ANOVA assuming normality. Other statistical details are described in the respective Quantification Methods sections.
¶ Supplemental figures
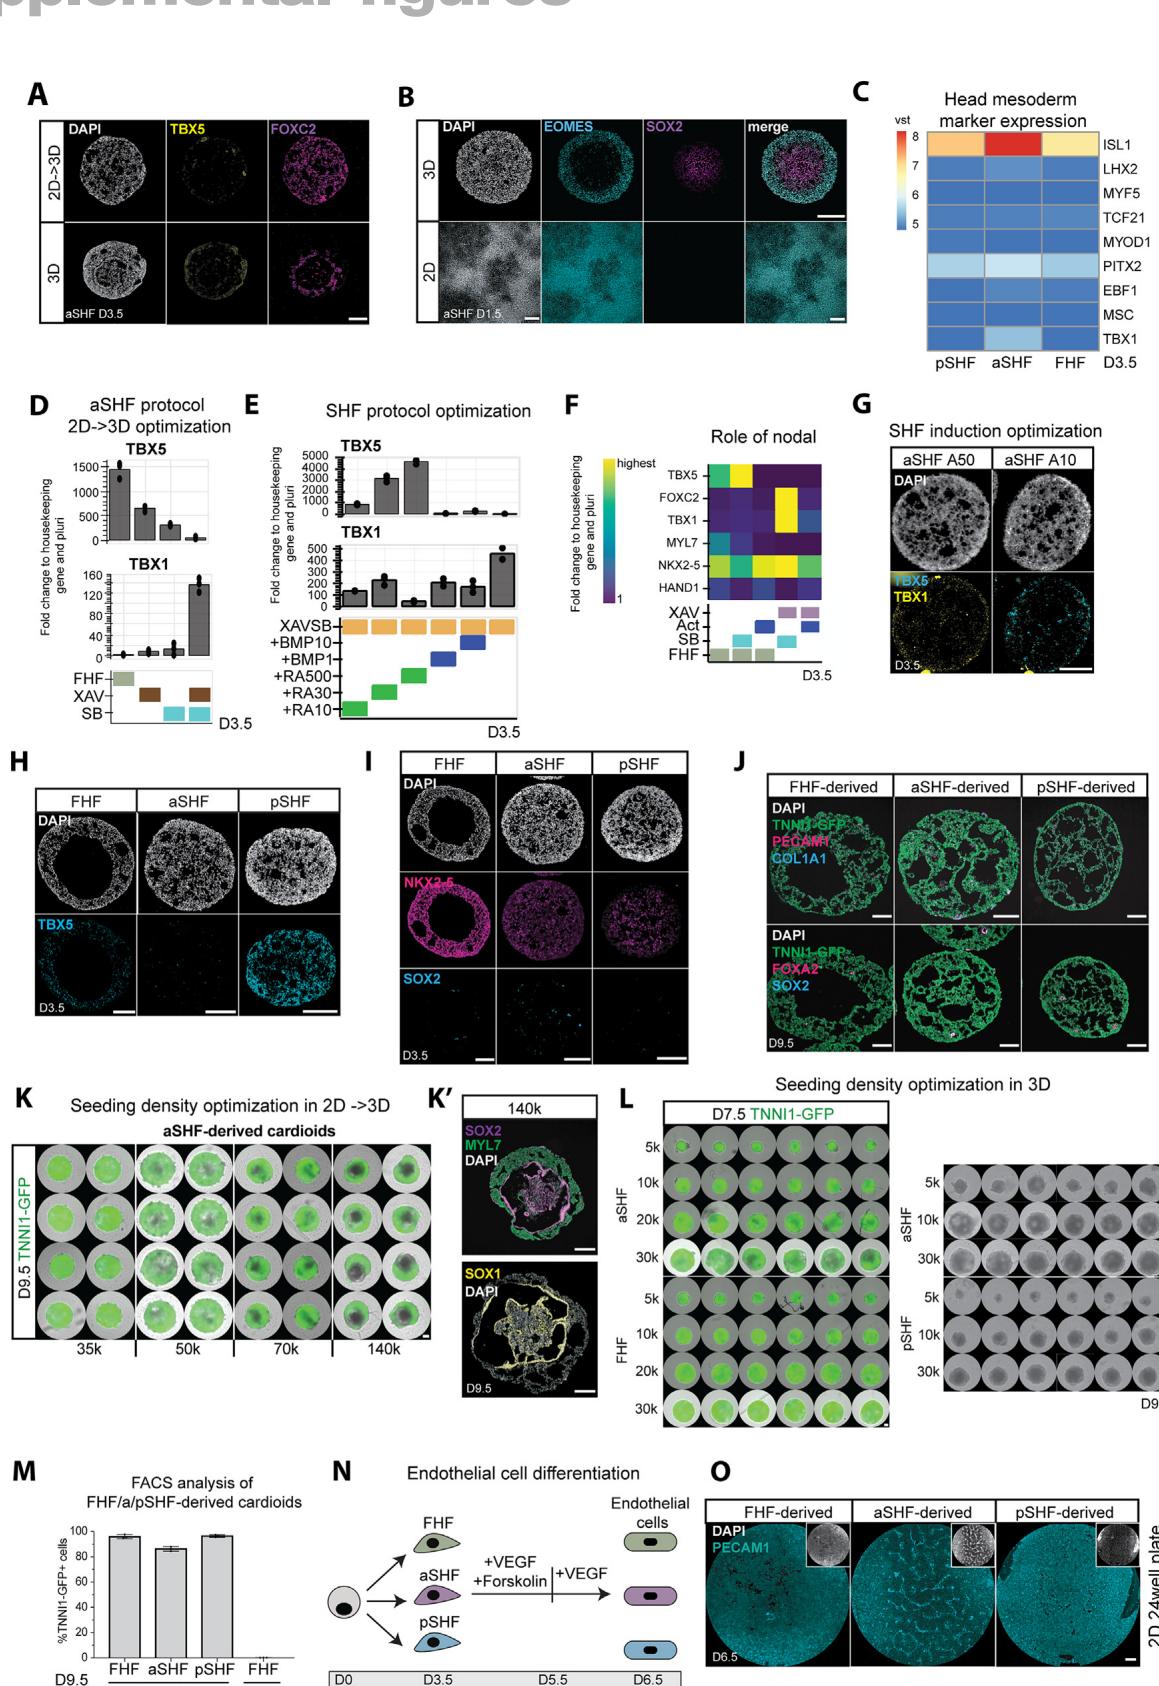
Figure S1. Optimization of the aSHF/pSHF protocol and characterization of aSHF/pSHF-derived cardioids, related to Figure 1
(A) Immunostaining of TBX5 and FOXC2 of aSHF cells at day 3.5 using 3D vs. 2D/3D protocol.
(B) SOX2 and EOMES staining after SHF mesoderm induction (day 1.5) in 2D and 3D protocol.
© Heatmap of bulk RNA-seq analysis at day 3.5 of head mesoderm makers.
(D) Optimization of aSHF-patterning media 1 (day 1.5–day 3.5) conditions in protocol. RT-qPCR of TBX1 and TBX5 levels at day 3.5.
(E) Optimization of aSHF/pSHF protocol by testing different BMP (in ) and RA concentrations (in nM) during patterning stage 1 using RT-qPCR all conditions contain XAV-939 and SB431542.
(F) RT-qPCR showing the effect of SB 431542 ( and Activin ) on aSHF and FHF protocols during cardiac mesoderm patterning media 1 until day 3.5.
(G) RNA-scope staining of TBX1 and TBX5 at day 3.5 of cross-sections of aSHF progenitors induced with different Activin concentrations.
(H) TBX5 staining of cross-sections of all three progenitors at day 3.5.
(I) Immunostaining of NKX2-5 and SOX2 on cross-sections of FHF, aSHF, and pSHF cardioids at day 3.5.
(J) Immunostaining of PECAM1 (endothelial cells), FOXA2 (endoderm), COL1A1 (fibroblast), and SOX2 (neuroectoderm) in all cardioid subtypes. (K) Optimization of seeding density in 2D 24-well plates for protocol in aSHF-derived cardioids at day 9.5 derived from TNNI1-GFP reporter line cardioids. (K0 ) aSHF cardioids started with a high seeding density analyzed with immunostaining of core (neural marker) at day 9.5.
(L) Optimization of seeding density in 96-well plates for 3D formation. Left: aSHF- and FHF-derived cardioids from TNNI1-GFP reporter line at day 7.5; right: aSHFand pSHF-derived cardioids at day 9.5 in WTC: WT line.
(M) Quantification of TNNI1- cells in FHF-, aSHF-, and pSHF-derived cardioids at day 9.5 via flow cytometry , ).
(N) Schematic representation of endothelial differentiation protocol from all three progenitor populations.
(O) Immunostaining for PECAM1-1 in 2D 24-well plate endothelial cell differentiation of all three progenitor populations. RT-qPCR: fold change normalized to a housekeeping gene (PBGD) and pluripotency. vst, variance-stabilized transformed counts. All scale bars in this figure have a length of . All RT-qPCRs show fold change normalized to a housekeeping gene (PBGD) and pluripotency, the highest value for each gene in heatmap found in Table S1. Used cell lines in this figure: WTC and H9. All bar graphs show mean .
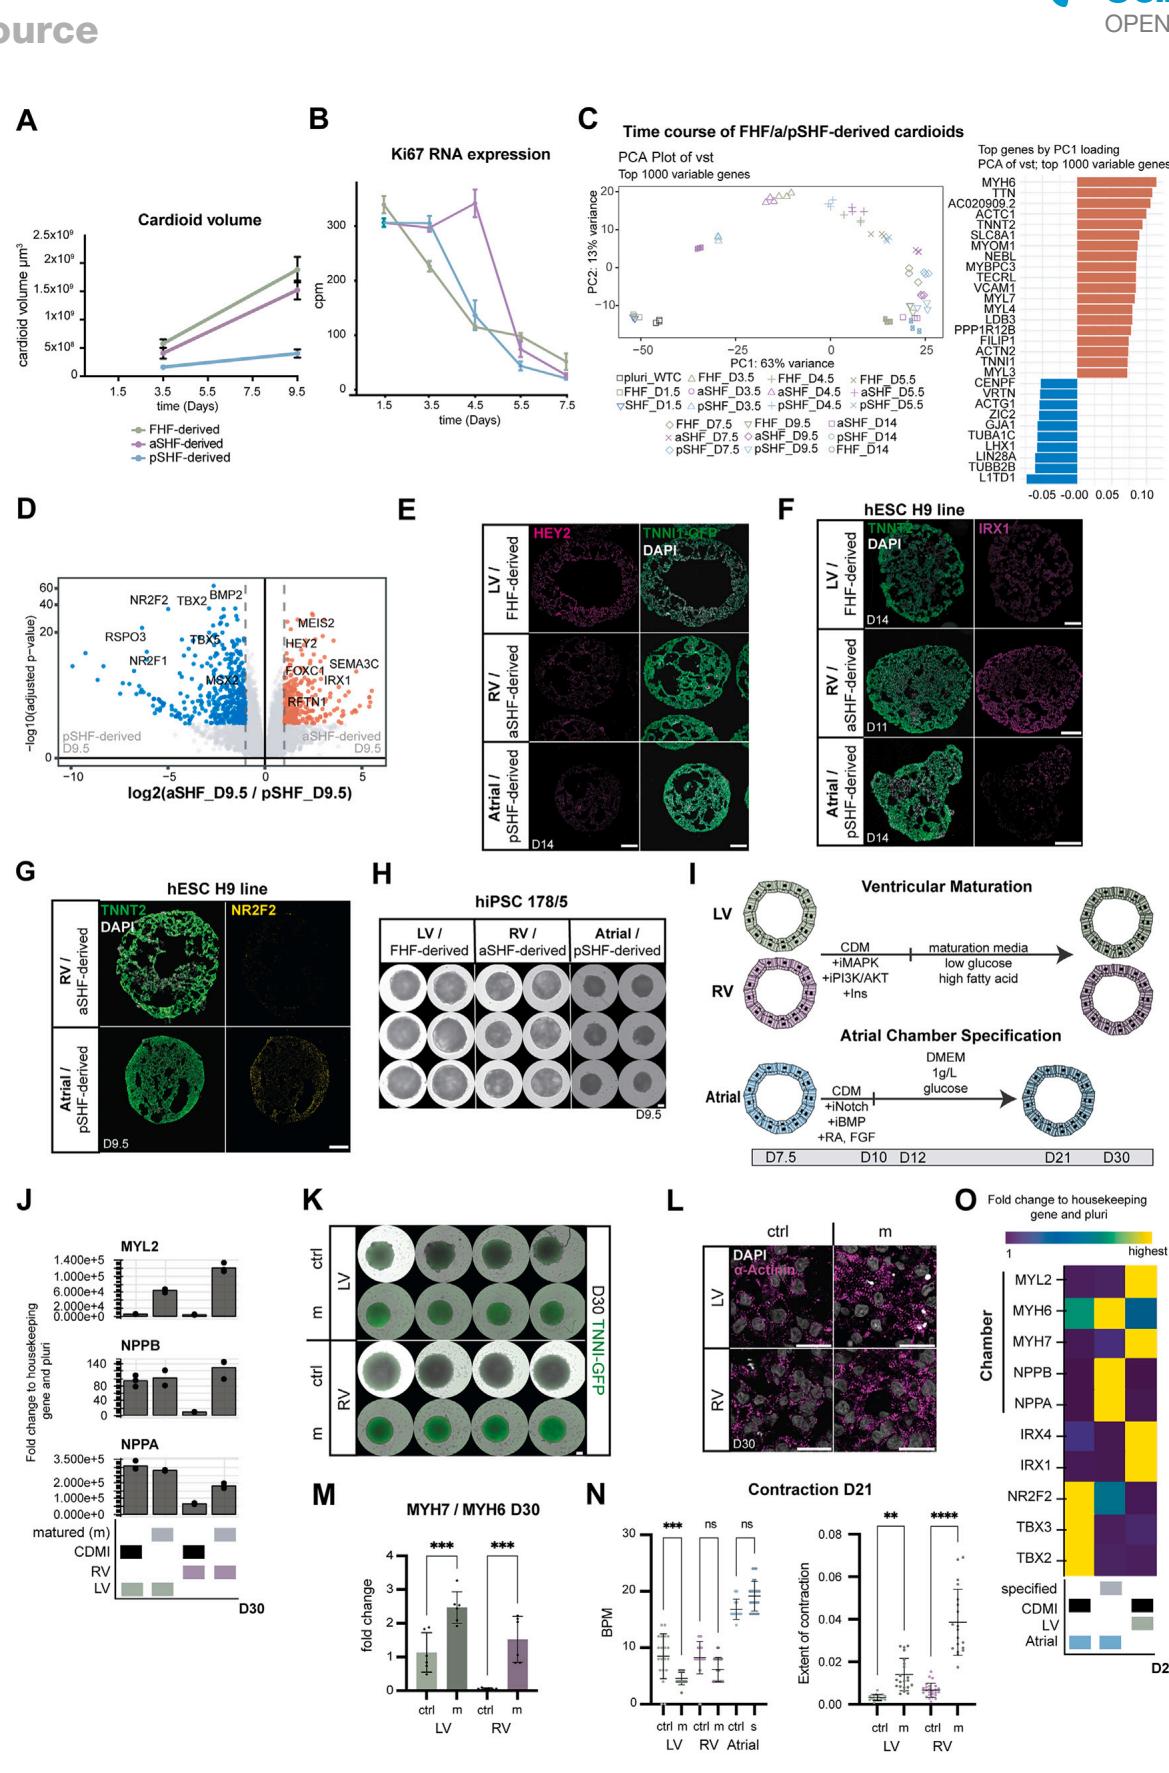
Figure S2. Characterization of FHF-, aSHF-, and pSHF-derived cardioids, related to Figure 2
(A) Cardioid volume measured over time to match data is Figure 2D representative biological replicate from 3 with 8 technical replicates per per time point.
(B) mRNA expression by bulk RNA-seq quantification of proliferation marker Ki67 over time . Each dot represents the mean SD. cpm, counts per million.
© Principal-component analysis (PCA) plot of vst using the top 1,000 variable genes.
(D) Volcano plot showing the differentially expressed genes at day 9.5 of aSHF- vs. pSHF-derived cardioids.
(E) Lineage-specific staining of HEY2 (LV marker) in cross-sections of FHF-, aSHF-, and pSHF-derived cardioids.
(F) Immunostaining for TNNT2 and IRX1 on LV, RV, and atrial cardioids in H9 cell line.
(G) Immunostaining for TNNT2 and NR2F2 on LV, RV, and atrial cardioids in H9 cell line.
(H) Whole-mount phase contrast imaging of LV, RV, and atrial cardioids at day 9.5 in hiPSC 178/5 cell line.
(I) Schematic of chamber specification programs.
(J) Representative RT-qPCR showing the effect of ventricular chamber specification protocol to control (CDMI).
(K) Whole-mount phase contrast and fluorescent imaging of LV and RV cardioids at day 30 in WTC:TNNI-tagged line. m, matured, crtl, control (CDMI) (L) Immunostaining for -Actinin matured and control cardioids. Scale bars, .
(M) Ratio of MYH7/MYH6 RNA-expression by RT-qPCR in LV and RV matured vs. control cardioids of 6 pooled cardioids each).
(N) Contraction analysis on m: matured or s: specified LV, RV, and atrial cardioids, left BPM, beats per minute, and left extent of contraction , ). (O) Representative RT-qPCR showing the effect of atrial chamber specification protocol to control (CDMI). All scale bars in this figure have a length of , except where specified. All RT-qPCRs show fold change normalized to a housekeeping gene (PBGD) and pluripotency (pluri), the highest value for each gene in heatmaps found in Table S1. Used cell lines in this figure: WTC and H9.
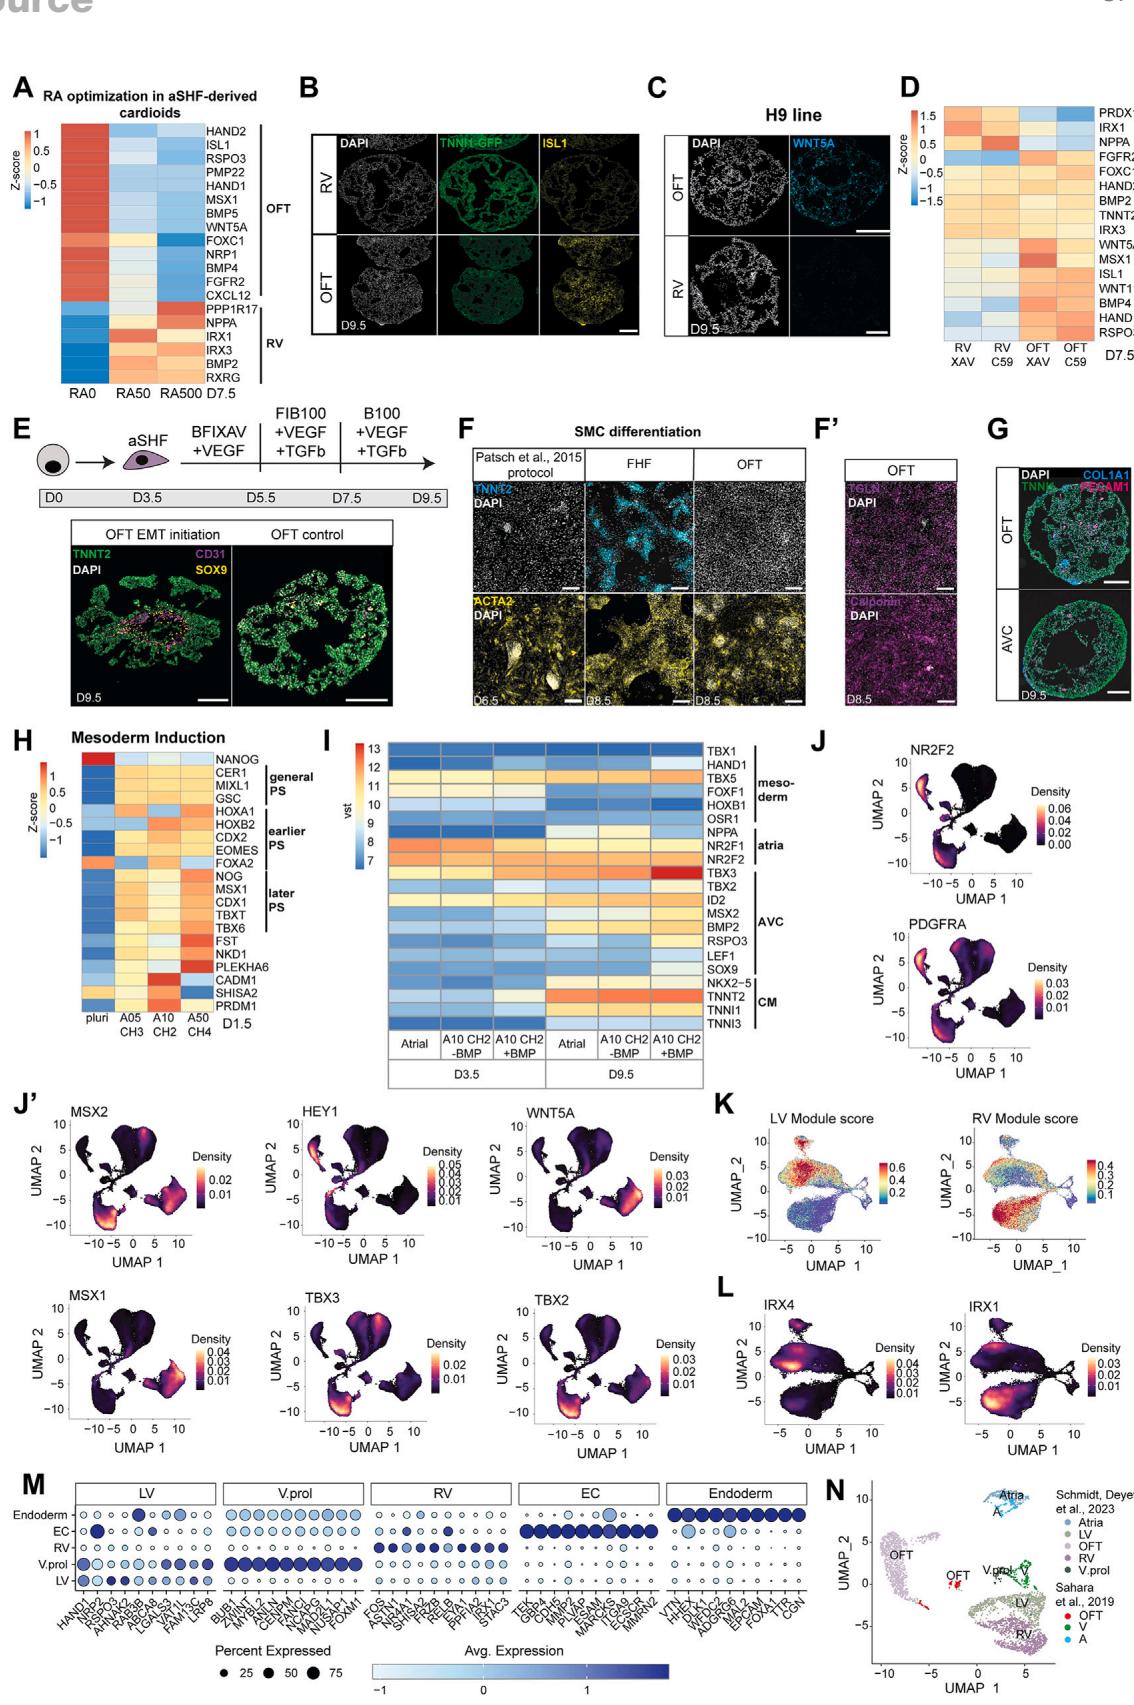
Figure S3. Optimization of OFT and AVC protocol and OFT and AVC cardioid characterization, related to Figure 3
(A) Optimization of RA concentrations during patterning stage 2 using bulk RNA-seq for OFT and RV markers.
(B) Fluorescent cryosection images of RV and OFT cardioids for OFT markers ISL1 at day 9.5.
© WNT5A staining of OFT and RV cardioid cross-sections at day 9.5 in H9 cell line.
(D) Optimizations of type of iWNT used for RV and OFT markers by bulk RNA-seq.
(E) Schematic representation of differentiation protocol for EMT initiation.
(F) Immunostaining for cTnT and alpha-SMA in Patsch control and LV and OFT cardioids at days 6.5 and 8.5, respectively.
(F0) SM22 and calponin staining in OFT cardioids at day 8.5.
(G) COL1A1 (fibroblast marker) and CD31 (endothelial cell marker) staining of OFT and AVC cardioid cross-sections at day 9.5.
(H) Optimization of pSHF mesoderm induction conditions by bulk RNA-seq using different Activin and CHIR99021 concentration.
(I) Heatmap of bulk RNA-seq for BMP optimization for atrial and AVC genes at days 3.5 and 9.5.
(J) (J) UMAP showing expression of NR2F2 and PFGRA (J0) and MSX2, HEY1, WNT5A, MSX1, TBX3, TBX2 markers.
(K) Expression of LV and RV gene modules in ventricular CM sub-clusters.
(L) UMAP showing expression of IRX4 and IRX1 in ventricular CM subclusters.
(M) Dotplot showing the most expressed genes in ventricular (LV; V.prol; RV), EC, and endoderm clusters.
(N) Integration with transcriptomic dataset from Sahara et al.29 showing overlap of cell-type clusters. Samples were randomly downscaled to 1,000 cells. vst,
variance-stabilized transformed counts. All scale bars in this figure have a length of 200 mm. scRNA-seq N = 1–2, n = 16–72 genes lists for modules are in Table S2.
(E) UMAP of the two biological replicates (N1 and N2) showing which cardioid subtype gave rise to each cluster.
(F) Expression of CDH5 and TNNI1 genes.
(G) Expression of cell-cycle S-phase module score.
(H and I) Integration with the transcriptomic dataset from Asp et al.26 showing (H) overlap of cells and (I) overlap of cell-type clusters. 1,000 integration features and
10 MNN low-dimensional coordinates were used as input.
(J) UMAP of ventricular CM subcluster of the two biological replicates.
(K) Dotplot showing expression of CM, EC, and endoderm marker genes. All scale bars in this figure have a length of 200 mm. All graphs show mean ± SD.
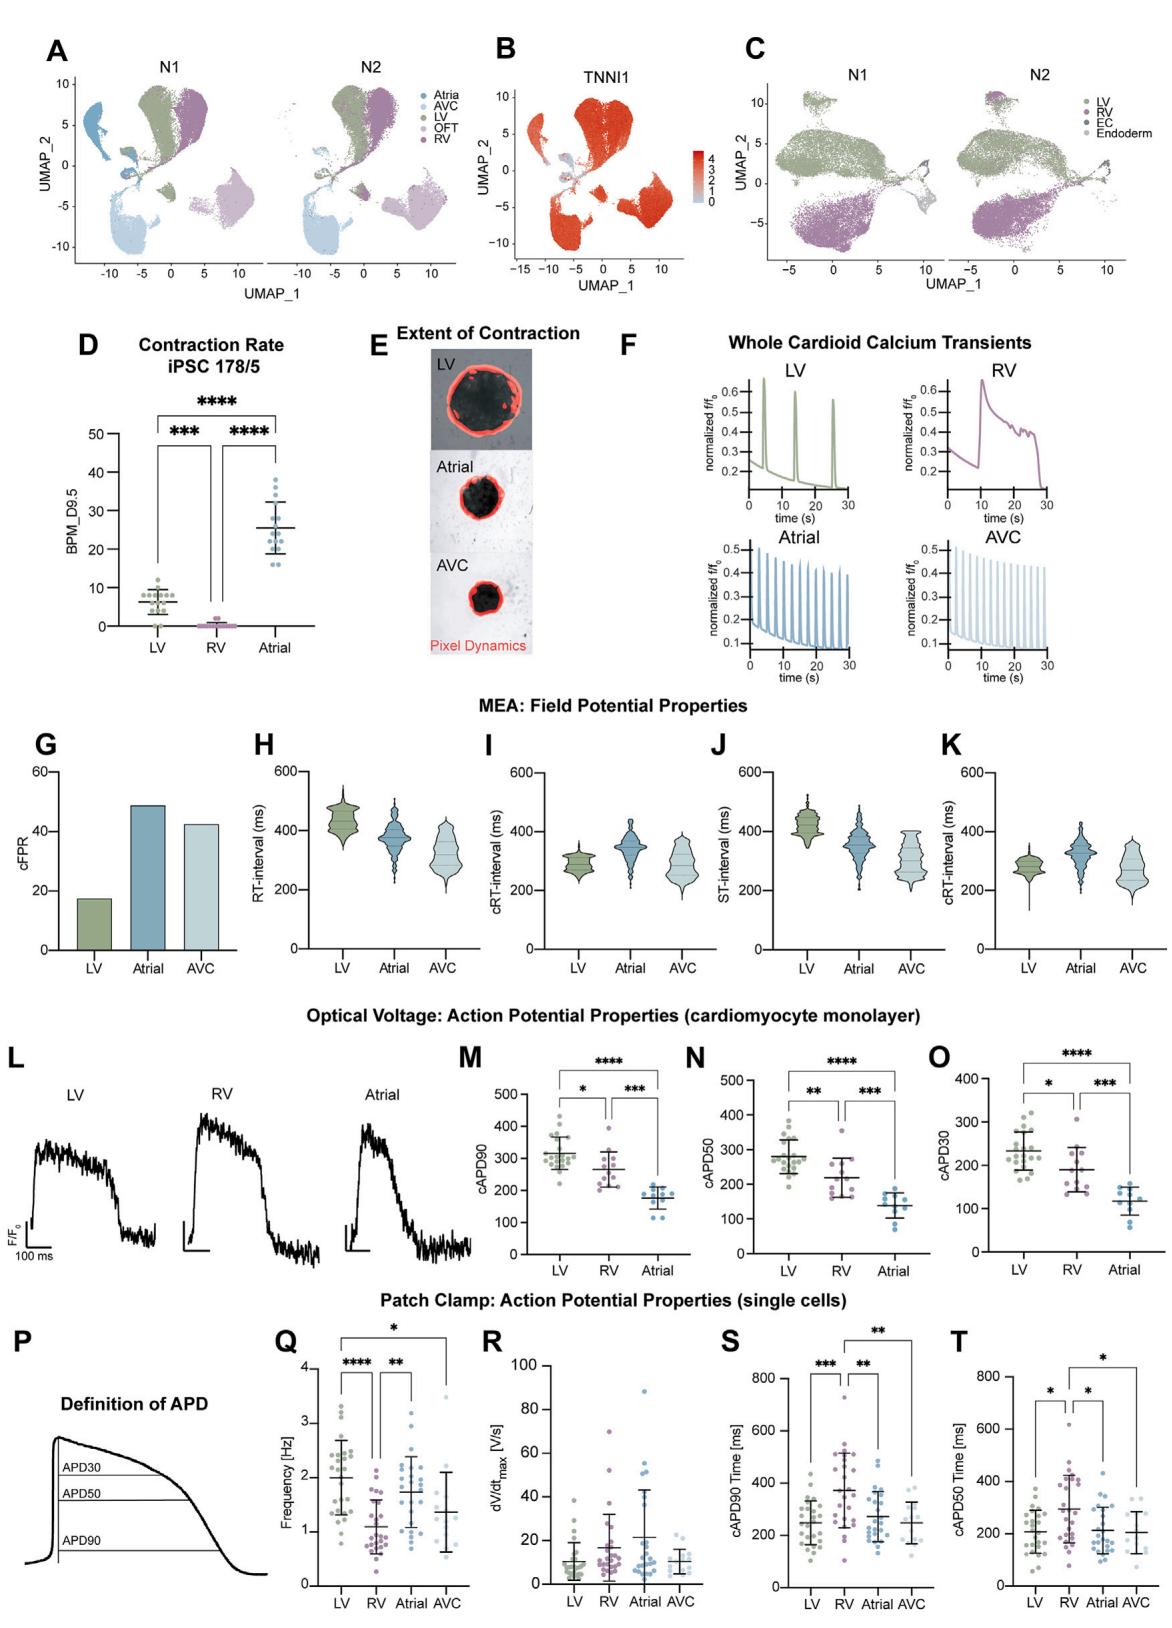
Figure S4. Functional characterization of cardioid subtypes using calcium transients and voltage-sensitive dyes, related to Figure 4
(A) Contraction analysis BPM for , iPSC 178/5 cell line.
(B) Representative images showing the extent of contraction (red) for different organoid types.
© Calcium traces showing the relative change in fluorescence intensity (f/f0) were recorded from the whole cardioid area for a period of ; WTC, TNNT2- GCaMP6f cell line.
(D) Definitions of parameters for subfigures (E)–(G).
(E–G) Quantification of whole cardioid Ca2+ transients (D) 90 to 90 (E) time to reach max intensity (F) time to relaxation. Data were taken at day 9.5. All points
represent the mean of each cardioid across all beats recorded. N = 4, n = 64 LV and AT and N = 1, n=24 technical replicates for the AVC. All cardioids that were not
beating were excluded. This resulted in n = 25, 43, and 24 replicates, respectively, of the LV, atria, and AVC; WTC, CAG-GCaMP6f cell line.
(H–L) Multiple electrode array analysis N = 1, n = 1, number of electrodes as described,19 points represented are the individual electrodes, WTC cell line. (H) cFPR,
cardiac filed potential rate, (I) RT interval, (J) Fridericia-corrected RT interval (cRT interval), (K) ST interval, (L) Fridericia-corrected ST interval.
(M) Representative curves from optical voltage imaging of LV, RV, atrial cardiomyocyte monolayers derived from dissociated cardioids. The y-size bar represents
relative intensity change, and the x-size bar represents 100 milliseconds (ms).
(N–P) (N) Fridericia APD90, (O) APD50, and § APD30 of 2D FluoVolt data. 25 wells for the LV, 26 for the RV, and 13 for the atria were recorded. Each point is an
average of all APs taken within one well.
(Q) Sketch highlighting how APD’s were calculated for patch clamp and FluoVolt.
(R–U) Additional data for patch clamp shown in Figures 4K and 4L. ® Spontaneous beat frequency, (S) maximum upstroke velocity, (T) Fridericia-corrected
APD90 values, and (U) Fridericia-corrected APD50. All graphs show mean ± SD. For all statistics, one-way ANOVA was used. *p < 0.05, **p < 0.01, ***p < 0.001, ****p < 0.0001. ns: not significant.

Figure S5. Progenitor sorting and formation of multi-chamber cardioids, related to Figure 5
(A and A0 ) Cardiac progenitors derived from H2B-GFP or LMNB1-RFP hPSC reporter lines were dissociated and mixed at day 3.5. Cross-sections and schematics of cardioids show the sorting of cardiac cells derived from (A) different progenitor populations and (A0 ) cardioids mixed with the same progenitors. TNNT2 staining shows highly efficient CM differentiation. Scale bars, .
(B) Whole-mount images showing sorting of cardiac progenitors 1 day post-mixing (day 4.5). Scale bar,
© Heatmap of bulk-RNA-seq analysis of cardioids generated with the normal 2D-3D protocol (non-mixed progenitors) showing differentially expressed Cadherin genes over time.
(D) Representative cross-sections of cardioids mixed with different progenitor populations stained of RV-specific (IRX1) and atrial-specific (NR2F2) markers. (E) Whole-mount images of cardioids being fused together on day 3.5 or day 5.5. The images were taken on day 9.5. Scale bars, .
(F) Cardioids 1 day post-fusion (day 4.5). Scale bars, .
(G–I) (G) Percentage of cardioids with calcium activity for each fusion type for day 6.5 and day 9.5. Dots represent N. (H) Percentage of cardioids with calcium reentry activity for each fusion type for day 6.5 and day 9.5. Dots represent N. (I) Speed of signal propagation for each fusion type for day 6.5 and day 9.5. Dots represent n; (G–I) , per subtype exclusions can be found in Table S3.
(J) Wide-field microscopy with a mis-ordered multi-chamber cardioid (atria in the middle) A, atrial cells labeled in blue and RV cells labeled in magenta. (K) Representative calcium signal propagation of (J) for one beat. The map is colored when each pixel reaches of peak intensity.
(L–P) MEA parameters of 3 chambered cardioids on day 14 of differentiation , . (L) Cardiac field potential rate, (M) RT interval, (N) Fridericia-corrected RT interval, (O) ST interval, § Fridericia-corrected ST interval.
(Q) Lineage-specific staining (NR2F2 and IRX1) of two-chambered cardioids.
® Cryosection of multi-chambered cardioids of two different compartments on day 14 using protocol depicted in Figure 5M. Multi-chambered cardioids share some cavities (indicated by the blue arrow) and express TNNT2. vst, variance-stabilized transformed counts. All scale bars in this figure have a length of , unless otherwise stated. All graphs show mean . For all statistics, one-way ANOVA was used. , , , . ns: not significant.
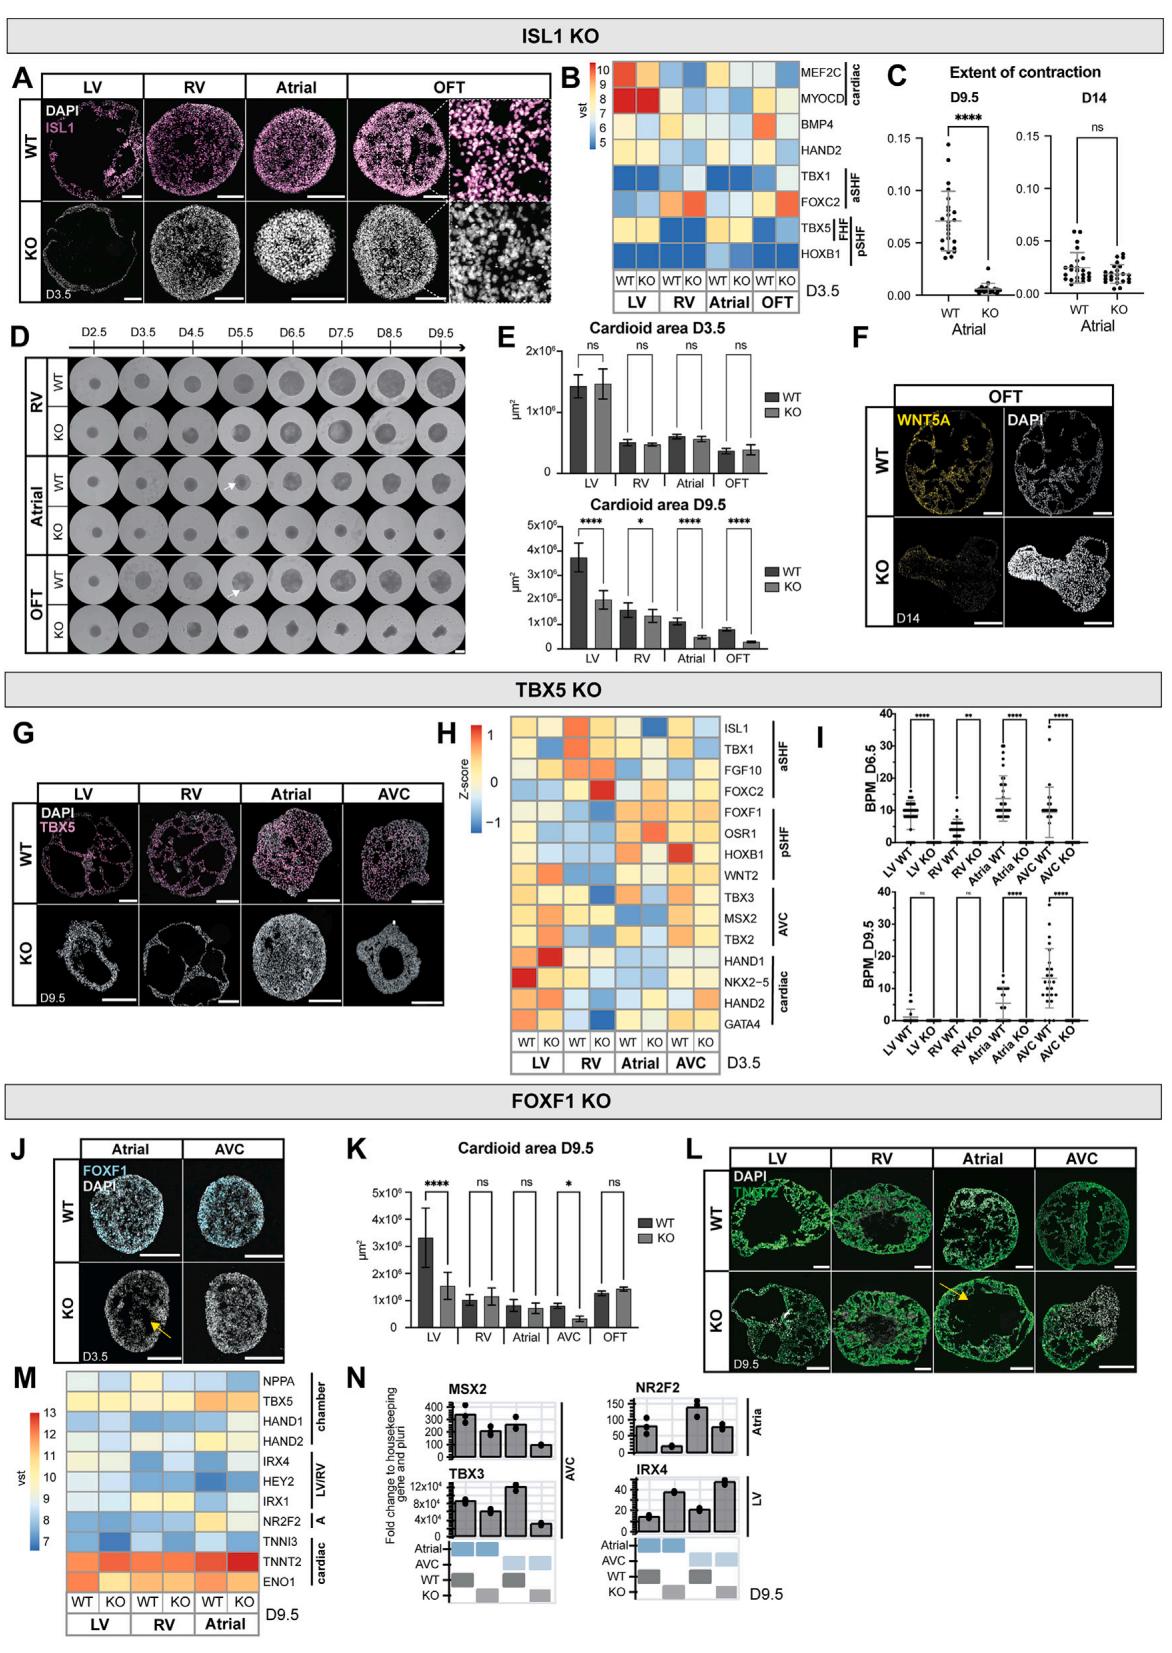
Figure S6. Compartment-specific defects in cardioids with mutations in transcription factors, related to Figure 6 (A) Validation of ISL1-KO line in all protocols at day 3.5 by immunostaining. (B) Bulk RNA-seq analysis, showing compartment-specific genes in ISL1-KO vs. WT at day 3.5.
© The extent of contraction of atrial ISL1-KO cardioids compared with WT at day 9.5 and day 14 (N = 1, n = 24).
(D) Time course of RV, atrial, and OFT cardioid formation using ISL1-KO and WT line. Arrow indicating cavity formation in WT cardioids. Scale bars, 500 mm.
(E) Quantification of the cardioid area of ISL1-KO and WT cardioids at days 3.5 (N = 4, n = 48) and 9.5 (N = 2, n = 32).
(F) HCR of WNT5A (OFT marker) in OFT ISL1-KO cardioids compared with WT at day 14.
(G) Validation of TBX5-KO line in LV, RV atrial, and AVC cardioids at day 9.5 by immunostaining.
(H) Bulk RNA-seq analysis of TBX5-KO and WT cardioids showing aSHF-, pSHF-, and AVC-specific genes at day 3.5.
(I) BPM for LV, RV, atrial, and AVC comparing WT vs. KO on days 6.5 and 9.5 (N = 3, n = 36).
(J) Validation of FOXF1-KO line in atrial and AVC cardioids at day 3.5. Yellow arrow indicating enhanced cavity formation in atrial FOXF1-KO cardioids.
(K) FOXF1-KO and WT cardioid area analysis of all cardioid subtypes at day 9.5 (N = 3–4, n = 24–37 [LV, RV, atria, AVC] and N = 1, n = 16 [OFT]).
(L) TNNT2 expression in FOXF1 WT vs. KO cardioids at day 9.5. Yellow arrow indicating increased cavity in FOXF1-KO atrial cardioids compared with WT.
(M) Bulk RNA-seq analysis showing compartment-specific genes of LV, RV, and atrial cardioids using FOXF1-KO line compared with WT line at day 9.5.
(N) Representative RT-qPCR of atrial and AVC cardioids in FOXF1-KO line compared with WT line. All scale bars in this figure have a length of 200 mm, unless
otherwise specified. RT-qPCR: fold change normalized to a housekeeping gene (PBGD) and pluripotency. vst, variance-stabilized transformed counts. All bar
graphs show mean ± SD. For all statistics, one-way ANOVA was used. *p < 0.05, **p < 0.01, *** p < 0.001, ****p < 0.0001. ns: not significant.
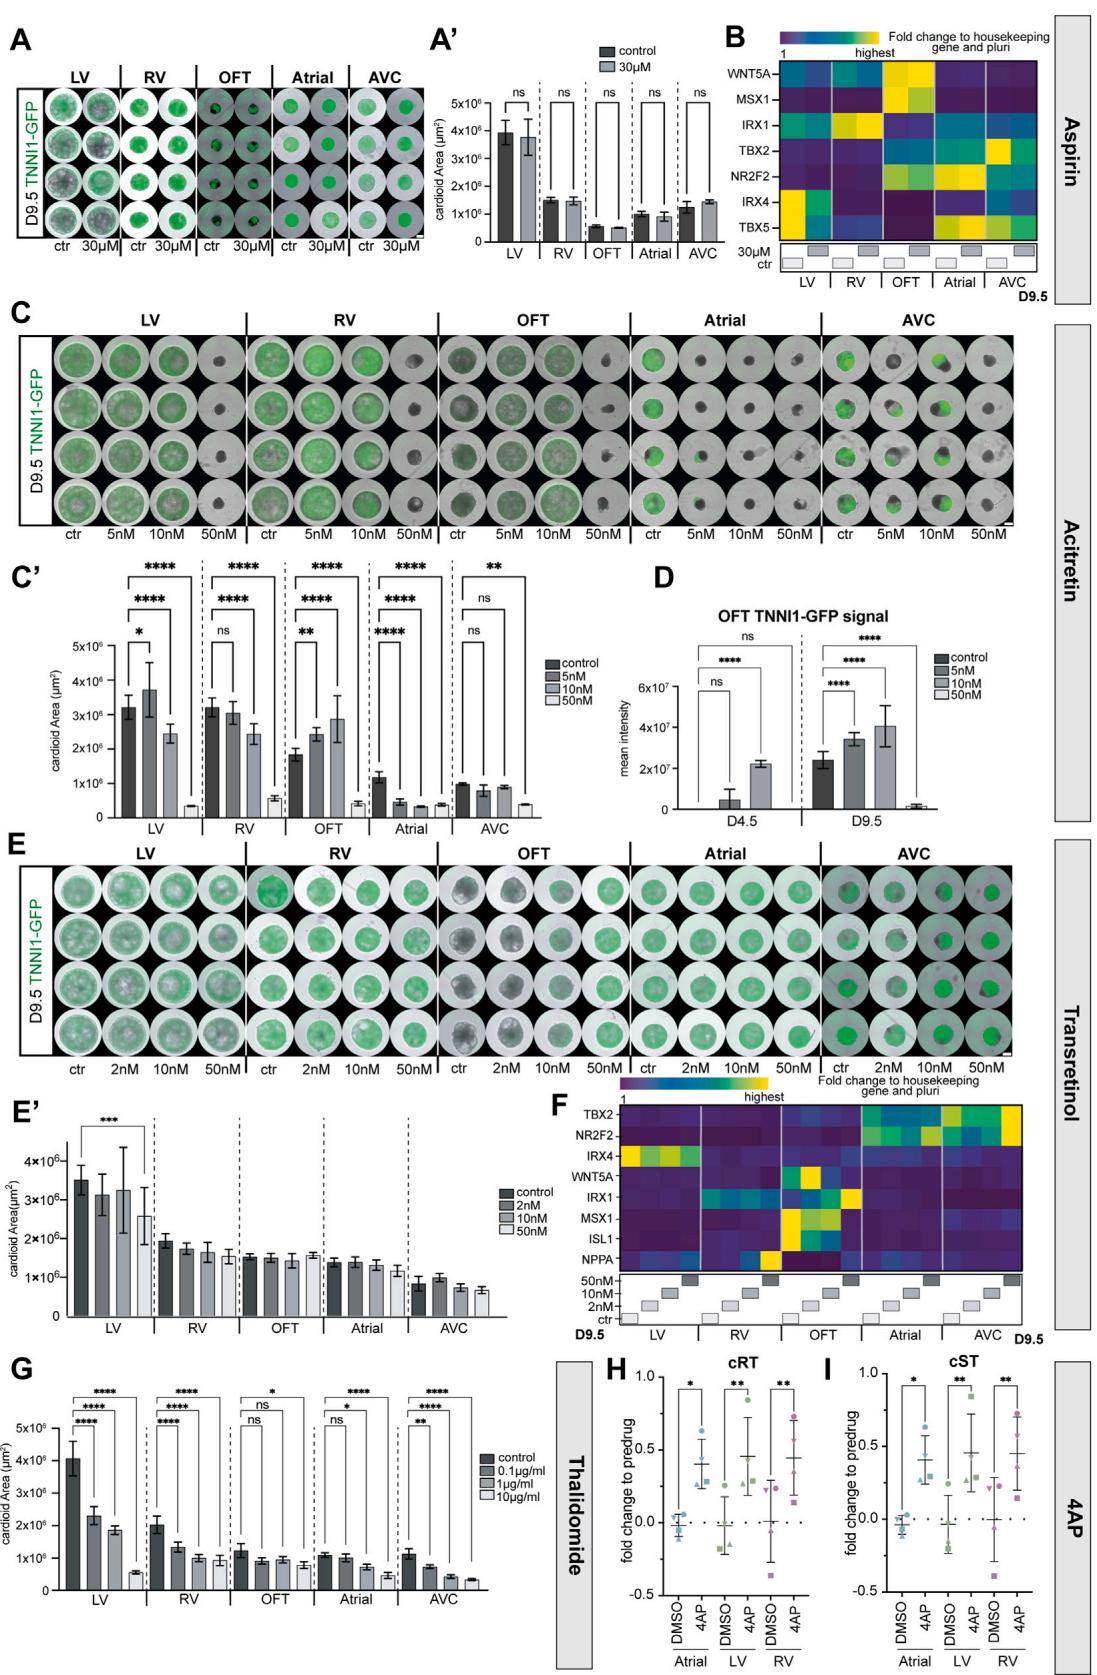
Figure S7. Characterization of teratogen-induced compartment-specific defects in cardioids, related to Figure 7
(A–G) All cardioids were treated with teratogens from mesoderm induction (day 0) until day 9.5. Several experiments were run using different concentrations.
(A)Representative whole-mount images and (A0) representative quantification of the area of cardioids derived from TNNI1-GFP reporter line treated with Aspirin,
compared with untreated cardioids. Day 9.5 (N = 1, n = 8). Ctr, control.
(B) RT-qPCR of cardioids treated with Aspirin, compared with control cardioids.
© Representative whole-mount images of cardioids treated with different concentrations of acitretin and (C0) representative quantification of the cardioid area at day
9.5 (N = 1, n = 8).
(D) TNNI1-GFP reporter signal qualification in OFT cardioids treated with acitretin compared with untreated cardioids at days 4.5 and 9.5. (N = 1, n = 8).
(E) Representative whole-mount images and quantification (E0) of cardioids derived from TNNI1-GFP reporter line treated with trans-retinol at day 9.5 (N = 1,n = 8).
(F) RT-qPCR shows compartment-specific genes of all cardioid subtypes induced with trans-retinol on day 9.5.
(G) Quantification of the size of cardioids derived from TNNI1-GFP reporter line induced with different concentrations of thalidomide, compared with control cardioids (day 9.5) (N = 1, n = 8). Ctr, control.
(H and I) Multiple electrode array analysis on triple chamber cardioids (ordered atrial-LV-RV) at day 14 of DMSO (control) and 4AP (N = 3, n = 4).
(H) Fold change of Fridericia-corrected RT interval normalized to pre-drug for. Dots represent n.
(I) Fold change of Fridericia-corrected ST interval normalized to pre-drug. Dots represent n. All scale bars in this figure have a length of 500 mm. RT-qPCR: fold change normalized to a housekeeping gene (PBGD) and pluripotency. All bar graphs show mean ± SD. For all statistics, one-way ANOVA was used. *p < 0.05, **p < 0.01, ***p < 0.001, ****p < 0.0001. ns: not significant.