¶ Ataxia Telangiectasia patient-derived neuronal and brain organoid models reveal mitochondrial dysfunction and oxidative stress
Hannah C. Leesona*, Julio Aguadoä, Cecilia Gómez-Inclanä, Harman Kaur Chaggara Atefah Taherian Fardä, Zoe Huntera, Martin F.Lavinb, Alan Mackay-SimC, Ernst J. Wolvetang a,
a The University of Queensland, Australian Institute for Bioengineering & Nanotechnology (AIBN), St. Lucia, Brisbane, QLD 4072, Australia
b The University of Queensland, UQ Centre for Clinical Research (UQCCR), Herston, Brisbane, QLD 4006, Australia
c Griffith Institute for Drug Discovery, Griffith University, Nathan, Queensland, Australia
¶ ARTICLEINFO
Keywords: Ataxia telangiectasia Brain organoids Mitochondria Neurodegeneration Cellular senescence Oxidative stress
¶ ABSTRACT
Ataxia Telangiectasia (AT) is arare disorder caused by mutations in the ATM gene and results in progressive neurodegeneration for reasons that remain poorly understood.In addition to its central role in nuclear DNA repair,ATMoperates outside the nucleus to regulate metabolism,redox homeostasis and mitochondrial function. However,asystematic investigation into how and when loss of ATMaffects these parameters in relevant human neuronal models of AT was lacking.We therefore used cortical neurons and brain organoids from AT-patient iPSC and genecorrected isogenic controls to reveal levels of mitochondrial dysfunction,oxidative stre,and senescence that vary with developmental maturity. Transcriptome analyses identified disruptions in regulatory networks related to mitochondrial function and maintenance,including alterations in the PARP/SIRT signaling axis and dysregulation of key mitophagy and mitochondrial fission-fusion processes.We further show that antioxidants reduce ROS and restore neurite branching in AT neuronalcultures,and ameliorate impaired neuronal activity in AT brain organoids.We conclude that progressive mitochondrial dysfunction and aberrant ROs production are important contributors to neurodegeneration inAT and are strongly linked to ATM’s role in mitochondrial homeostasis regulation.
¶ 1.Introduction
Ataxia Telangiectasia (AT) isa rare autosomal recessive disorder caused by mutations in the ataxia-telangiectasia-mutated (ATM) gene, which encodes a serine/threonine kinase involved in DNA damage response and antioxidant defence pathways.Symptoms include immune defects,increased risk of cancers,premature aging,and ataxia resulting from progressive neurodegeneration of the cerebellum (Stracker et al., 2013; Shiloh and Lederman, 2017). In a healthy individual,ATMis activated in response to double strand DNA breaks and functions as a master regulator of a complex signalling axis that coordinates DNA repair,cell cycle arrest or apoptosis (Bakkenist and Kastan, 2Oo3; Shiloh and Ziv, 2O13). Although neurons do not undergo DNAreplication,double strand DNA breaks can still arise from both physiological neuronal activity (Madabhushi et al., 2Ol5),and from a mitochondria-to-nucleus retrograde signalling cascade that originates with dysfunctional mitochondria and generation of reactive oxygen species [ROS;(Vizioli et al., 202O)].Nevertheless,it remains unclear how defective ATM leads to degeneration of post-mitotic cells in the cerebellum and hippocampus of AT patients,and debate continues as to whether this is simply attributable to a faulty DNA damage response (Shiloh,2O2O),or if other processes are at play, such as improper cell cycle re-entry (Rimkus et al., 2Oo8), oxidative damage (Ditch and Paull, 2012) or impaired synaptic functions (Li et al., 2009).
ATM emerged as an important modulator of mitochondrial homeostasis and oxidative stress following the identification of increased levels of ROS in the cerebellum of mice (Kamsler et al., 2001; Quick and Dugan,20Ol; Chen et al., 2003). Elevated oxidative stress and perturbed mitochondrial function has also been detected in lymphocytes and immortalised lymphoblastoid cells from AT patients (Reichenbach et al.,2002; Ambrose et al., 2007),as well as in AT patient fibroblasts, which displayed decreased mitophagy (Valentin-Vega et al., 2Ol2).This is of particular interest when considering the important role mitochondria play in neuronal function,and the particular sensitivity of the cerebellum to mitochondrial impairment (Lax et al., 2Ol2; Lopriore et al.,2O22),where any deviation in mitochondrial homeostasis can negatively impact neuronal integrity and function (Kann and Kovacs, 2007).ATMlocalises to the mitochondria and may be directly activated by oxidative stress in a mitochondrial dependent manner and in the absence of DNA damage response pathway activation, demonstrating that ATMalso functions as a sensor of ROS and mediates antioxidant responses (Valentin-Vega et al., 2012; Guo et al., 201O; Morita et al., 2014). Oxidized ATM forms a disulfide-cross-linked dimer (Guo et al., 2010),and when activated by oxidative stress,ATM has over 2500 protein targets (Kozlov et al.,2016),compared with 700 protein targets identified in response to DNA damage (Matsuoka et al., 2007).
Despite this,there have been a limited number of studies dedicated to examining ATM function in non-transformed human neuronal models (Corti et al., 2019; Lee et al., 2013), none of which explore mitochondrial dysfunction.Although ATM-deficient mice recapitulate some of the cellular defects observed in AT,other AT-related defects such as neuronal degeneration are not evident in mice (Lavin, 2013). Neuronal models derived from induced pluripotent stem cells (iPSCs) of individuals with AT therefore present an opportunity to examine the role of ATMin mitochondrial dysfunction in a relevant, non-transformed human neuronal system.Here we quantify mitochondrial content, membrane potential and oxidative stress levels in AT patient neural models across different stages of maturation, from primary tissues, through iPSC and iPSC-derived neuronal progenitors,2D neuronal cultures and finally brain organoids,to systematically map the nature and temporal modulation of mitochondrial dysfunction.We explore neuronal activity and senescence phenotypes related to mitochondrial function,as well as key gene regulatory networks controlling mitochondrial processes,and highlight several mechanisms that putatively contribute to neuronal degeneration in AT.
¶ 2.Methods
Unless otherwise stated all reagents were purchased from Thermo Fisher Scientific.
¶ 2.1.Human olfactory epithelial cell culture
AT patients were diagnosed at the AT Clinic, University of Queensland Centre for Clinical Research,Brisbane,Australia.Biopsies from the olfactory mucosa of five AT patients and six healthy age matched controls were collected with informed consent as described previously (Stewart et al.,2Ol3) and the resulting olfactory epithelial (ONS) cells were cultured in DMEM/F12 supplemented with foetal bovine serum (FBS),1:10o GlutaMAX,1:10O non-essential amino acids (NEAAs) and Penicillin-Streptomycin (PenStrep).Cultures were passaged approximately every 5 daysas they reached confluency.
¶ 2.2.Induced pluripotent stem cell culture and neuronal diffrentiatior
Four iPSC lines were used in this study;ATand control iPSCs derived from ONS cells (Leeson et al., 202la; Leeson etal., 2021b),referred to as ‘AT’and control’;and AT32 patient and isogenic (gene corrected) iPSC pair (Nayler et al., 20l7; Ovchinnikov et al., 2020; Nayler et al., 2012). The ATM mutations are described in Sup Fig.3.iPSCs were maintained in mTeSR Plus (STEMCELL Technologies) on hESC-qualified Matrigel (Corning) coated plates.Clump passaging was performed using EDTA at confluence approximately every 5 days. Stockswere cryopreserved as cell clumps using Synth-a-Freeze,and thawed in the presence of ROCK inhibitor Y-27632( Tocris).
iPSC lines were differentiated to neurons using a protocol modified from Shi, Kirwan (Shi et al.,2Ol2).Briefly,iPSC were cultured to confluence then the medium replaced with neural differentiation medium (1:1 DMEM/F12 and Neurobasal medium,supplemented with 1:200 N2,1:100 B-27,1:100 GlutaMAX,1:200 NEAAs, insulin, -mercaptoethanol and PenStrep) supplemented with SB431542( :Milteny Biotec) and LDN-193189 Sigma).3 N medium plus SB and LDN was replaced daily for1O days,then cells were passaged using Dispase II (2.4 units/mL)and re-plated at a 1:3 dilution on Matrigel coated plates in \leavevmode { 3 N } medium.The neuro-epithelial cells were fed everyother day,with FGF2 (PeproTech) added upon appearance of neural rosettes.Rosettes containing neural progenitor cells (NPCs) were manually selected and all subsequent passages were performed at confluence using Accutase.NPCs were cultured eitheras 2D monolayers plated on Matrigel coated plates,or as 3D neurospheres in low attachment plates.For neuronal maturation, NPCs (P2 onwards) were seeded at on PLO and laminin coated plates or coverslips.3 N neural differentiation medium was supplemented with ascorbic acid ;Sigma),dibutyryl-cAMP :Sigma),BDNF( ;PeproTech),GDNF PeproTech)and DAPT( :Sigma).Neurons were cultured for between 2 and10 weeks,with a medium exchange 3 times per week. For some assays,neuronal cultures were treated with ATM inhibitors KU-55933 or KU-60019 (Sigma, each,3 times per week with feeds),the antioxidant -acetyl cysteine (NAC; daily)or the anaplerotic agent fatty acid heptanoate (C7; ,3 times per week with feeds).Treatments were applied for1O-12 days prior to assessment at 4 weeks.
¶ 2.3. Brain organoid generation
Brain organoids were generated from human AT32 mutant and gene corrected iPSCs.iPSCs were dissociated using Accutase and seeded at a density of 15,0oo cells per well in 96-well low-attachment U-bottom plates in mTeSR Plus with ROCK inhibitor.The plates were spun at for to aggregate the cells.Spheroids formed overnight and were fed daily for 5 days with KSR medium [DMEM/F12, Knockout Serum Replacement (KSR),1:100 GlutaMAX,1:20O MEM-NEAA, Dorsomorphin :StemMACS)and A-83-01 :Lonza)].On day 6,the medium was changed to induction medium containing DMEM/F12,1:100 N2,1:100 GlutaMAX,1:200 MEM-NEAA, heparin (Sigma), CHIR 99021 (Lonza) and SB-431542 (Sigma).On day 11 spheroids were embedded in Matrigel droplets, gelled at for )and transferred to low-attachment 24-well plates containing induction medium.From day 16,the medium was changed to organoid medium containing a 1:1 mixture of DMEM/ F12 and Neurobasal medium supplemented with supplement, 1:50 B27 supplement,1:100 GlutaMAX,1:200 MEM-NEAA, PenStrep, 2-mercaptoethanol and insulin,with medium changed three times per week until harvesting at 1Oo days post embedding.
¶ 2.4. Immunochemistry
All samples were fixed with paraformaldehyde.Cells and organoid sections were permeabilised with Triton-X100 at and blocked with BSA for ,Primary antibodies were incubated overnight at ,and secondary antibodies were incubated for at room temperature.All antibodies used are listed in Supplementary Materials Table S1.Nuclei were counterstained with DAPI prior to mounting. Images were captured using an Olympus BX61 or a Zeiss AxioScan. Captured images were analysed using FIJI (ImageJ) or Cell Profiler.
¶ 2.5.Mitochondrial function assaysand Operett high-content imaging
Total mitochondrial content was measured using MitoTrackerTM Deep Red FM live cell stain ,incubated for ).Mitochondrial membrane potential was measured using tetramethylrhodamine ethyl ester(TMRE;Abcam, ,and ROS production was evaluated with MitoTrackerTM Red CM-H2Xros;a reduced, nonfluorescent rosamine dye that fluoresces upon oxidation by ROS species prior to mitochondrial sequestration( , : Following incubation,cells were rinsed and counter stained with Hoechst 33342,rinsed again and returned to medium without phenol red for imaging.An Operetta CLS high-content analysis system (PerkinElmer) was used to acquire images.At least 3 biological replicates were performed per experiment.
¶ 2.6. Unbiased image quantification using Harmony
Harmony software was used for unbiased automatic quantification of mitochondrial stains captured via the Operetta CLS high-content analysis system. Analysis pipelines were modified from predefined Harmony algorithms,and advanced flatfield correction was applied to all image. Nuclear regions were determined using Hoechst or DAPI staining,with modifications as required to diameter,splitting sensitivity and common thresholds.The cell body surrounding nuclear objects was identified with modifications as required to thresholds.Cytoplasm regions were calculated by subtracting the nuclear region from the cell body region. Border objects and irregular or dead cells were excluded.Fluorescence intensity per pixel unit of selected objects was calculated.For neuronal cultures,thresholds were set to restrict the cytoplasmic ROI to the perinuclear space.Spot detection algorithms were used to identify mitochondrial puncta along neuronal processes.For ONS,iPSC and NPCs, generally 25-40 fields of view per 96 well plate well were captured, with approx.2oo-5oo cells quantified per field of view.For neuronal cultures,between 5O and 8o fields of view were generally acquired per well of the 24 well plate wells,capturing between 20o,0o0 and 40o,0oo cells, with the Find Spots algorithm generally identifying around 3oo,000 to 600,00o puncta per field of view.Field of viewresults were averaged and data output is provided as a whole well result for each well).All statistical analysis and interpretations were performed on well results.
¶ 2.7. Senescence-associated galactosidase assay (SA-β-Gal)
Neuronal 2D cultures were washed in PBS, fixed for in paraformaldehyde,washed,and incubated at (in the absence of carbon dioxide) with fresh SA Gal stain solution : Potassium ferricyanide ,Potassium ferrocyanide ,Sodium dihydrogen phosphate ,Sodium hydrogen phosphate ,Sodium chloride ,Magnesium dichloride and 5-bromo-4-chloro-3-indolyl -D-galactopyranoside . Staining was evident in and maximal in 1 2 { - } 1 6 \mathrm
¶ 2.8. Western blotting
Cells were rinsed with PBS and lysed with RIPA buffer ( Tris pH 8, sodium chloride, Triton X-100, sodium deoxycholate, SDS),containing protease and phosphatase inhibitors (Roche). Samples were prepared at of protein with DTT (204 and Laemmli SDS loading dye and heated at for 10 mins for samples for probing with total ATM. Samples for probing with OXPHOS antibody cocktail were not heated due to MTCO1 (of complex IV) being very sensitive to heating.Lysates were resolved by SDS-PAGE under denaturing conditions and transferred to nitrocellulose membranes.For the OXPHOS antibody cocktail, transfer was to a PVDF membrane using high pH CAPS transfer buffer ( CAPS [3-(Cyclohexylamino)-1- propanesulfonic acid], methanol, pH11).Membranes were blocked in skim milk powder in TBS-Tween for .Primary antibody cocktails were diluted in blocking buffer and incubated at overnight.Membranes were washed and probed with HRP-conjugated secondary antibody for one hour at room temperature.Cross-reactivity was detected using Clarity ECL (Bio-Rad) or Femto maximum sensitivity substrate for OXPHOS cocktail. Captured images were analysed using Image Lab 4.1 (Bio-Rad) software.Protein expression levels were normalised to a loading control ( -actin or -tubulin). Uncropped blots are provided in supplementary data.
¶ 2.9.qPCR
Total RNA from cultured cells and brain organoids was isolated with RNeasy Mini Kit (Qiagen) according to the manufacturer’s instructions. of total RNA was reverse transcribed using iScriptcDNA Synthesis Kit (Bio-Rad).qPCR used PowerUp SYBR Green Master Mix(Applied Biosystems) on a Bio-Rad CFX96 Touch Real-Time PCR detection system.Each reaction was performed in duplicate with 3 biological replicates.ETFA or GAPDH were used as housekeeper genes.Primer sequences are listed in Table S2.
¶ 2.10. RNA sequencing
AT32 mutant and gene corrected 2-week-old neurons (3 biological replicates each) and 1oo-day-old brain organoids (4 organoids each) were submitted for RNA sequencing.The integrity of RNA was confirmed by analysis on a 21Oo Bioanalyzer RNA 6Ooo Pico Chip kit (Agilent) using the RNA Integrity Number (RIN) prior to sequencing by Novogene Ltd. (Hong Kong). Total RNA libraries were generated using NEBNext? UltraTMRNALibrary Prep Kit for Ilumina? (NEB,USA) and were sequenced on an Ilumina NovaSeq 15o bp paired-end platform. Fastp was used to check quality on the raw sequences before analysis to confirm data integrity.Paired-end clean reads were mapped to the human genome assembly hg38 using HISAT2 software.Feature counts was used to count the read numbers mapped of each gene, including known and novel genes,and RPKM of each gene was then calculated based on the length of the gene and reads count mapped to this gene. Differential expresson analysis between groups was performed using DESeq2R package.The resulting values were adjusted using the Benjamini and Hochberg’s approach for controlling the False Discovery Rate (FDR).Genes with an adjusted P (padj) value found by DESeq2 were assigned as a differentially expressed gene (DEG). Gene Ontology (GO term) enrichment and KEGG pathway analysis were conducted using the Database for Annotation,Visualization and Integrated Discovery (Sherman et al., 2O22) based on either up or down regulated DEGs.Brain organoid RNA sequencing data have been deposited in the European Nucleotide Archive with the primary accession code PRJEB72015.
¶ 2.11. Multi-electrode array
Multi-electrode array (MEA) analysis was conducted on organoids matured for at least 1oo days usinga high-resolution (4o96 electrodes) BioCamXMEA platform (3Brain,Switzerland). Organoids were transitioned to BrainPhys medium with NeuroCult SM1 neuronal supplement (StemCell Technolgies) and were adhered to the BioCamX chip over 3 days prior to recording at ,Following acquisition,data was filtered using the integrated BrainWave5 software and processed to identify spikes (activity SD from the baseline) and bursts ( spikes with max intervals of ).Spike frequency (mean firing rate;MFR), amplitude,duration and inter-event-intervals were calculated within BrainWave5.Electrodes not in contact with the organoid or recording a MFR of spikes/s were excluded from analysis.At least 3 separate recordings (with different organoids)were conducted over a window,with glutamate applied at the 1 min time point.MFR post glutamate treatments were normalised to the pre-glutamate (basal)
MFRs. -acetyl cysteine (NAC; )or heptanoate (C7; treatments were applied for two weeks prior to recordings.BioCamX data is expressed as SE.
¶ 2.12.Statistical analysis
Unless otherwise stated,for each experiment at least 3 biological repeats (N,referring to differentiations conducted from the point of iPSCs) were conducted with a minimum of 2 technical repeats referring to parallel wells or differentiations conducted simultaneously from the same NPC culture). Statistical significance was determined by ttest (independent samples) or one-way ANOVA and post-hoc analysis was carried out using Tukey HSD.In cases where Levene’s test for homogeneity showed a significant effect of variance,the more stringent Welch’s One-Way ANOVA was carried out and Games-Howell post-hoc test was used to reduce the chance of type l errors. The values were reported as calculated to three decimal points.Analysis of data was conducted using IBM SPSS Statistics 27 or GraphPad Prism.
¶ 3. Results
¶ 3.1.Primary olfactory epithelial cells from AT patients do not exhibit mitochondrial disturbances
To investigate disease specific differences in mitochondrial function in primary tissue from AT and control patients,we first utilised human olfactory epithelial cells (ONS;Sup Fig.1 A-C) obtained from the primary olfactory epithelial mucosa (Beites etal.,2oo5).They possess some characteristics of neural epithelial cells (Stewart etal.,2Ol3) and exhibit disease-specific differences in several neurological disorders including AT (Stewart et al.,2013; Mackay-Sim,2012).We quantified total mitochondrial content and mitochondrial membrane potential (Sup Fig.1D,E),and reactive oxygen species (ROS) production was measured using MitoTracker Red CM- (Sup Fig.1F). Our unbiased analysis pipeline (Sup Fig.1G) revealed no significant differences in any of these parameters between control and AT ONS cells.Western blotting further revealed no differences in individual oxidative phosphorylation (OXPHOS) complexes between control and AT samples (Sup Fig.2),and we concluded that ONS cells from AT patients do not exhibit altered mitochondrial content,mitochondrial respiratory complex expression, membrane potential or mitochondrial ROS production as compared to control ONS cells.
¶ 3.2.Mitochondrial perturbances emerge in AT stem and neuronal progenitor cell populations
Given that neuronal degeneration is one of the most debilitating aspects of AT,and currently remains one of the least understood,we next investigated mitochondrial dysfunction in a relevant neuronal model.Hence,we reprogrammed ONS cells to iPSCs with the aim of investigating mitochondrial dysfunction in patient-derived neurons and brain organoids.AT ONS line 3 and control ONS were reprogrammed into iPSCs as described previously (Leeson et al., 2O2la; Leeson et al., 2021b).These lines and our previously generated AT32 patient and isogenic (gene corrected) iPSC pair (Nayler et al., 2Ol7; Ovchinnikov et al., 2O2O; Nayler et al., 2Ol2) have mutations resulting in a truncated non-functional ATM protein [Sup Fig. 3;(Leeson et al.,2021a; Ovchinnikov et al.,202O)].Western blot confirmed reduced ATM expression in AT ONS derived-iPSCs and AT32 mutant iPSC clonal lines. AT32 gene correction rescued expression to levels comparable with control ONS derived-iPSCs (Fig.1A).
Mitochondrial content,membrane potential and oxidative stress in ONS-derived AT and control iPSC lines were next quantified (Sup Fig.3D),revealing decreases in both MitoTracker and TMRE in AT compared to control iPSCs (Fig.1B-D),and texture analysis of MitoTracker Deep Red staining showed AT mitochondria exhibit altered structure and/or sub-cellular networking compared to the mitochondria of the control iPSC line.Increased oxidative stress was also observed in AT iPSCs (Fig.1E),in agreement with previous observations (Ovchinnikov et al.,2O2O).AT,control and gene corrected iPSC were next differentiated to neural progenitor cells (NPCs) and neurons (Shi et al., 2012),and these expressed comparable levels of progenitor and early neuron markers (Sup Fig.4).No significant difference in mitochondrial content was detected in AT NPCs (Fig.1F,G),whereas membrane potential was significantly reduced in both AT patient lines compared to their respective controls (Fig.1H,I).Furthermore,oxidative stress levels were increased in ATM deficient NPC cultures with the mean CM-H2Xros fluorescence intensity increasing by in ONS-derived AT and in AT32 mutant NPCs compared to their control counterparts (Fig.1J, K).
We concluded that AT iPSC have less and structurally altered mitochondria and exhibit a modest increase in ROS production as compared to control counterparts.Further,AT iPSC do not show defective differentiation into NPCs.AT NPCs do not have abnormal mitochondrial content,but do exhibit a reduction in mitochondrial membrane potential and increased ROS production as compared to unrelated and isogenic controls,similar to what was observed in undifferentiated iPSCs.Given these significant defects in mitochondrial membrane potential and increased ROS production,we hypothesised that this would likely have downstream impacts on mitochondrial homeostasis during neuronal maturation.
¶ 3.3.AT patient iPSC-derived neurons show defective and mis-localised mitochondria
AT and their respective control/isogenic corrected neurons were matured for 2-4 weeks (Fig. 2A),and by 2 weeks of cells expressed the neuronal markers tubulin and Map2 (Fig.2B).AT mutant neurons displayed evidence of blebbing and fragmentation consistent with neuronal degeneration,which was most apparent following βI tubulin staining.Fluorescence intensities of mitochondrial dyes were measured in both the soma (neuronal cell body) as well as in the neuronal processes (neurites) of 2-and 4-week-old neurons (Sup Fig.5A).2-week-old AT neurons exhibited reduced cytoplasmic MitoTracker intensity and an increase in intensity in the neurites (Sup Fig.5B,C),suggesting mitochondria are becoming localised to the neuron periphery.Mitochondrial membrane potential correlated with MitoTracker observations (Sup Fig.5D,E).In contrast to NPC cultures, 2-week neurons showed no significant differences in oxidative stress levels between AT32 mutant and isogenic corrected neurons (Sup Fig. 5F, G).
By 4 weeks of maturation, neuronal cultures demonstrated differing mitochondrial phenotypes to their younger 2-week-old counterparts. ONS-iPSC derived AT neurons demonstrated impairments in mitochondrial localisation and/or trafficking,as indicated by decreased total mitochondrial staining in the cytoplasmic region (Fig.2C,D) and a increase in the number of mitochondrial puncta in their neurites (Sup Fig.7A),while neurite spot intensities remained unchanged.We speculate that this may be related to impairments in mitochondrial turnover and recycling of damaged mitochondria,in keeping with ATM’s role as a regulator of mitophagy (Valentin-Vega et al., 2Ol2; Cirotti et al., 2021; Yeo et al., 202la; Sarkar et al., 2O21) and of mitochondrial fission (Luo et al.,2O23).Conversely,AT32 mutant neurons had significant reductions in neurite mitochondria while retaining a consistent puncta count (Fig.2C,E,Sup Fig.6A).This also points to impairments in structural arrangements and fission/fusion of mitochondria,though it is likely that both scenarios are present and contribute to an overarching phenotype of mitochondrial impairment,with the discrepancies between cells lines likely reflecting patient-specific differences.TMRE continued to reveal perturbances in mitochondrial membrane potential in 4-week neuronal cultures (Fig.2F-H),similar to that observed in both NPCs and 2-week neurons,and was particularly evident in the cytoplasmic mitochondrial fluorescence levels (Fig.2G).
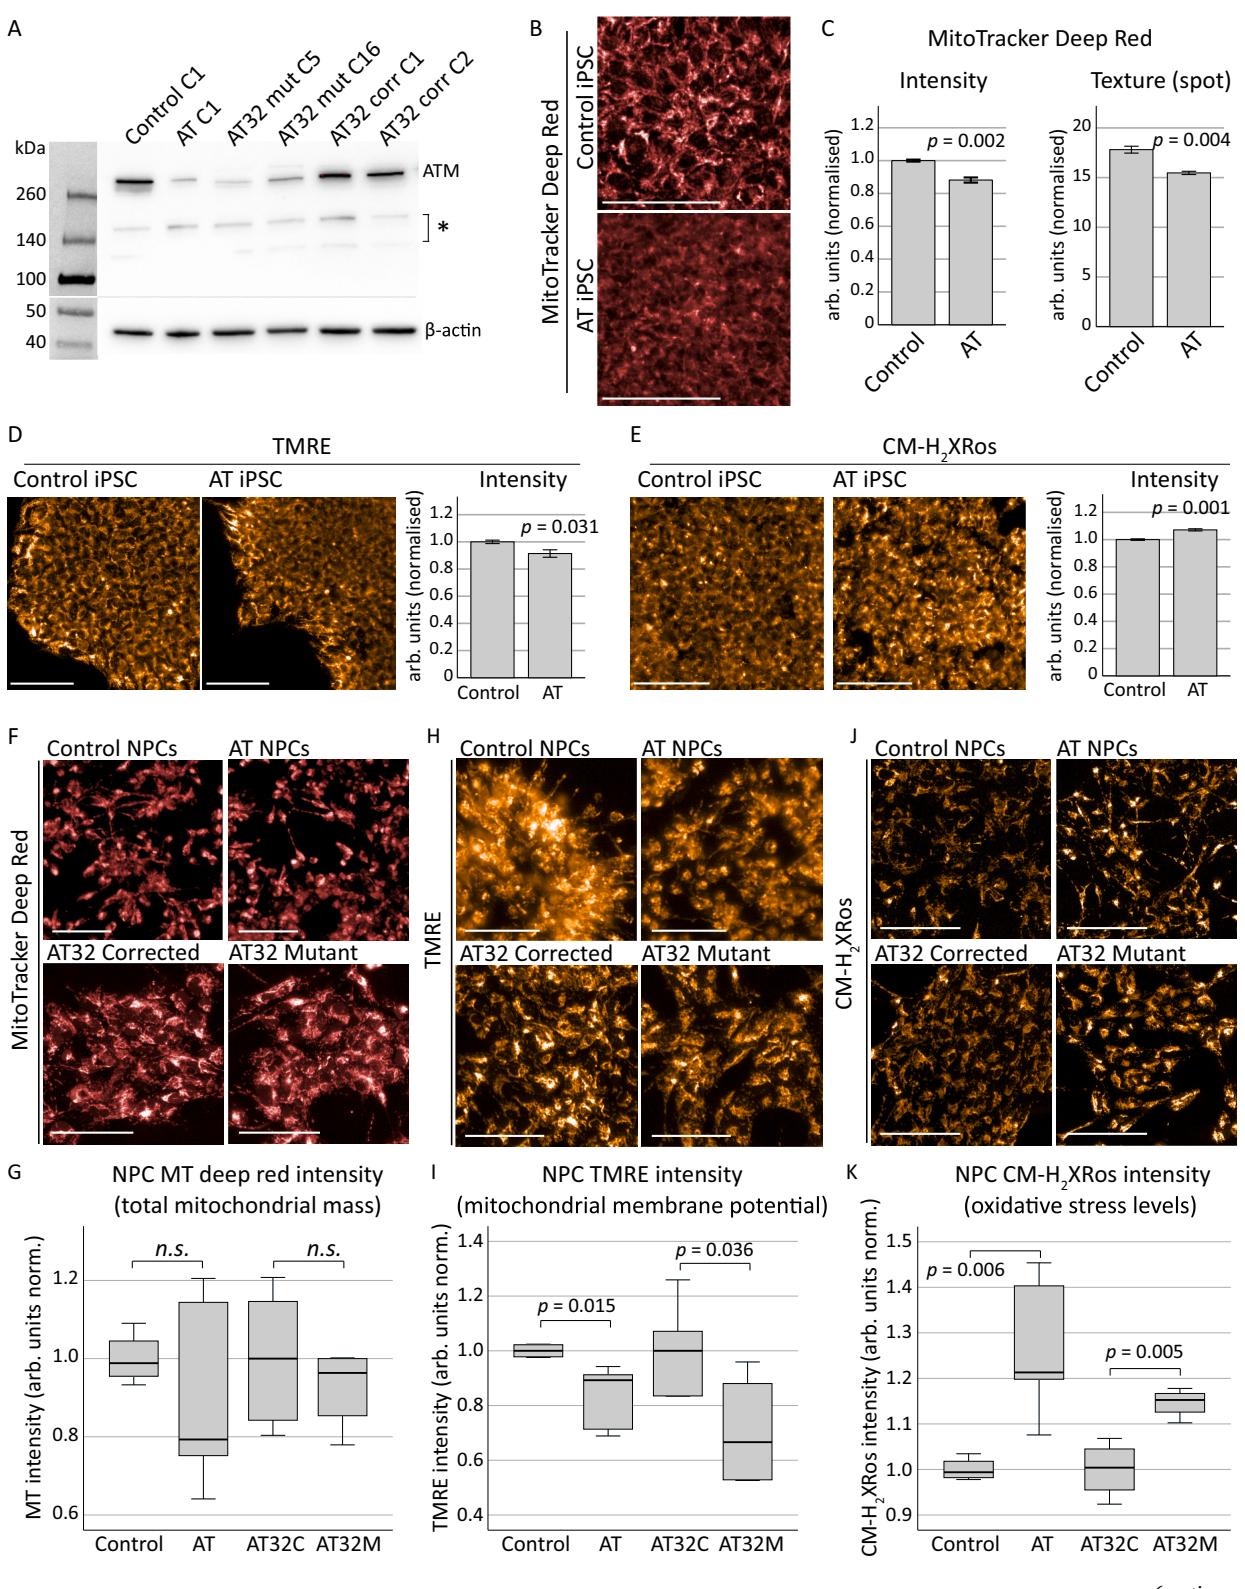
Fig. 1. Mitochondrial assessments on AT patient-derived iPSCs and NPCs.
A) Western blot confirmed a reduction in ATM protein levels in the AT ONS-derived iPSC line (AT clone 1 [C1]) compared to the control line (control clone C1), as well as in two clones of AT32 iPSC lines (mutant clones C5 and C16, and corrected clones C1 and C2). Gene correction in the AT32 line restored ATM expression to levels similar those seen in the control lines. Asterisk indicates non-specific bands. C refers to the clone number. B-E) Mitochondrial content and function in AT and control iPSC lines were assessed by MitoTracker Deep Red and TMRE, while oxidative stress was measured by CM-H2Xros. MitoTracker Deep Red (B,C) identified significant decreases in mitochondrial content (t(4) = − 7.026, p = 0.002) and texture analysis of staining demonstrated AT iPSCs contained structurally altered mitochondria compared to the mitochondria of the control iPSC line (t(4) = − 6.106, p = 0.004), using an unbiased algorithm to quantify saddle/spot/ridge variables of each puncta. TMRE (D) demonstrated a significant reduction in membrane potential (t(8) = − 2.854, p = 0.031) in AT iPSCs compared to control iPSCs, and an increase in oxidative stress levels as measured by CM-H2Xros (E) was also observed in AT iPSCs (t(4) = 8.947, p = 0.001). Error bars are mean ± SE. F-K) AT, control and AT32 iPSCs were differentiated to NPCs and assessed for mitochondrial content, function and oxidative stress. MitoTracker Deep Red (F-G) identified no sig nificant difference in mitochondrial content between control and AT NPCs (t(8) = 1.124, p = 0.303), nor between AT32 mutant and gene corrected NPCs (t(8) = 0.797, p = 0.449). TMRE (H–I) demonstrated a significant reduction in membrane potential in both AT and AT32 mutant lines compared to the control and AT32 corrected NPCs (t(8) = − 3.411, p = 0.015 and t(8) = 2.512, p = 0.036 respectively). J-K) Oxidative stress levels as measured by CM-H2Xros were significantly increased in both AT lines (AT v control; t(8) = − 4.384, p = 0.006, AT32 pair; t(6) = − 4.263, p = 0.005]. Bar graphs are mean ± SE, and box plots are median ± IQ with whiskers representing minimum and maximum data points. All scale bars indicate 100 μm. AT; AT ONS-derived iPSC line. Control; control ONS-derived iPSC line. AT32C; AT32 gene corrected iPSC line. AT32M; AT32 mutant iPSC line. C; clone number. (For interpretation of the references to colour in this figure legend, the reader is referred to the web version of this article.)
Interestingly,when we assessed oxidative stress levels using MitoTracker in 4-week-old neuronal cultures we observed a significant decrease in fluorescence levels,contrary to observations in iPSC and NPC cultures (Fig.2I-K). Though unexpected, this reversal in fluorescence levels from that seen in stem and progenitor cell cultures is consistent with 2-week neuron observations,where no significant difference was observed.Hydrogen peroxide treatment ina control neuron culture was used as a positive control for oxidative stress (Sup Fig. 6B), and we confirmed oxidation and sequestration of dye into mitochondria occurred in a linear manner in both ATM deficient and gene corrected lines (Sup Fig.6C),meaning this reduction in fluorescence levels was not due to plateauing of dye uptake.Protein expression levels of individual OXPHOS complexes showed complex II protein levels were significantly increased in AT32 mutant neurons,and other complexes were altered but did not reach significance (Sup Fig.6D-F).
While detects cellular ROS levels by fluorescing only once the dye becomes oxidized,mitochondrial sequestration is dependent upon membrane potential.We hypothesised that the loss of ATM in neurons results in chronic impairment of mitochondrial membrane potential,as indicated by TMRE,preventing efficient CM uptake in mutant neurons.To explore this hypothesis,we measured the impacts of ATM inhibition in otherwise healthy cultures.Control neurons were treated with ATMkinase inhibitors (KU-55933 or KU-60019)prior to mitochondrial assessment at 4 weeks and interrogated mitochondrial content (Fig. 3A-C),membrane potential (Fig. 3D-F) and oxidative stress (Fig.3G-I).KU-6o019 resulted in a significant increase in cytoplasmic intensity of MitoTracker Deep Red,and mitochondrial puncta localised to the neurites also fluoresced brighter and were aggregated in appearance,indicative of mitochondrial fusion or decreased mitophagy as was previously reported (Valentin-Vega et al., 2Ol2). Supporting this, a significant reduction in mitochondrial puncta localised to the neurites was observed following ATM inhibition (Fig.3J).Increased TMRE fluorescence in both cytoplasmic and neurite mitochondria was also observed following acute ATM inhibition (Fig.3D-F).In contrast to observations that ATM-deficient neurons showed decreased CM-H2Xros fluorescence due to chronically impaired mitochondrial membrane potential,we found that acute chemical inhibition of ATM in control neurons with otherwise healthy mitochondria resulted ina significant increase in fluorescence in mitochondria localised to both the cytoplasm and neurites (Fig.3G-I),indicative of significant ROS production.Notably,treatment with ATMinhibitors did not reduce the number of neurons based on nuclei count (Fig.3K),suggesting that ATM signalling deficiency drives mitochondrial defects in the absence of cytotoxic effects.This data indicates there are significant levels of oxidative stress in neurons lacking a functional ATM signalling pathway and supports ATM’s role as a sensor of oxidative stress and orchestrator of the cellular response to ROS (Guo et al.,2OlO).This further highlights that chemical inhibition of ATM may not be comparable to genetic loss of ATMin all instances,whether that be due to the duration of ATM loss (acute or chronic),or to the mechanism (chemical inhibition or genetic mutation).
Collectively,we concluded that ATM-deficient neurons display severe mitochondrial dysfunction that become more pronounced over the course of the maturation process,with consistent alterations in mitochondrial content or localisation,and reductions in mitochondrial membrane potential likely affecting respiratory chain function and oxidative stress levels (Amo et al., 2011).
¶ 3.4.Transcriptome analysis of AT patient-derived neurons and cortical brain organoids reveals oxidative stress and mitochondrial defects
To gain further insight into the possible mechanisms and consequences of this mitochondrial dysfunction,we performed bulk RNA sequencing of AT32 mutant and isogenic corrected iPSC,2D neuronal cultures (2-week-old) and 3D brain organoids (1oo-day-old).We confirmed similar neural differentiation capacity between mutant and corrected neurons (Sup Fig.7),and comparison of AT32 corrected and mutant neurons identified 1836 DEGs (Fig.4A); comparatively,brain organoids had nearly 90oo DEG (Fig.4B). This was explained by principal component analysis,where gene set space determined that ATMdeficient neurons and organoids were separable from transcriptomes of ATM-proficient counterparts (Sup Fig.8A, 9 A).Approximately of neuronal DEGs were also identified in the brain organoid data set (Sup Fig.8C).KEGG pathway analysis identified strong mitochondrial impairments in AT32 mutant brain organoids,including upregulation of oxidative phosphorylation and TCA cycle pathways,as well as increases in mRNAs coding for genes involved in ROS metabolism,neurodegeneration,and cellular senescence.Conversely,mRNAs coding for genes in synapse function,axon guidance,and cell cycle signalling pathways were downregulated (Fig.4C).GO terms showed significant enrichment of oxidation-reduction,cellular respiration,and electron transport chain processes,as well as response to stress processes including ROS,oxidative and ER stress,and increased cell and neuron death and apoptotic processes (Fig.4D).Consistent with a nonfunctional ATM protein,DNA and double-strand break repair were downregulated,as well as processes relating to neurogenesis,nervous system development,and synaptic transmission.Notably,mitochondrial and organelle organisation, fission,localisation and transport processes were also impacted,aligning with our observations of alterations in mitochondrial localisation between neuronal cell body and processes (Fig.4E).The top 10-15 GO and KEGG terms for all categories are shown in Sup Figs.8 and 9.
We next investigated the extent of oxidative stress in both neurons and organoids by analysing gene expression patterns of markers of oxidative stress (Fig. 5A).Both AT32 mutant neurons and organoids demonstrated a distinct oxidative stress phenotype compared to the gene corrected counterparts,with a higher number of marker genes reaching significance in the organoid models,consistent with our earlier conclusion that mitochondrial dysfunction compounds with increasing neuronal maturity. One of the most notable genes upregulated in both ATM mutant neurons and organoids is CHCHD2 (9.6 Log2FC, 101;also known as MNRR1),a key regulator of oxidative and cell stress responses (Purandare et al., 2018; Aras et al., 2013),mitochondrial metabolism, the electron transport chain (Aras et al.,2Ol5),and mitochondrial biogenesis and morphology (Aras et al., 2O2O; Liu et al., 2020).CHCHD2 can also act as an inhibitor of apoptosis (Liu et al., 2015; Liu and Zhang,2Ol5),and is associated with neurodegeneration and Parkinsons disease (Kee et al., 2021; Jansen et al., 2015; Ikeda et al., 2022; Ikeda et al., 2019; Funayama et al.,2015; Imai et al., 2019). Other notable oxidative stress genes upregulated in ATM mutant neurons and organoids include the superoxide dismutases SOD2 and SOD3,PTGS1 (cyclooxygenase 1; COX-1), CAT(catalase) and SQSTM1 (p62).Catalase and p62 have been linked to autophagy of peroxisomes mediated by ATM phosphorylation of PEX5,which recruits p62 and directs the autophagosome to peroxisomes to induce pexophagy in response to ROS (Zhang et al., 2O15). ATM has previously been identified at the peroxisome (Watters et al.,1999),and contains a FATC domain thought to be a peroxisome targeting sequence. Interestingly,AT patientswith mutations in this FATC domain do not display the radiosensitivity typical of AT patients(Guo et al., 2O1O) indicating that this domain functions independently of ATM’s DNA damage response.
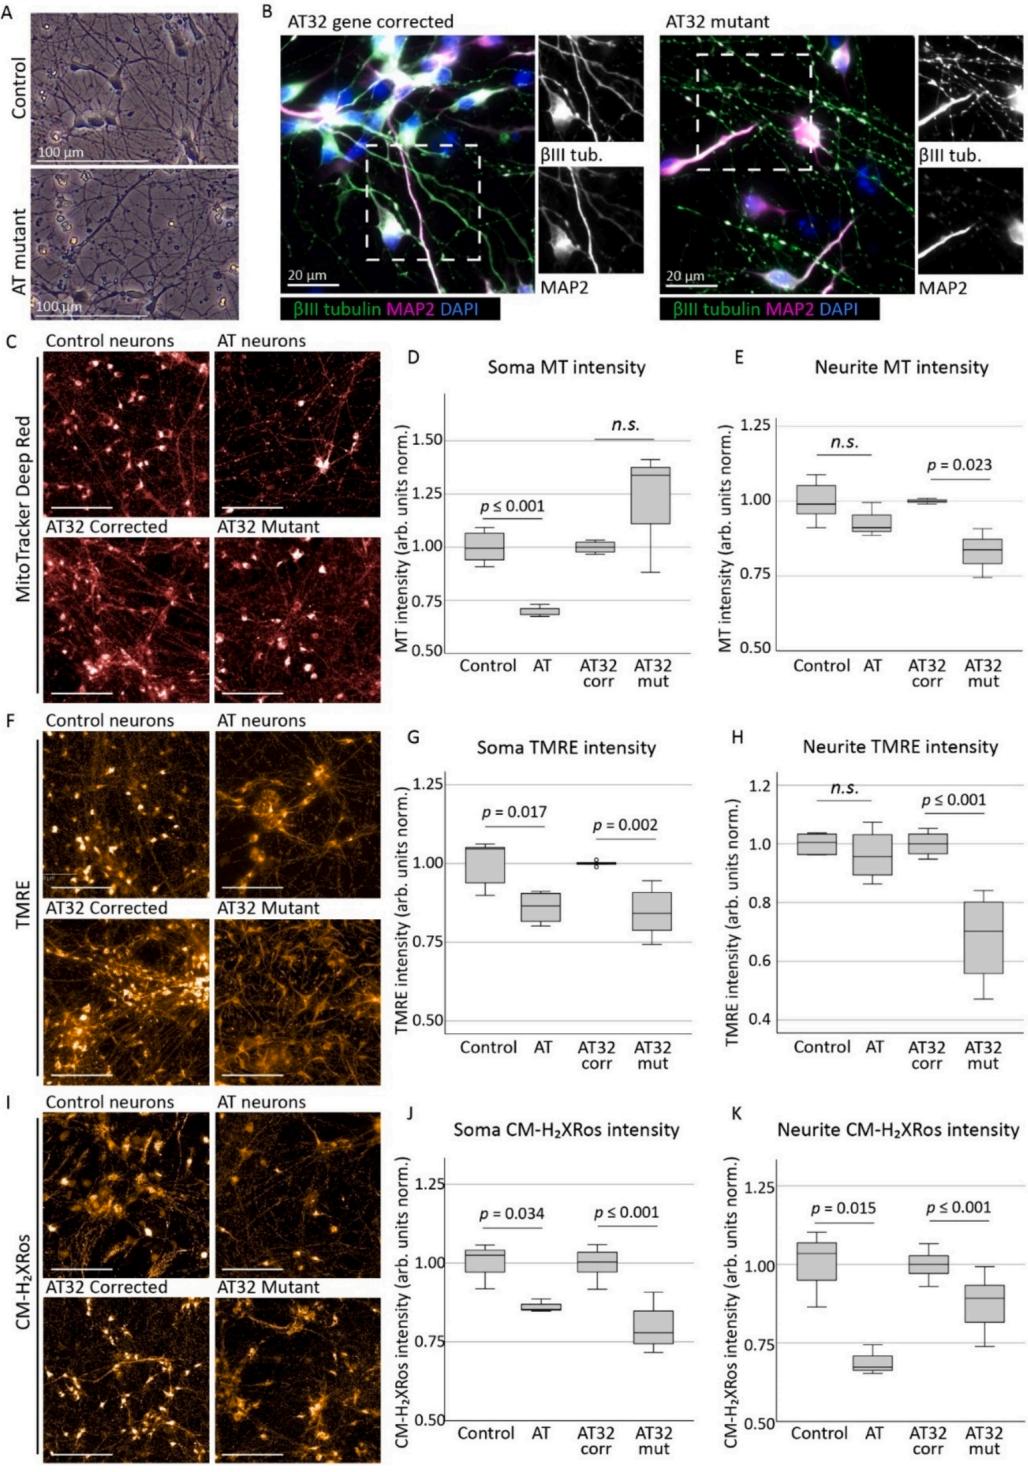
Fig. 2. Mitochondrial assessments on AT patient iPSC-derived neurons
A) Neuronal networks generated from AT patient and control/gene corrected iPSCs were cultured on PLO and laminin and matured for 2–4 weeks. B) Neurons expressed neuronal markers βIII tubulin and MAP2, with AT mutant neurons displaying degrees of fragmentation consistent with a neurodegenerative phenotype. C)Mitochondrial content in AT patient and control/gene corrected neurons were assessed by MitoTracker Deep Red. Soma intensity (D) showed a significant reduction in AT neurons compared to control (t(6) = − 6.177, p ≤ 0.001), though not in AT32 neurons (t(6) = − 1.269, p = 0.165). Conversely, neurite fluorescence levels (E)identified a significant reduction in mitochondria localised to the projections in AT32 mutant neurons (t(4) = 3.566, p = 0.023) while the AT and unrelated control lines were not altered (t(9) = 1.645, p = 0.134). TMRE assessment (F) demonstrated consistent impairments in mitochondrial membrane potential in ATM deficient neurons at 4 weeks, particularly in soma mitochondria (G; AT v control t(7) = − 3.100, p = 0.017; and AT32 isogenic lines t(11) = 5.285, p = 0.002). Neurite fluorescence of TMRE (H) was also reduced in AT32 mutant neurons (t(11) = 6.102, p ≤ 0.000), though not in the AT neuron line vs its unrelated control (t(7) =0.853, p = 0.422). CM-H2Xros staining (I) showed reduced soma fluorescence intensity (J) in AT (t(4) = 3.163, p = 0.034) and in AT32 (t(35) = 10.987, p ≤ 0.000) neurons compared to their respective controls, as well as in neurite intensity (K; t(4) = 4.085, p = 0.015, and t(35) = 5.822, p ≤ 0.000, respectively). Scale bars 100μm. Box plots are median ± IQ with whiskers representing minimum and maximum data points. (For interpretation of the references to colour in this figure legend,the reader is referred to the web version of this article.
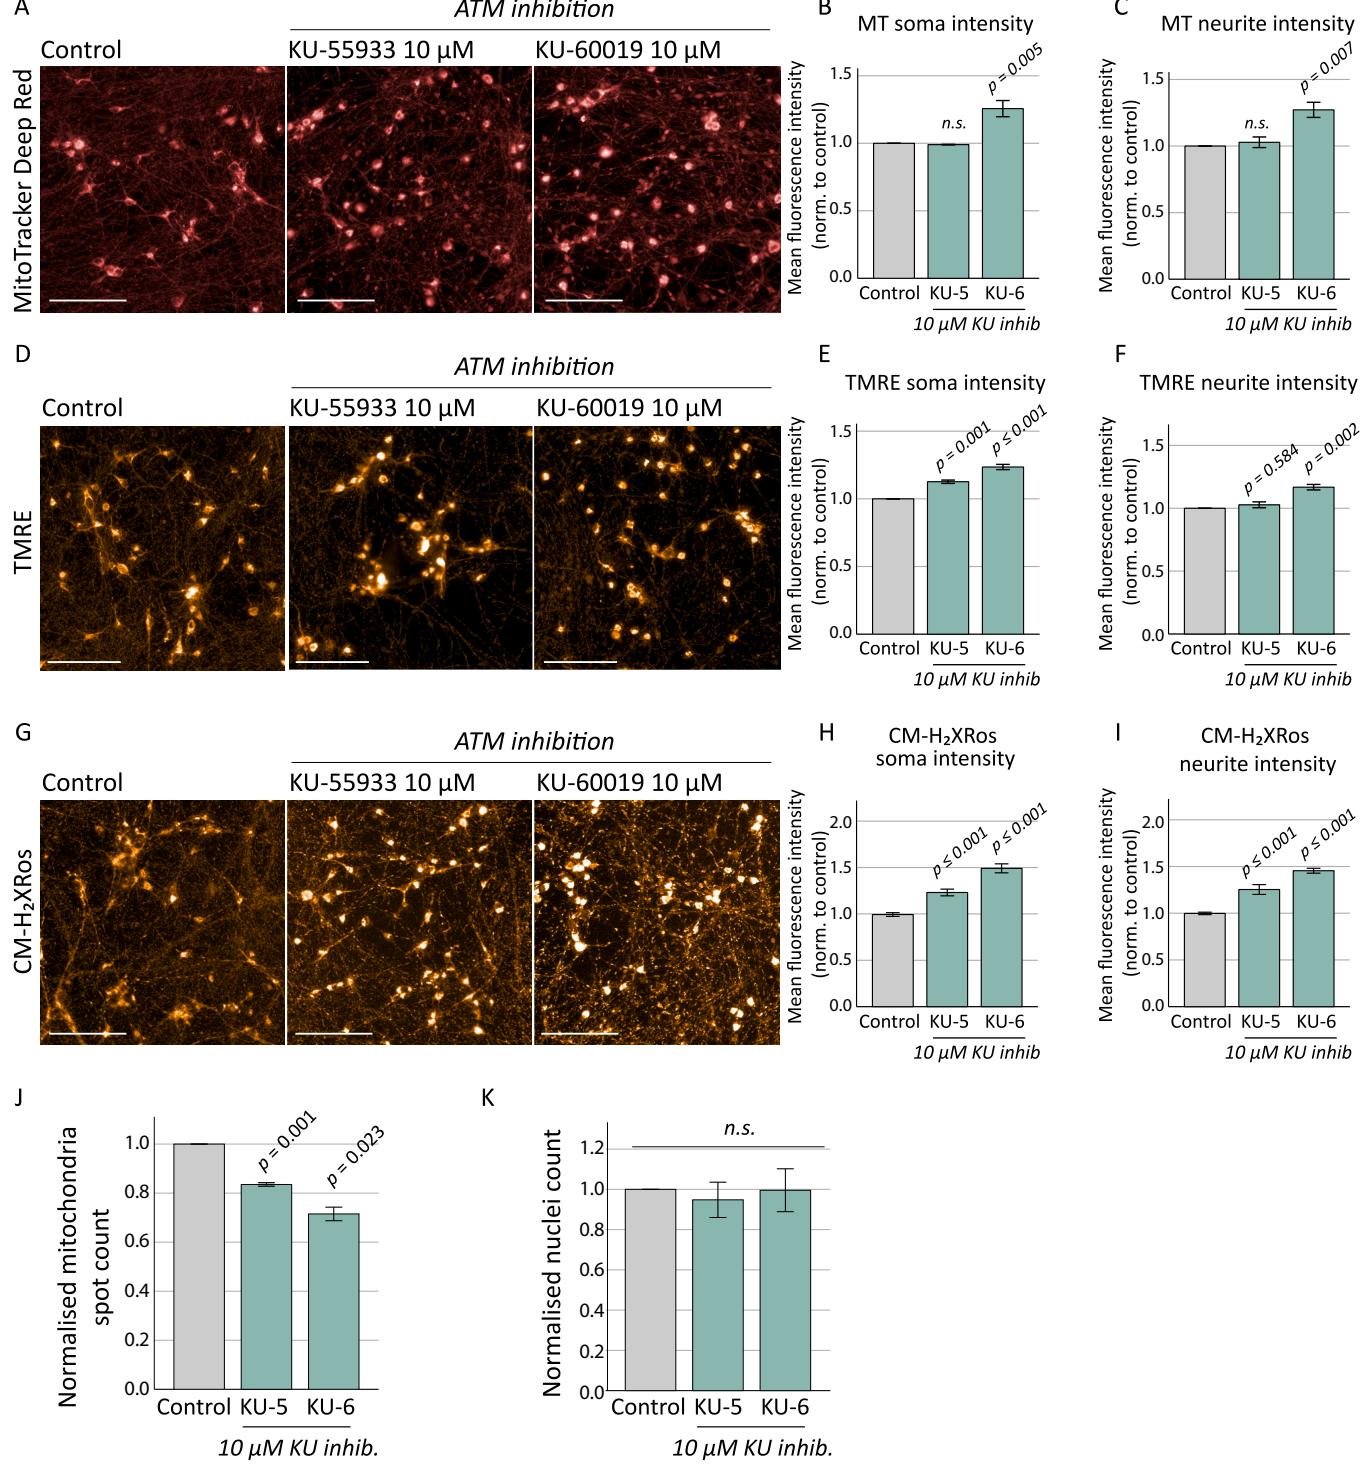
Fig.3.Mitochondrial assessments on control neurons treated with chemical ATM inhibitors.
Control neurons were treated with ATM inhibitors KU-55933 and KU-60019 (10 μM) for 10 days prior to mitochondrial assessment at 4 weeks. Neurons were stained with MitoTracker Deep Red (A), and KU-60019 treatment caused increases in fluorescence intensity in both soma [B; F(2, 8) = 19.001, p = 0.003] and neurite puncta [C; F(2, 8) = 13.918, p = 0.006] as determined by ANOVA, with Tukey post hoc analysis identifying p values of 0.005 and 0.007 respectively. KU-55933 made no significant differences to mitochondrial content. D) TMRE staining to measure membrane potential identified an increase in fluorescence levels in both soma and neurite staining following KU-55933 and KU-60019 treatments. E) Soma TMRE intensity: F(2, 8) = 78.289, p ≤ 0.001; Tukey post hoc analysis KU-55933 p = 0.001, and KU-60019 p ≤ 0.001 compared to control. F) Neurite TMRE intensity: F(2, 8) = 23.535, p = 0.001, Tukey post hoc analysis KU-55933 p = 0.584 and KU-60019 p= 0.002. G) CM-H2XRos fluorescence increased following chemical inhibition of ATM signalling, indicating a significant oxidative stress phenotype. (H) Soma CMH2XRos fluorescence intensity: F(2, 18) = 49.530, p ≤ 0.001; Tukey post hoc analysis: p ≤ 0.001 and p ≤ 0.001 for KU-55933 and KU-60019 respectively, and (I) neurite CM-H2XRos fluorescence intensity: F(2, 18) = 33.655, p ≤ 0.001; Tukey post hoc analysis: p ≤ 0.001 and p ≤ 0.001 for KU-55933 and KU-60019 respectively. J) ATM chemical inhibition resulted in a significant reduction in number of mitochondrial puncta (spot count) located in neuronal processes [F(3,11) = 28.117, p ≤0.001] for both KU-55933 (p = 0.001) and KU-60019 (p = 0.023), though ATM inhibition did not affect the number of neurons based on nuclei count [K; F(2, 8) =0.617, p = 0.571]. Treatments with inhibitors were normalised to untreated controls. Scale bars; 100 μm. Error bars are mean ± SE. KU-5; KU-55933. KU-6; KU-60019. (For interpretation of the references to colour in this figure legend, the reader is referred to the web version of this article.)
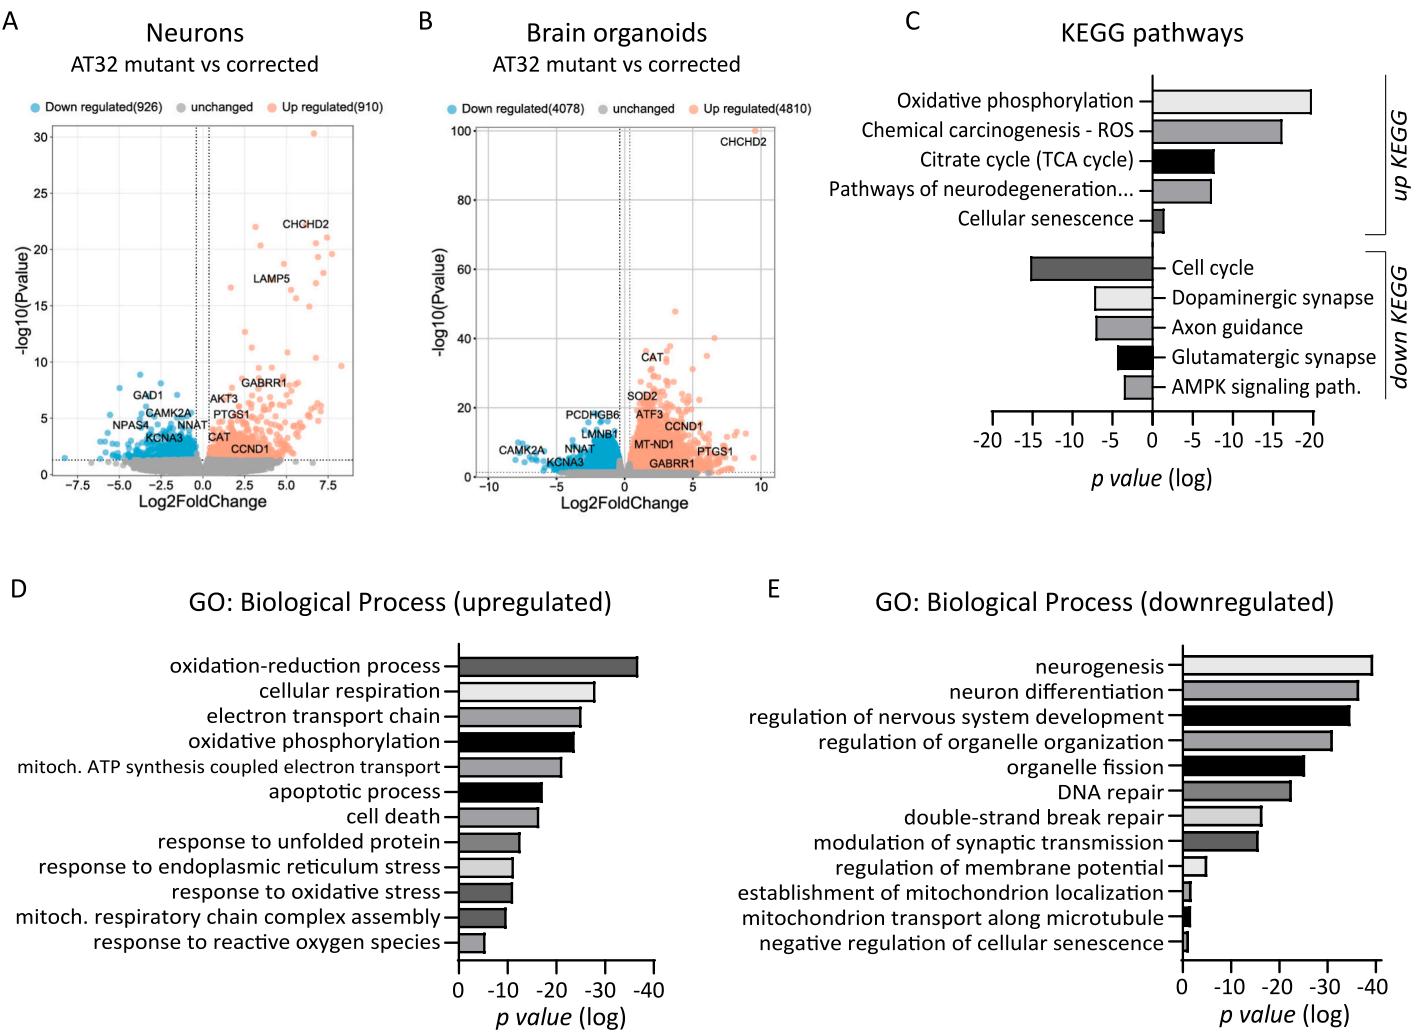
Fig.4. Transcriptomic analysis of AT32 neuron and brain organoid cultures. RNA sequencing was conducted on AT32 2-week-old neurons and 100-day-old brain organoids. A) Volcano plots showing comparison between AT32 mutant and gene corrected neurons identified 1836 DEGs (910 genes upregulated and 926 down regulated in the mutant compared to the corrected), while comparatively, 100-day-old brain organoids had nearly 9000 DEG (B; 4810 genes upregulated and 4078 down regulated in the mutant compared to the corrected). KEGG pathway © and GO analysis (D, E) were conducted on up and down DEGs separately, and were enriched for pathways involved in mitochondrial processes, such as oxidative phosphorylation and electron transport chain, as well as response to stress processes including oxidative and ER stresses. DEG; differentially expressed gene. GO; gene ontology.
To indirectly gauge neuronal activity,we examined the expression of immediate early genes (IEGs),which are known to be dependent on functional mitochondria.We found that expression of NPAS4,FOSB,FOs and NR4A2 were significantly reduced in ATM mutant neuronal cultures (Fig.5A),aligning with the downregulation of KEGG and GO terms related to synaptic transmission and function (Fig.4).This was not evident in the organoid model system,presumably because organoids contain numerous other cell types that can mask subtle changes in neuronal gene expression levels.Markers of senescence and inflammation were also assessed,since we have previously shown that AT brain organoids have increased senescence compared to embryonic stem cell derived controls (Aguado et al., 2O21). In agreementwith these data,a strong senescence phenotype was also observed in our 1oo-day old ATM mutant organoids compared to their isogenic controls.
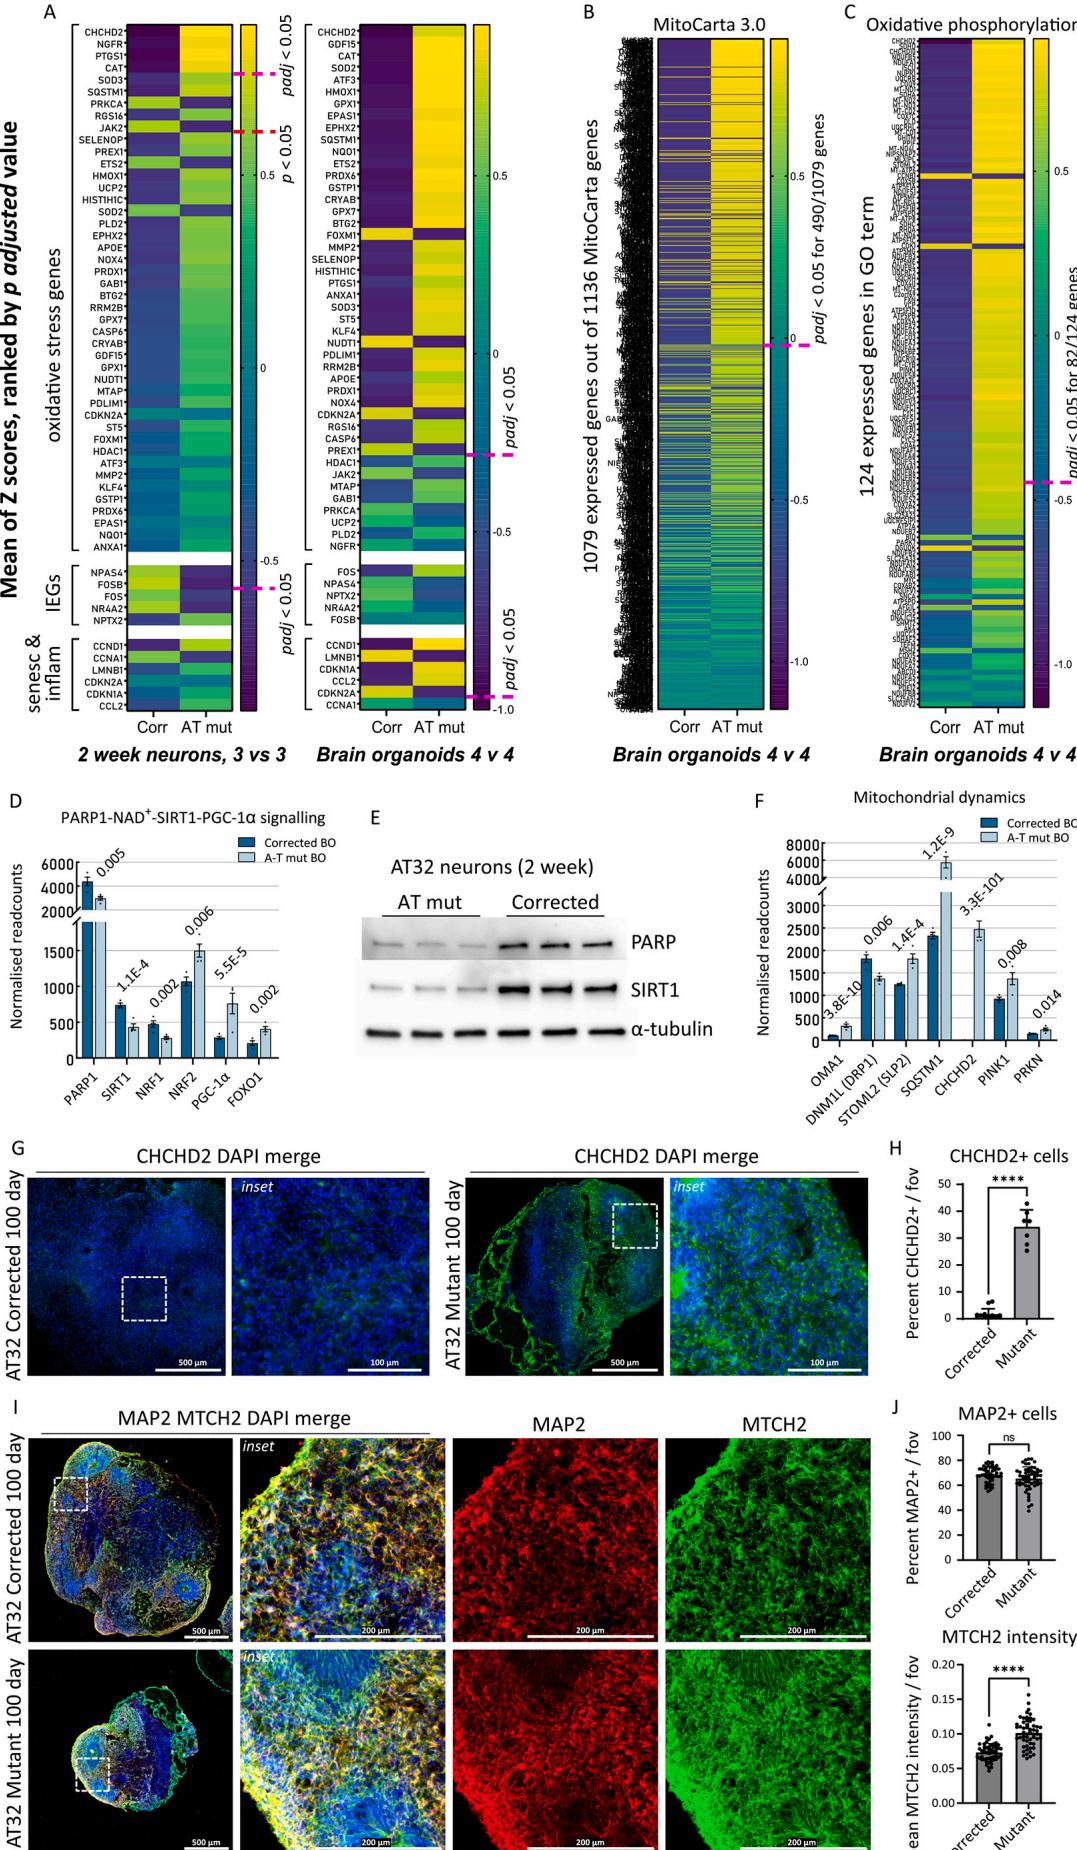
Fig. 5. Oxidative stress signatures and mitochondrial perturbances revealed in AT32 neurons and brain organoids A-C) The mean Z-scores were calculated from AT32 2-week-old neuron and 100-day-old brain organoid RNA sequencing data and were plotted as heatmaps for AT mutant and corrected, with genes ranked by their adjusted p value. The pink dashed line indicates where padj < 0.05 falls. A) A panel of oxidative stress markers,IEGs, and markers of senescence and inflammation were plotted comparing mutant and corrected neuron and brain organoids. B) The mean Z-scores of all expressed
MitoCarta 3.0 genes were plotted comparing AT mutant and corrected brain organoids, as well as for © all expressed genes comprising the GO term ‘Oxidative Phosphorylation’. D) Normalised readcounts of genes in the PARP1-SIRT1 signalling pathway from brain organoid RNA sequencing data, including PARP1, SIRT1, NRF1, NRF2 (NFE2L2), PGC-1α (PPARGC1A) and FOXO1. padj values as indicated. E) Western blot analysis of PARP and SIRT1 expression in whole cell extracts from 3 independent AT32 2-week-old neuronal cultures. α-tubulin was used as loading control. F) Normalised readcounts of genes involved in fission/fusion and mitophagy from brain organoid RNA sequencing data, including OMA1, DNM1L (DRP1), STOML2 (SLP2), SQSTM1 (p62), CHCHD2, PINK1 and PRKN. padj values as indicated. G) Representative immunofluorescence images of AT32 mutant and gene corrected brain organoid sections stained for CHCHD2. Scale bars 500 μm, inset 100 μm. H) AT32 mutant organoids had a significantly higher percentage of CHCHD2 positive cells [t(18) = 17.10, p ≤ 0.001], 7 to 10 FOV from 5 brain organoids. I) Representative immunofluorescence images of AT32 mutant and gene corrected brain organoid sections stained for MTCH2 and MAP2. Scale bars 500 μm, inset 200μm. J) The percentage of MAP2 positive cells remained unchanged [t(105) = 1.978, p = 0.051] while MTCH2 intensity was increased in AT32 mutant organoids [t(105) = 8.466, p ≤ 0.001], 50 to 55 FOV from 5 brain organoids. Error bars mean ± SD. BO; brain organoid. FOV; field of view. Corr; AT32 gene corrected; Mut;AT32 mutant. IEG; immediate early gene. GO; gene ontology. (For interpretation of the references to colour in this figure legend, the reader is referred to the web version of this article.)
By way of unbiased assessment, we analysed the mean gene expression for all genes included in the MitoCarta 3.O catalogue (Fig.5B).This catalogue comprises a comprehensive list of 1136 human genes encoding proteins with mitochondrial localisation.We also analysed all expressed genes comprising the oxidative phosphorylation GO term (Fig.5C). This showed significant mitochondrial impairment in ATM mutants,with enrichment of approximately half of the 1o79 expressed MitoCarta3.0 genes,and two thirds of genes involved in oxidative phosphorylation, particularly ubiquinol-cytochrome C reductases (UQCR genes) and NADH-ubiquinone oxidoreductase subunits (MT-ND,NDUF genes). Consistent upregulation of these genes led us to believe they are compensatory mechanisms for a chronic reduction in levels,in agreement with observations in AT null mice that were previously found to exhibit depleted levels of (Fang et al., 2016). This deficiency was downstream of poly(ADP-ribose) polymerase 1 (PARP1),and results in SIRT1 inactivation and subsequent defects in mitophagy and mitochondrial dysfunction.Hence,we investigated the PARP1-SIRT1 signalling pathway in our ATM mutant models,and included nuclear respiratory factor 1 (NRF1),a phosphorylation target of ATM (Chow et al., 2019) and NRF2 (regulated by ROS and/or ATM; (Navrkalova et al., 2015; Lee and Paull,202O), both of which are key transcription factors in mitochondrial biogenesis and antioxidant function (Scarpulla, 2oo8),and which interact with PARP1,SIRT1,and transcriptional co-activators PGC1α and FOXO1 (Hossain et al., 2009; Bai et al., 2015). We found mRNA levels of PARP1,SIRT1 and NRF1 were decreased in the ATM mutant organoids,consistent with a reduction of NRFl protein previously observed in ATM null cells (Chow etal.,2019),while NRF2,PGC-1α and FOXO1 were increased (Fig. 5D). In agreement with these observations, western blot analysis confirmed that protein levels of PARPl and SIRT1 were significantly decreased in ATMmutant neurons (Fig.5E).We further hypothesised that the changes in upstream regulators of mitochondrial network dynamics (CHCHD2,PARP1,PGC-1α) would have downstream impacts on genes controlling fission/fusion and mitophagy.Indeed,we identified disturbances in key fission genes OMA1,DNM1L (DRP1) and STOML2 (SLP2) (Wai and Langer, 2016) as well as significant upregulation of mitophagy genes SQSTM1 (p62), PINK and PRKN (Fig. 5F, Sup Fig.10 A).Next,we confirmed that upregulated CHCHD2 expression in ATM mutant organoids was reflected by protein expression levels, observing a significant increase in CHCHD2 immunofluorescence in AT32 mutant organoid sections compared to isogenic controls (Fig.5G, H). We also assessed whether the transcriptional upregulation of mitochondrial genes in mutant organoids correlated with altered mitochondrial content, by immunolabelling AT32 organoid sections with the mitochondrial outer membrane protein MTCH2 (Fig.5I).MTCH2 intensity was significantly increased in the mutant organoids,while the percentage of MAP2 positive cells remained unaltered (Fig. 5J).
¶ 3.5.AT patient-derived neuronal models display inflammation and senescence features associated with oxidative stress and mitochondrial dysfunction
A significant aspect of AT pathology and highly interconnected to mitochondrial dysfunction is cellular senescence; together they constitute two of the hallmarks of aging associated with AT (Aguado et al.,2022).Mitochondrial dysfunction is a prevailing feature and driver of cellular senescence (Wiley et al., 2Ol6), with aberrant fission and fusion, excessive ROS production, production of a pro-inflammatory secretory phenotype,and imbalances in mitochondrial metabolites,particularly NAD,shown to contribute to senescence phenotypes (Martini and Passos,2023;Miwa et al.,2022).We previously identified premature senescence in AT ONS-iPSC derived brain organoids compared to unrelated controls (Aguado et al., 2021),hence,we investigated the extent of senescence and inflammation in our AT32 mutant and isogenic organoids.
KEGG pathway analysis (Fig.4) indicated an increase in cellular senescence in ATM mutant brain organoids,and we analysed the mean expression for all transcribed genes comprising the Cellular Senescence GO term (Fig.6A).Nearly half of the genes comprising this GO term were significantly dysregulated.Normalised read count assessment of brain organoids identified classical markers of senescence,including increased levels of CCND1,CDKN1A (p21)and CCL2 in mutant BOs, while LMNB1 was reduced (Fig. 6B).2-week-old neuronal cultures did not demonstrate significant differences (Fig.5A).To determine if senescence would become evident upon further neuronal maturation, we generated AT32 mutant and corrected neurons and matured them for 10 weeks.Following this extended maturation,we detected a 3-fold increase in the percentage of cells that exhibit senescence-associated galactosidase staining in AT mutant neurons (SA Gal; Fig. 6C, D). Significant increases in expression of pl6 and p21 were observed via immunochemistry in the aged neuron cultures,confirming senescence levels in AT mutant neurons are increased (Fig. 6E-G).
¶ 3.6.Antioxidant treatment corrects oxidative stress and restores neuron function
To assess whether oxidative stress was upstream or downstream of mitochondrial dysfunction,we treated AT32 mutant neurons with the antioxidant acetyl cysteine (NAC) for1O days before oxidative stress levels were measured.NAC treatment reduced cytoplasmic CM-H2Xros signal by approximately (Fig.7A,B) though treatment did not offer improvement in mitochondrial membrane potential (Fig.7C).AT32 corrected,mutant,and NAC treated mutant neurons were immunolabelled for tubulin to measure neurite extension, branching and survival (Fig.7D).NAC treatment significantly rescued neurite outgrowth in ATM deficient neurons,restoring the percentage FOV coverage of mutant neurons to levels comparable to corrected neurons Fig.7E).To assess if NAC and/or treatment with the anaplerotic compound heptanoate(C7) normalised expression levels of the top genes dysregulated in AT neurons,RNA was isolated for gene expression analysis.CHCHD2 mRNA was reduced in AT neurons treated with NAC compared to the untreated counterparts while TUBB3 mRNA was unaltered (Fig.7F). SOD3,NPAS4,SYP and SLC17A7(VGLUT1)RNA eXpression in the treated AT neurons trended toward the corrected levels however did not reach levels of significance,indicating longer treatment periods may be necessary to correct these features (Sup Fig.10B).
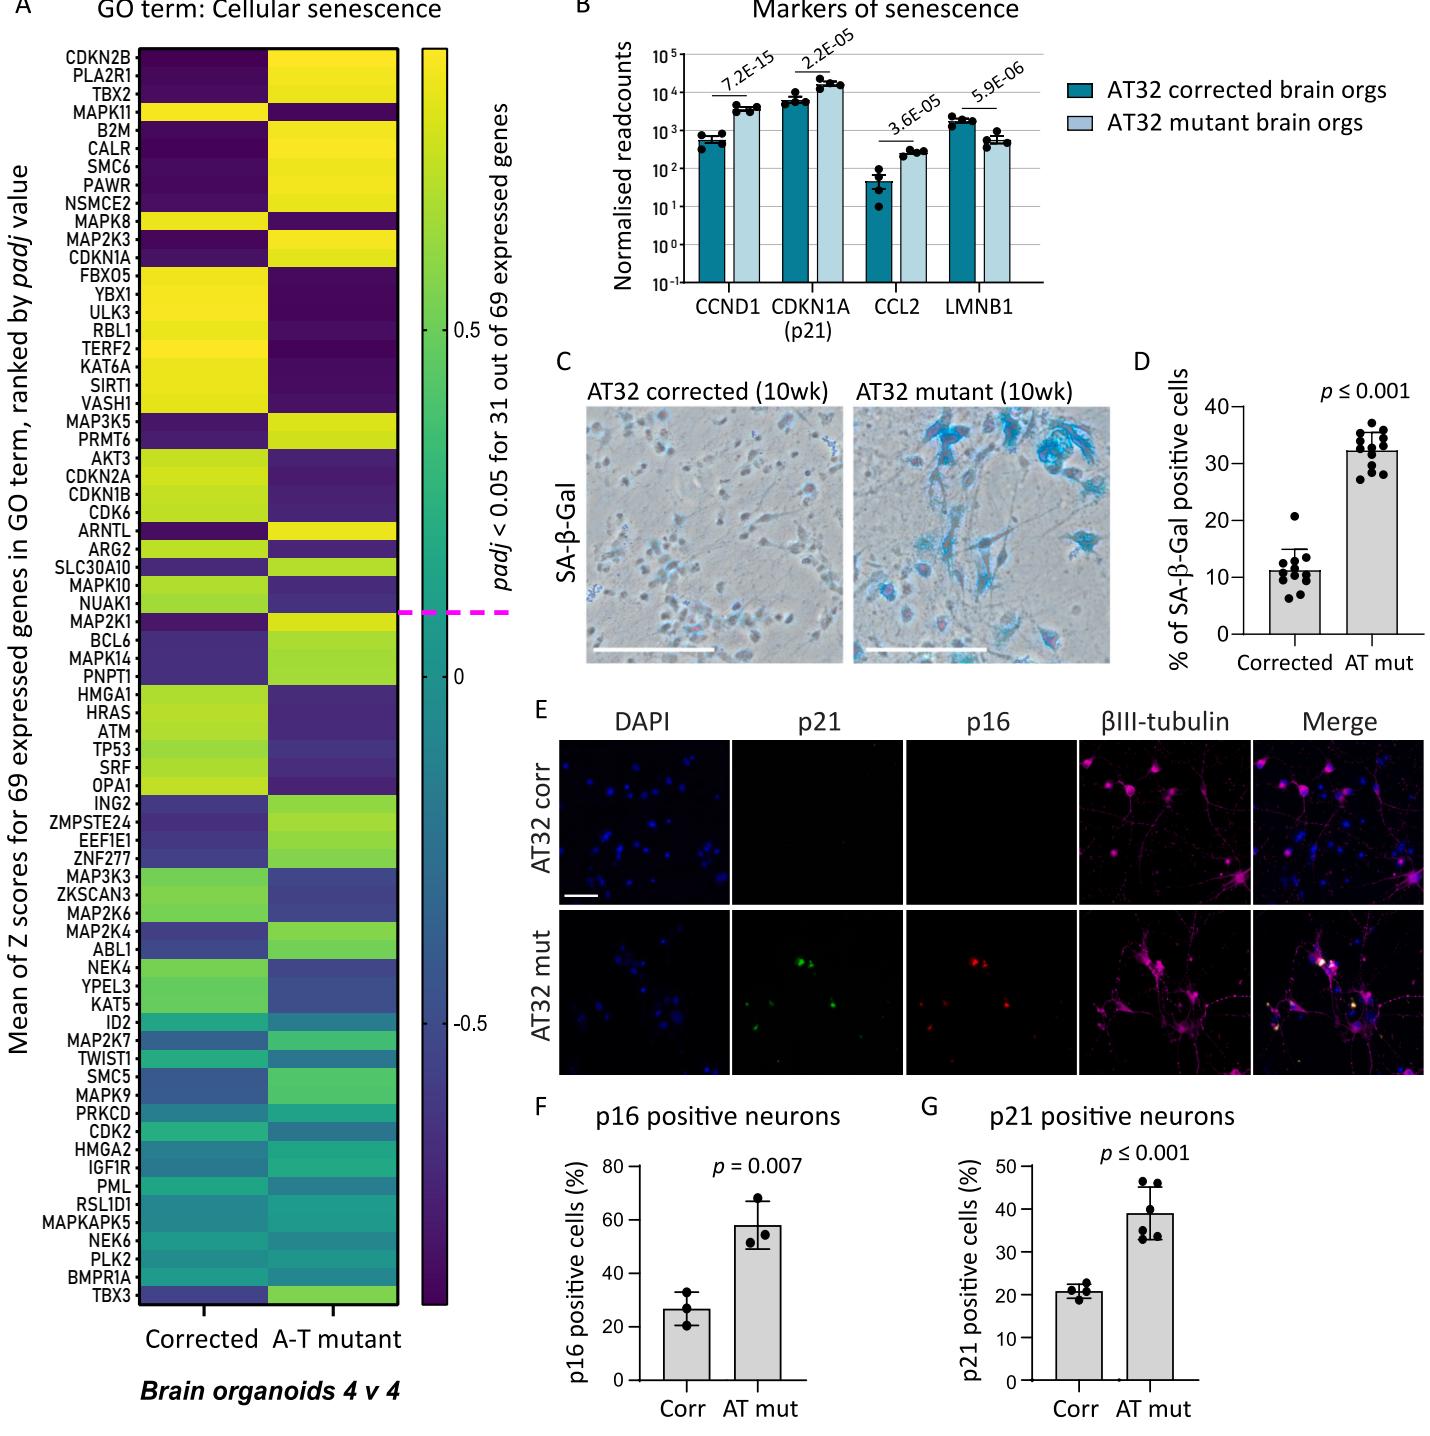
Fig.6.Senescence signatures revealed in AT32 neurons and brain organoids. A)emeanlxpCelle data. Genes were ranked by their adjusted value,and the pink dashed line indicates where padj falls.B) Normalised readcounts of markers of senescence from brain organoid RNA sequencing data,padj values as indicated.C) Representative images from SA- -gal assays performed on AT32 mutant and corrected 10- week-old neurons. Scale bar .D)AT32 mutant neurons had a significantly higher percentage of SA gal positive staining, .12 FOfroe and p16.Scale bar F) Quantification of pl6 positive neurons and G) p2l positive neurons . 3 independent differentiations.Error bars mean FOV;fieldofview.Corr;AT32 genecorrected; Mut; AT32 mutant.GO; geneontology.(Forinterpretationofthereferences to colour in this figure legend,the reader is referred to the web version of this article.)
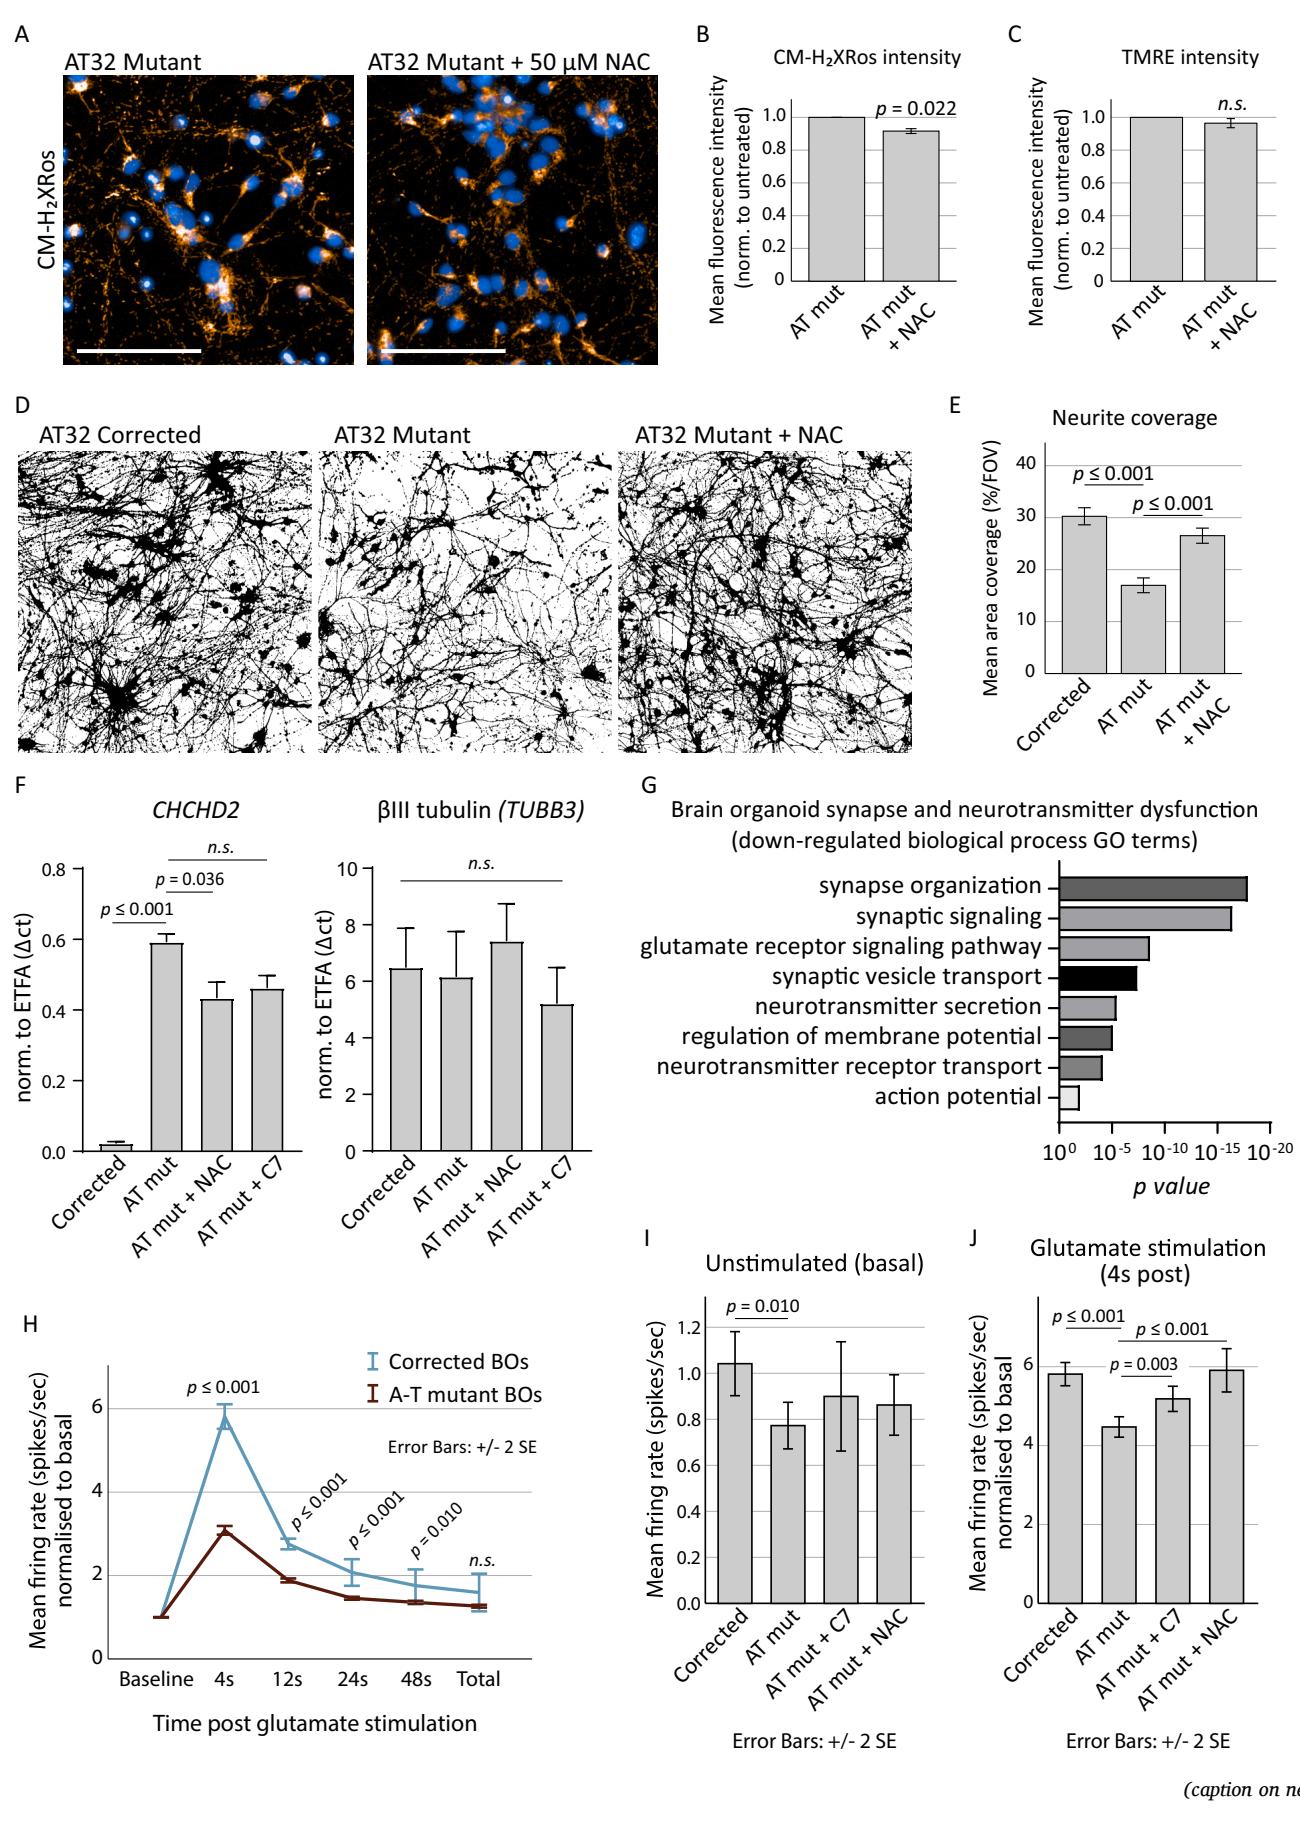
Fig. 7. Antioxidant treatment reduces oxidative stress and restores neuronal firing.
A) AT32 mutant neurons were treated with the antioxidant NAC for 10 days before oxidative stress levels were measured by CM-H2XRos. Scale bar 100 μm. B) CMH2Xros fluorescence intensity was reduced following NAC treatment; t (Bakkenist and Kastan, 2003) = 4.388, p = 0.022, though TMRE fluorescence intensity ©remained unchanged in the treated neurons; t(3) = 1.963, p = 0.072. Error bars mean ± SE. D) Representative binary βIII-tubulin immunochemistry of 3 independentAT32 corrected, mutant, and NAC treated mutant neuronal cultures. E) Binary βIII-tubulin immunochemistry was quantified to calculate the percentage coverage per FOV; F(2, 80) = 17.599, p ≤ 0.001, with Tukey post hoc analysis identifying a significant reduction (p ≤ 0.001) in mutant neurons compared to corrected, and a significant correction (p ≤ 0.001) of this phenotype with NAC treatment. Error bars mean ± SE. F) Total RNA was harvested from AT32 mutant and corrected neurons and used to quantify the mRNA expression levels of CHCHD2 and TUBB3. Mutant neuronal cultures were treated with either NAC or C7. ETFA was used as housekeeper gene. ANOVA [F(5, 15) = 57.26, p ≤ 0.001] and Tukey post hoc analysis determined significant differences in CHCHD2 mRNA levels, p values as indicated. TUBB3 mRNA expression remained unchanged [F(5, 18) = 0.2079, p = 0.955]. 3 independent replicates, error bars mean ± SD. G) GO analysis conducted on up and down DEGs separately identified significant downregulation of pathways involved in synapse function and neurotransmitter signalling. H) Brain organoids were adhered to electrode chips and baseline electrical activity was recorded, followed by addition of glutamate, using an MEA platform. Mean firing rate (spikes per second) were calculated in time windows post stimulation with glutamate (4, 12, 24, 48 and total seconds post glutamate addition) and normalised to the basal firing rate. Student’s t-test was used to determine significance, p values as indicated. Corrected organoids; 2834 active electrodes from 6 organoids on 4 MEA chips. Mutant; 4510 active electrodes from 5 organoids on 3 MEA chips. Error bars mean ± 2 SE. I-J) AT32 mutant brain organoids were treated with C7 and NAC for two weeks before being adhered to electrode chips. Baseline electrical activity was recorded, followed by addition of glutamate. Mean firing rate (spikes per second) were calculated for baseline and for glutamate stimulation normalised to baseline. (I) Significance was determined by Welch’s ANOVA for baseline neuronal activity [F (3,5491) = 3.286, p = 0.020] and Games-Howell post hoc analysis found a significant reduction in baseline firing in mutant compared to corrected (p = 0.01). (J)Glutamate stimulation revealed significant differences between untreated and treated mutant organoids [F(3,6435) = 18.428, p ≤ 0.001, Games-Howell post hoc analysis as indicated]. Error bars mean ± 2 SE. GO; gene ontology. MEA; multi-electrode array. NAC; N-acetyl cysteine. C7; heptanoate.
Given that AT patient iPSC-derived neurons displayed reduced IEG expression,and the enrichment of synapse and neurotransmitter pathway KEGG and GO terms in our AT organoid RNAseq data (Figs.4 and 5,and highlighted in Fig.7G),we decided to test the neuronal firing capacity of 1oo-day-old organoids on a multi-electrode array platform in the absence and presence of antioxidant treatments.This revealed that AT32 mutant organoids exhibit a significant reduction in their response to glutamate stimulation (Fig.7H),and showed a significantly reduced mean firing rate under resting (unstimulated) conditions compared to their gene corrected counterparts (Fig.7I).This reduction in the AT mutant organoids’capacity to respond to glutamate aligns with the GO term transcriptome analysis that identified the glutamate receptor signallng pathway as significantly downregulated in the mutant organoids (Fig.7G).Brain organoids were treated with the antioxidant NAC as well as C7,which replenishes TCAcycle activity and was shown to alleviate mitochondrial dysfunction and cell death in HBEC and AT patient-derived ONS cells under metabolic stress conditions (Yeo et al., 2021b).Brain organoids treated with C7 and NAC did not show improvements in unstimulated neuronal firing rates (Fig.7I),however when exposed to glutamate stimulation,the NAC and C7 treated AT mutant organoids displayed mean firing rates that were significantly increased compared to the untreated AT organoids,and in the case of NAC treatment, the firing rate was restored to that of the gene corrected organoids (Fig. 7J).
¶ 4.Discussion
ATM is an important master regulator of mitochondrial homeostasis and oxidative stress as confirmed by studies in murine models (Kamsler et al., 2001; Quick and Dugan, 2001; Chen et al., 2003) and in human patient cells (Reichenbach et al., 2002; Ambrose et al., 2007; ValentinVega et al., 2Ol2).Despite this,the extent of mitochondrial dysfunction and oxidative stress in patient neuronal cells remained uncharacterised. Here we,for the first time,utilise patient primary cells and iPSCs to examine mitochondrial content,membrane potential and oxidative stress levels in human neural models across different stages of maturation, from stem cells and neuronal progenitors to 2D neuronal cultures, and finally,brain organoids.Our findings are of particular importance when considering AT neuropathology,especially given that current in vivo models do not manifest key neurological abnormalities,including neurodegeneration,that are consistently observed in individuals with AT (Lavin, 2013).
We first interrogated mitochondrial content,membrane potential and ROS production in the olfactory epithelial-derived ONS cells from 5 AT patients as compared to controls,observing no disease-specific differences.Since AT ONS cells exhibit hypersensitivity to radiation, defective radiation-induced signalling and cell cycle checkpoint defects (Stewart etal.,2Ol3),our data indicate that mitochondrial impairments and oxidative stress in ATM deficient ONS cells are not merely a downstream result of accumulating nuclear DNA damage (Guo et al., 2010; Chen et al.,2O23).We next utilised iPSC derived from two of these AT patients to interrogate mitochondrial function over the course of neuronal maturation, from stem and progenitor cells through to brain organoids.We observed significant levels of mitochondrial impairments and oxidative stress that become progressively more pronounced with the increasing maturity of the neuronal model.
¶ 4.1.AT patient neurons show deficits in mitochondrial membrane potential and increased oxidative stress
Mitochondrial membrane potential is generated by the proton pumps during oxidative phosphorylation and primarily reflects the activity of the electron transport chain,serving as an indicator of mitochondrial function and cellular energy status.We observed significant reductions in mitochondrial membrane potential in AT patient-derived neurons when compared to control/isogenic corrected neurons,indicative of decreased mitochondrial function. Supporting this is the reversal of CM accumulation within the mitochondria.While increased CM fluorescence in iPSC and NPC cultures were consistent with increased oxidative stress levels observed previously (Ovchinnikov et al.,2O2O),their reversal to non-significance at 2 weeks and then decreased levels at 4 weeks was initially confounding.Mitochondrial sequestration of this dye is,however,dependent upon membrane potential and we concluded that the chronic loss of potential,combined with impaired mitochondrial homeostasis and mis-localisation,revealed in our neuronal models explained the decrease in CM intensity. Comparison of AT patient-derived neurons to control neurons treated with ATM inhibitors further supported this theory,as the acute ATM inhibition in neuronal models with otherwise healthy mitochondria did not reduce membrane potential and significantly increased accumulation in mitochondria,indicative of significant ROS production in the absence of ATM kinase activity,and is consistent with previous studies demonstrating that these inhibitors prevent ATM’s response to oxidative stress (Guo et al.,201O; Zhan et al.,201O). Antioxidant treatment was shown to reduce oxidative stress in ATM deficient neurons and promoted neurite growth and survival,but had no impact on membrane potential, suggesting that oxidative stress is a downstream process of impaired mitochondrial function and/or membrane potential. Transcriptomic analysis of neuron and brain organoids further demonstrate a strong oxidative stress phenotype that is more pronounced in the organoids,suggesting that oxidative stress compounds with the maturity and complexity of the model.
¶ 4.2.Processes of mitochondrial homeostasis,encompassing localisation, fission-fusion,mitophagy and biogenesis,are impaired inATpatient neurons and organoid models
Mitochondria are highly dynamic in nature,forming interconnected networks and actively migrating along neuronal processes to areas of high energy demand.They continuously engage in tightly controlled cycles of fission and fusion to maintain a functional population of mitochondria,underscoring the importance of mitochondrial health in the nervous system (Seager etal., 202O).We observed disparity between
AT neurons and control/isogenic corrected in terms of mitochondrial content and localisation within neuronal processes during the course of neuronal maturation,with reductions in soma mitochondrial presence coinciding with increases within neuronal projections at two weeks in culture,suggesting a shuttling of mitochondria to these processes, presumably as a compensatory mechanism to preserve neurite and synapse integrity.Neurons cultured up to 4 weeks no longer displayed this pattern,instead showing overall reductions.It is worth noting that while mitochondrial content diminished, the number of mitochondrial puncta within the neurites remained stable or increased, suggesting the lack of functional ATM compounds over time and leads to changes in the dynamics of mitochondrial architecture as they undergo fission,resulting in a fragmented mitochondrial network,as is observed in other neurodegenerative and age-related pathologies (Wai and Langer, 2O16; Mollo et al.,2O2O) and correlating with observations by Luo,Lyu (Luo et al., 2023)who found ATM inhibition promotes excessive mitochondrial fission.
Recent findings identified compromised mitophagy and mitofission, as well as reduced /SIRT1 signalling downstream of PARP1 in ATM null mice and in ATM-deficient cells (Fang et al., 2O16; Fang et al., 2014). supplementation was found to improve mitophagy as well as DNA repair,and reduced the severity of AT neuropathology (Fang et al.,2Ol6).Interestingly,we observed in our AT patient neuronal models that both PARP1 and SIRT1 transcript and protein levels are reduced.PARP1 and SIRT1 are both nuclear enzymes and share as a substrate,inhibiting each other’s activity.PARP1 activation causes rapid loss of mitochondrial potential and reactive oxygen species production while higher SIRT1 activity improves mitochondrial function, promotes mitochondrial biogenesis,and protects from ROs (Bai et al., 2015; Singh et al., 2018; Xu et al., 2018). ATM and PARP1 are known to form a molecular complex in vivo in the absence of cellular damage (Aguilar-Quesada et al., 2Oo7). In addition to direct interactions,ATM may also modulate the PARP/ /SIRT signalling axis via modulation of NRFl,one of the key transcription factors for mitochondrial biogenesis genes.NRF1 is a phosphorylation target of ATM when activated by oxidative stress,but not DNA damage,and phosphorylation results in NRF1 nuclear translocation and upregulation of mitochondrial and OXPHOS genes.Human brain samples show NFR1 expression is enriched in Purkinje neurons compared to other cerebellar neurons,and nuclear translocation of NRF1 is reduced in AT patient brain samples (Chow et al., 2019).
Taken together,we hypothesise that ATMmay regulate PARP/SIRT homeostasis by directly binding to PARP and/or via NRFl modulation of PARP activity.NRF1 and SIRT1 activate FOXO1 and to regulate mitochondrial homeostasis and biogenesis,transcript levels of which were all found to be disrupted in our AT patient brain organoids.In conjunction with disrupted PARP/SIRT signalling,dysregulation in some of the key signalling pathways responsible for fission (OMA1, DRP1,SLP2) and mitophagy (PCG-1α,SQSTM1,PINK1 and PRKN) lead us to conclude that ATMis a master regulator of mitochondrial turnover that can impose its influence via multiple avenues,and that lack of functional ATM protein directly leads to impaired fission-fusion balance, increased biogenesis as well as reduced mitophagy,resulting in accumulation of damaged mitochondria.
Brain organoids generated from AT patients further demonstrate impaired mitochondrial maintenance,with AT organoids containing significantly more mitochondrial content than isogenic organoids, indicating that as well as impairments in mitochondrial transport and fission fusion,there are severe deficiencies with mitochondrial turnover and/or biogenesis.This is supported by our transcriptomic analysis, where we observed altered gene expression related to mitochondrial dynamics.Of particular note is the large upregulation in CHCHD2 (MNRR1),a regulator of OXPHOS and of mitochondrial homeostasis (Aras et al.,2O15). Under stress conditions,mitochondrial import of CHCHD2 is inhibited,allowing accumulation in the nucleus where it functions as a transcription factor for a subunit of cytochrome c oxidase (COX) (Aras et al., 2013). Importantly, overexpression of CHCHD2 was found to induce the mitochondrial unfolded protein response,autophagy,and mitochondrial biogenesis (Aras et al., 2O2O),aligning with the significant increase in mitochondrial content observed in our AT brain organoids.CHCHD2 can also act as an inhibitor of apoptosis (Liu et al., 2015; Liu and Zhang, 2O15); interestingly, many anti-apoptotic factors are upregulated during the process of senescence (Salminen et al.,2Ol1),which has presented itself as a distinguishing feature in AT brain organoids,as discussed below.
AT is now also considered a premature aging disease,with mitochondrial dysfunction as a key hallmark of the aging phenotype. Our lab has previously demonstrated that AT brain organoids display a strong senescence phenotype compared to hEsC-derived control organoids, which could be rescued by inhibition of the cGAS-STING pathway (Aguado et al., 2021).Here we confirm this finding in 10o-day-old isogenic AT and gene corrected brain organoids,as well as in 10- week-old 2D neuronal cultures,which showed increased SA -Gal, p16 and p21 staining.Mitochondrial dysfunction is often an underunappreciated hallmark of aging and cellular senescence (Aguado et al.,2O22),and numerous studies indicate that impaired mitochondrial dynamics,such as decreased cycles of fission,contributes to the development of the senescence-associated secretory phenotype (SASP) and resistance to cell-death,with mitochondria becoming enlarged and hyperfused.Importantly,defects in mitophagy may also contribute to the induction of cellular senescence (Martini and Passos, 2O23). Aligning with our findings that PARP SIRT signalling and processes of mitophagy are disrupted,as well as observations of increased mitochondrial content,others have also found that supplementation was able to promote mitophagy in AT fibroblasts,and the enhanced mitophagy prevented the development STING-mediated senescence in a PINK dependent manner (Yang et al., 2021). supplementation also inhibited neurodegeneration and senescence phenotypes in -mice,and improved motor function and mitochondrial homeostasis.In light of these findings,and in combination with our observations of increased senescence in AT neuronal models,we conclude that mitochondrial dysfunction contributes to the aging phenotype of AT patients.
¶ 4.3.Impaired neuronal signaling in ATM organoids is rescued by antioxidant or anaplerotic treatment
A lesser studied aspect of ATMis its role in intracellular vesicle and/ or protein transport mechanisms,and its association with synaptic vesicles (Pizzamiglio etal., 202O). ATM binds to VAMP2 and SYNAPSINI,while ATM deficiency causes impaired cycling of synaptic vesicles, indicating a regulatory role for cytoplasmic ATM in neuronal activity (Li et al.,2Oo9).ATM has since been more specifically located in excitatory (VGLUT1) vesicles (Cheng et al., 2018).Accordingly,reducing ATM in hippocampal neuronal cultures resulted in an excitatory/inhibitory imbalance toward inhibition,an increased number of GABAergic synapses,and reduced neuronal excitability (Pizzamiglio et al., 2Ol6). Our findings strongly support these data, with GO and KEGG pathway analyses both indicating a reduction in synapse and vesicle transport terms, though it is probable that the significant mitochondrial impairments in our brain organoid models also contributes to downstream alterations in neuronal function.MEA analysis of 1oo day old brain organoids demonstrates reduced levels of unstimulated/basal firing activity,and a reduced capacity of the neurons to respond to glutamate stimulation, which could be alleviated by NAC or C7 treatment. This is the first example of a functional neuronal defect in AT patient derived brain organoids,and indicates that while ATM may have mechanistic roles in synapse function which are unlikely to be countered by antioxidant treatment, these treatments may support neuronal activity by boosting mitochondrial health and reducing oxidative stress.
In conclusion,our data suggest AT patient neurons display progressive oxidative stress phenotypes,impaired mitochondrial membrane potential, dysregulated mitophagy,and impaired regulation of fissionfusion processes.We uncovered alterations in gene expression patterns related to maintenance of mitochondrial dynamics,including significant upregulation of CHCHD2 and altered PARP/SIRT signalling,which contribute to mitochondrial defects.Further,we identified increased levels of senescence and reduced neuronal activity in AT brain organoids,recapitulating both the aging and neurodegenerative aspects of AT. Antioxidant treatment functionally ameliorated both AT brain organoids and neurons,improving neuronal firing rate and reducing ROs. Our study is the first to systematically map the nature and temporal modulation of mitochondrial dysfunction in non-transformed human neuronal cell types,and suggests that impairment of multiple ATM-dependent pathways involved in mitochondrial homeostasis and antioxidant signalling contribute to the neurodegenerative aspect of AT.
¶ Funding information
This research was supported by the Australian NHMRC (applications 1138795,1127976,1144806 and 1130168),BrAshA-T Foundation, Perry Cross Spinal Research Foundation and an ARC Discovery Project (DP210103401).
¶ Author contributions
J.A. performed staining and analysis shown in Fig. 6E,F,and prepared brain organoids for RNA sequencing. C.G.I. generated the results in Fig.6G-I.H.K.C.generated the human brain organoids.A.F.assisted with sequencing analysis. Z.H. performed staining shown in Sup Fig.3 and assisted with iPSC generation,differentiation and culture maintenance,and M.L.and A.M.S.provided the ONS cells and intellectual support.H.L.generated all other data,analysis and interpretation, designed the study,and wrote the paper.E.W.assisted with study design,data interpretation,manuscript writing and provided funding. All authors edited the paper.
¶ CRedit authorship contribution statement
Hannah C.Leeson:Writing-review & editing,Writing-original draft,Visualization,Validation, Supervision,Project administration, Methodology, Investigation,Formal analysis,Data curation, Conceptualization.Julio Aguado:Writing - review & editing,Investigation, Formal analysis.Cecilia Gómez-Inclan: Investigation,Formal analysis. Harman Kaur Chaggar:Methodology, Investigation.Atefah Taherian Fard:Formal analysis. Zoe Hunter:Methodology, Investigation.Martin F.Lavin:Resources,Conceptualization.Alan Mackay-Sim: Resources, Conceptualization.Ernst J.Wolvetang:Writing - review & editing,Writing - original draft,Supervision,Resources,Funding acquisition, Conceptualization.
¶ Declaration of competing interest
The authors declare that they have no known competing financial interests or personal relationships that could have appeared to influence the work reported in this paper.
¶ Data availability
Data will be made available on request.
¶ Acknowledgements
We thank Maria Kasherman and Shaun Walters from the School of Biomedical Sciences Microscopy and Image Analysis Facility (The University of Queensland) for technical support, and all E.W. laboratory members for discussions.We extend our sincere gratitude to the patients and their families for donating tissue,and for their enthusiastic support for our research.
¶ Appendix A. Supplementary data
Supplementary data to this article can be found online at https://doi. org/10.1016/j.nbd.2024.106562.
¶ References
Aguado, J., et al., 2021. Inhibition of the cGAS-STING pathway ameliorates the premature senescence hallmarks of Ataxia-telangiectasia brain organoids. Aging Cell 20 (9), e13468.
Aguado, J., et al., 2022.The hallmarks of aging in Ataxia-telangiectasia. Ageing Res. Rev. 79, 101653.
Aguilar-Quesada, R., et al., 2007. Interaction between ATM and PARP-1 in response to DNA damage and sensitization of ATM deficient cells through PARP inhibition. BMC Mol. Biol. 8, 29.
Ambrose, M., Goldstine, J.V., Gatti, R.A., 20o7. Intrinsic mitochondrial dysfunction in ATM-deficient lymphoblastoid cels. Hum. Mol. Genet. 16 (18), 2154-2164.
Amo, T., et al., 2011. Mitochondrial membrane potential decrease caused by loss of PINKl is not due to proton leak, but to respiratory chain defects. Neurobiol. Dis. 41 (1), 111-118.
Aras, S., et al., 2013. Oxygen-dependent expression of cytochrome c oxidase subunit 4-2 gene expression is mediated by transcription factors RBPJ, CXXC5 and CHCHD2. Nucleic Acids Res. 41 (4), 2255-2266.
Aras,S., et al., 2015. MNRR1 (formerly CHCHD2) is a bi-organellar regulator of mitochondrial metabolism.Mitochondrion 20, 43-51.
Aras, S., et al. 2020. Mitochondrial nuclear retrograde regulator 1 (MNRR1) rescues the cellular phenotype of MELAS by inducing homeostatic mechanisms. Proc. Natl. Acad. Sci. USA 117 (50), 32056-32065.
Bai, P., et al., 2015. Poly(ADP-ribose) polymerases as modulators of mitochondrial activity. Trends Endocrinol. Metab. 26 (2), 75-83.
Bakkenist, C.J., Kastan, M.B., 20o3. DNA damage activates ATM through intermolecular autophosphorylation and dimer dissociation. Nature 421 (6922), 499-506.
Beites, C.L., et al., 2oo5. Identification and molecular regulation of neural stem cells in the olfactory epithelium. Exp. Cell Res. 306 (2), 309-316.
Chen, P., et al., 2oo3. Oxidative stress is responsible for deficient survival and dendritogenesis in purkinje neurons from ataxia-telangiectasia mutated mutant mice.J. Neurosci. 23 (36), 11453-11460.
Chen,W.M., et al., 2023. DNA-PKcs and ATM modulate mitochondrial ADP-ATP exchange as an oxidative stress checkpoint mechanism. EMBO J. 42 (6), el12094.
Cheng,A., et al., 2018. ATM and ATR play complementary roles in the behavior of excitatory and inhibitory vesicle populations. Proc. Natl. Acad. Sci. USA 115 (2), E292-E301.
Chow, H.M., et al. 2019. ATM is activated by ATP depletion and modulates mitochondrial function through NRF1. J. Cell Biol. 218 (3), 909-928.
Cirotti, C., et al., 2021. Redox activation of ATM enhances GSNOR translation to sustain mitophagy and tolerance to oxidative stress. EMBO Rep. 22 (1), e50500.
Corti, A., et al.,2O19. DNA damage and transcriptional regulation in iPSC-derived neurons from Ataxia telangiectasia patients. Sci. Rep. 9 (1), 651.
Ditch, S.,Paull, T.T.,2012. The ATM protein kinase and celllar redox signaling: beyond the DNA damage response. Trends Biochem. Sci. 37 (1), 15-22.
Fang,E.F., et al., 2014. Defective mitophagy in XPA via PARP-1 hyperactivation and NAD(+)/SIRT1 reduction. Cell 157 (4), 882-896.
Fang, E.F., et al., 2016. NAD replenishment improves lifespan and Healthspan in Ataxia telangiectasia models via Mitophagy and DNA repair. Cell Metab. 24 (4), 566-581.
Funayama,M., et al., 2015. CHCHD2 mutations in autosomal dominant late-onset Parkinson’s disease: a genome-wide linkage and sequencing study. Lancet Neurol. 14 (3), 274-282.
Guo, Z., et al., 2010. ATM activation by oxidative stressScience 330 (6003), 517-521.
Hossain, M.B. et al., 2009. Poly(ADP-ribose) polymerase 1 interacts with nuclear respiratory factor 1 (NRF-1) and plays a role in NRF-1 transcriptional regulation. J. Biol. Chem. 284 (13), 8621-8632.
Ikeda, A. et al. 2019. Mutations in CHCHD2 cause alpha-synuclein aggregation. Hum. Mol. Genet. 28 (23), 3895-3911.
Ikeda, A., Imai, Y.,Hattori, N., 2022. Neurodegeneration-associated mitochondrial proteins, CHCHD2 and CHCHD10-what distinguishes the two? Front. Cell Dev. Biol. 10, 996061.
Imai, Y., et al.,2019. Twin CHCH proteins, CHCHD2, and CHCHD10: key molecules of Parkinson’s disease,amyotrophic lateral sclerosis,and frontotemporal dementia. Int. J. Mol. Sci. 20 (4).
Jansen, I.E., et al., 2015. CHCHD2 and Parkinson’s disease. Lancet Neurol.14 (7), 678-679.
Kamsler,A., et al., 2Oo1. Increased oxidative stress in ataxia telangiectasia evidenced by alterations in redox state of brains from Atm-deficient mice. Cancer Res.61 (5), 1849-1854.
Kann, O., Kovacs, R., 2oo7. Mitochondria and neuronal activity. Am. J. Phys. Cell Phys. 292 (2), C641-C657.
Kee, T.R., et al., 2021. Mitochondrial CHCHD2: disease-associated mutations, physiological functions, and current animal models. Front. Aging Neurosci. 13, 660843.
Kozlov, S.V., et al., 2016. Reactive oxygen species (ROS)-activated ATM-dependent phosphorylation of cytoplasmic substrates identified by large-scale Phosphoproteomics screen. Mol. Cell. Proteomics 15 (3), 1032-1047.
Lavin, M.F., 2013. The appropriateness of the mouse model for ataxia-telangiectasia: neurological defects but no neurodegeneration. DNA Repair (Amst) 12 (8), 612-619.
Lax, N.Z., et al., 2O12. Cerebellar ataxia in patients with mitochondrial DNA disease: a molecular clinicopathological study. J. Neuropathol. Exp. Neurol. 71 (2), 148-161.
Lee,J.H., Paull, T.T., 2020.Mitochondria at the crossroads of ATM-mediated stress signaling and regulation of reactive oxygen species. Redox Biol. 32, 101511.
Lee, P., et al., 2013. SMRT compounds abrogate cellular phenotypes of ataxia telangiectasia in neural derivatives of patient-specific hiPSCs. Nat. Commun. 4, 1824.
Leeson, H.C., etal., 2O2la. Ataxia telangiectasia iPSC line generated from a patient olfactory biopsy identifies novel disease-causing mutations. Stem Cell Res. 56, 102528.
Leeson, H.C., et al., 2021b. Reprogramming of human olfactory neurosphere-derived cells from olfactory mucosal biopsies of a control cohort. Stem Cell Res. 56,102527.
Li, J., et al., 20o9. Cytoplasmic ATM in neurons modulates synaptic function. Curr. Biol. 19 (24), 2091-2096.
Liu, Y., Zhang, Y., 2015. CHCHD2 connects mitochondrial metabolism to apoptosis. Mol. Cell. Oncol. 2 (4), e1004964.
Liu, Y., et al., 2015. CHCHD2 inhibits apoptosis by interacting with Bcl to regulate Bax activation. Cell Death Differ. 22 (6),1035-1046.
Liu, W., et al., 2020.Chchd2 regulates mitochondrial morphology by modulating the levels of Opal. Cell Death Difer. 27 (6), 2014-2029.
Lopriore,P., et al., 2022. Mitochondrial ataxias: molecular classification and clinical heterogeneity. Neurol. Int.14 (2), 337-356.
Luo, S., et al., 2023. Ataxia telangiectasia mutated protects against Lipopolysaccarideinduced blood-brain barrier disruption by regulating Atk/Drpl-mediated mitochondrial homeostasis. Shock 60 (1), 100-109.
Mackay-Sim, A., 20l2. Concise review: patient-derived olfactory stem cells: new models for brain diseases. Stem Cells 30 (11), 2361-2365.
Madabhushi, R., et al., 2015. Activity-induced DNA breaks govern the expression of neuronal early-response genes. Cell 161 (7), 1592-1605.
Martini, H., Passos, J.F., 2O23. Cellular senescence: all roads lead to mitochondria. FEBS J. 290 (5), 1186-1202.
Matsuoka, S., et al., 2O07. ATM and ATR substrate analysis reveals extensive protein networks responsive to DNA damage. Science 316 (5828), 1160-1166.
Miwa, S., et al., 2022. Mitochondrial dysfunction in cell senescence and aging. J. Clin. Invest. 132 (13).
Mollo, et al., 2020. Targeting mitochondrial network architecture in down syndrome and aging. Int. J. Mol. Sci. 21 (9).
Morita, A. et al., 20l4. Mitochondria are required for ATM activation by extranuclear oxidative stress in cultured human hepatoblastoma cell line Hep G2 cells. Biochem. Biophys. Res. Commun. 443 (4),1286-1290.
Navrkalova, V., et al., 2015. Oxidative stress as a therapeutic perspective for ATMdeficient chronic lymphocytic leukemia patients. Haematologica 100 (8), 994-996.
Nayler, S., et al., 2O12. Induced pluripotent stem cells from ataxia-telangiectasia recapitulate the cellular phenotype. Stem Cels Transl. Med.1 (7),523-535.
Nayler, S., et al., 2017. Lentiviral reprogramming of A-T patient fibroblasts to induced pluripotent stem cells. Methods Mol. Biol. 1599, 401-418.
Ovchinnikov, D.A., et al., 2020. Correction of ATM mutations in iPS cells from two ataxia-telangiectasia patients restores DNA damage and oxidative stress responses. Hum. Mol. Genet. 29 (6), 990-1001.
Pizzamiglio, L,et al., 2016. New role of ATMin controlling GABAergic tone during development. Cereb. Cortex 26 (10), 3879-3888.
Pizzamiglio, L., Focchi, E., Antonucci, F., 202o. ATM protein kinase: old and new implications in neuronal pathways and brain circuitry. Cells 9 (9).
Purandare, N., et al., 2018. The cellular stress proteins CHCHD10 and MNRR1 (CHCHD2): partners in mitochondrial and nuclear function and dysfunction. J. Biol. Chem. 293 (17), 6517-6529.
Quick,K.L., Dugan, L.L. 2oo1. Superoxide stress identifies neurons at risk in a model of ataxia-telangiectasia. Ann. Neurol. 49 (5), 627-635.
Reichenbach, J., et al., 2Oo2. Elevated oxidative stress in patients with ataxia telangiectasia. Antioxid. Redox Signal. 4 (3), 465-469.
Rimkus, S.A., et al., 2008. Mutations in string/CDC25 inhibit cell cycle re-entry and neurodegeneration in a Drosophila model of Ataxia telangiectasia. Genes Dev. 22 (9), 1205-1220.
Salminen, A., Ojala, J., Kaarniranta, K., 2O11. Apoptosis and aging: increased resistance to apoptosis enhances the aging process. Cell Mol. Life Sci. 68 (6),1021-1031.
Sarkar,A.,et al., 2021.Ataxia-telangiectasia mutated interacts with Parkin and induces mitophagy independent of kinase activity. Evidence from mantle cell lymphoma. Haematologica 106 (2), 495-512.
Scarpulla, R.C., 2oo8. Transcriptional paradigms in mammalian mitochondrial biogenesis and function. Physiol. Rev. 88 (2), 611-638.
Seager, R., et al., 2O2o. Mechanisms and roles of mitochondrial localisation and dynamics in neuronal function. Neuronal Signal. 4 (2) p. NS20200008.
Sherman, B.T. et al., 2022. DAVID: a web server for functional enrichment analysis and functional annotation of gene lists (2021 update). Nucleic Acids Res.50 (W1), W216-W221.
Shi, Y., Kirwan, P., Livesey,F.J., 2Ol2. Directed differentiation of human pluripotent stem cells to cerebral cortex neurons and neural networks. Nat. Protoc. 7 (10), 1836-1846.
Shiloh, Y., 2O2o. The cerebelar degeneration in ataxia-telangiectasia: a case for genome instability. DNA Repair (Amst) 95, 102950.
Shiloh, Y., Lederman, H.M., 2017. Ataxia-telangiectasia (A-T): an emerging dimension of premature ageing. Ageing Res. Rev. 33, 76-88.
Shiloh, Y., Ziv, Y., 2013. The ATM protein kinase: regulating the cellular response to genotoxic stress,and more. Nat. Rev. Mol. Cell Biol. 14 (4), 197-210.
Singh, C.K., etal., 2018. The role of Sirtuins in antioxidant and redox signaling. Antioxid. Redox Signal. 28 (8), 643-661.
Stewart, R., et al., 2013. A patient-derived olfactory stem cell disease model for ataxiatelangiectasia. Hum. Mol. Genet. 22 (12), 2495-2509.
Stracker, T.H., et al., 2O13. The ATM signaling network in development and disease. Front. Genet. 4, 37.
Valentin-Vega, Y.A., et al., 2012. Mitochondrial dysfunction in ataxia-telangiectasia. Blood 119 (6),1490-1500.
Vizioli, M.G., et al., 2o20. Mitochondria-to-nucleus retrograde signaling drives formation of cytoplasmic chromatin and inflammation in senescence. Genes Dev. 34 (5-6), 428-445.
Wai, T., Langer, T., 2016. Mitochondrial dynamics and metabolic regulation. Trends Endocrinol. Metab. 27 (2), 105-117.
Watters, D. et al., 1999. Localization of a portion of extranuclear ATM to peroxisomes. J. Biol. Chem. 274 (48), 34277-34282.
Wiley, C.D., et al., 2016. Mitochondrial dysfunction induces senescence with a distinct secretory phenotype. Cell Metab. 23 (2), 303-314.
Xu, J.,et al., 2018. Brain SIRT1 mediates metabolic homeostasis and neuroprotection. Front. Endocrinol. (Lausanne) 9, 702.
Yang, B., et al., 2021. NAD supplementation prevents STING-induced senescence in ataxia telangiectasia by improving mitophagy. Aging Cell 20 (4), el3329.
Yeo, A.J., et al., 202la. Impaired endoplasmic reticulum-mitochondrial signaling in ataxia-telangiectasia. iScience 24 (1), 101972.
Yeo, A.J., et al., 2O21b.An anaplerotic approach to correct the mitochondrial dysfunction in ataxia-telangiectasia (A-T). Mol. Metab. 54, 101354.
Zhan,H., et al., 2010. Ataxia telangiectasia mutated (ATM)-mediated DNA damage response in oxidative stress-induced vascular endothelial cell senescence. J. Biol. Chem. 285 (38), 29662-29670.
Zhang, J.,etal., 2015.ATMfunctions atthe peroxisome to induce pexophagy in response to ROS. Nat. Cell Biol. 17 (10), 1259-1269.